Abstract
The tsunami which struck the east coast of India on 26 December 2004 caused a significant impact at Kalpakkam coast. To study the effect of the tsunami on the coastal environment, high-resolution satellite images of pre (19 November 2004) and post (29 December 2004) data were used. Aerial images of Kalpakkam coast of 28 December 2004 were employed to demarcate precisely the inundation zones and assess the impact in detail on land-use/land-cover features. The area affected by the tsunami is mapped using satellite images. The prominent changes in vegetation pattern, water-logged areas, soil wetness, creek pattern and sand deposition were delineated with the help of visual analysis. The inundation mapping derived from satellite imagery was validated with the help of ground truth data obtained from the field survey on 28 December 2004. The present study shows that at Kalpakkam coast, inundation ranges between 95 and 530 m, and the run-up varies between 3.3 and 7.7 m. The morphological changes along the coast in the form of reappearance of old drainage have been observed. Coastal vegetation such as small shrubs and grasses was either washed away or uprooted. A fair amount of sediments, including traces of monazite sands, were deposited all along the coast.
1. Introduction
The world is facing increased incidence of disasters, both natural and man-made, that have destructive impacts around the globe (EM-DAT Citation2005, Hall Citation2005). The disasters associated with the coastal environment include mainly cyclones, tornados, hurricanes, floods, earthquakes, tsunamis, etc. The tsunami which struck the east coast of India on 26 December 2004 brought a huge amount of damage to life, property and environment (Chadha et al. Citation2005, Chandrasekharan et al. Citation2005, Jayakumar et al. Citation2005, Ramanamurthy et al. Citation2005, Singh et al. Citation2005, Singh et al. Citation2007). Beyond the heavy toll on human lives, the Indian Ocean tsunami caused an enormous environmental impact, such as morphological changes, change in ground water chemistry, change in the chemical composition of beach sediments and change in the coastal biodiversity (Nagendra et al. Citation2005, Ramasamy and Kumanan Citation2005, Reddy et al. Citation2005, Satpathy Citation2005). It has been reported that severe damage has been inflicted on ecosystems such as mangroves, coral reefs, coastal wetlands (Ramachandran et al. Citation2005), sand dunes and plant biodiversity (Kumaraguru et al. Citation2005). Studies have also shown that the tsunami has brought sediments from the sea bottom to the land (Kumar et al. Citation2007, Srinivasalu et al. Citation2007, Sujatha et al. Citation2008). The Kalpakkam coast has also suffered damage, and the morphology of the coast has changed markedly after the tsunami (Sasidhar and Anandan Citation2005). In view of the above, a study was undertaken with the objective to identify and map the morphological changes in land forms and loss in coastal vegetation due to tsunami surge by employing remote sensing and GIS technologies.
2 Study area
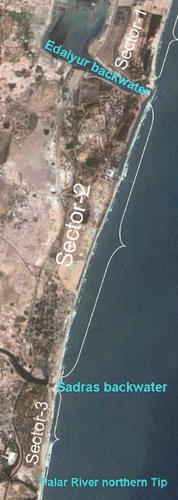
The study area which lies between 80°09′E longitude, 12°36′N latitude and 80°11′E longitude, 12°29′N latitude and is bounded with Buckingham canal on the western side and the Bay of Bengal on the eastern side is shown in the . The coast in this region is relatively flat and the foreshore is primarily composed of coarse sand. The coastal plains are characterized with vegetation like casuarinas, cashew nut, bushes, scrubs, grasses, etc.
Figure 1. Satellite image showing the study area divided into three sectors.
3 Materials and methods
To study the morphological changes due to tsunami surge, pre- and post-tsunami satellite data were used. For pre-tsunami assessment, IKONOS (2 February 2001) and IRS PAN + LISS III (19 November 2004) satellite images were acquired. Likewise, for the post-tsunami assessment, digital aerial imagery surveyed on 28 December 2004 was used. The pre- and post-tsunami satellite and aerial imagery were geo-corrected with the help of ground control points. The satellite and airborne data were analysed with the help of visual analysis techniques (NRSA Citation1989, Citation1990). The extent of seawater inundation was delineated by on-screen digitization by employing GIS software and the zone of flooding in the study area is shown in . By comparing the pre- and post-tsunami satellite data, the morphological changes and loss in the coastal vegetation cover were identified.
Figure 2. GIS layer showing tsunami inundation in the study area. Typical subset shows tsunami inundation reach in three modes: a, GIS layer; b, digital aerial imagery; and c, field photo.
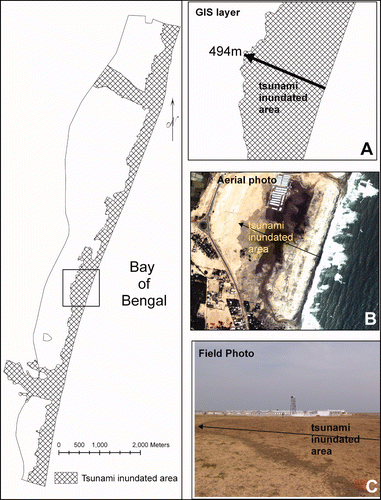
Field survey was carried out with GPS instruments immediately after the event (28 December 2004) to analyse the tsunami-affected area (Sasidhar and Anandan Citation2005). The extent of physical damage due to inundation for a typical subset is shown in (a, b and c). The run-up was measured (UNESCO Citation1997, UNESCO-IOC Citation2002) from the recorded water markings on the buildings, houses, permanent structures, etc. By comparing the pre- and post-tsunami satellite images, changes in the coastal morphology were identified based on the tone, texture, soil wetness, and stress in the vegetation pattern. To identify the loss in the vegetation cover, False Colour Composite (FCC) satellite images were used. In the FCC satellite image, vegetation cover gives a red tone. The absence of the red tone in some parts of the post-tsunami images was carefully examined and classified under vegetation loss after cross-checking with the pre-tsunami image.
To document the impact of tsunami surge, the study area was divided into three sectors: Sector 1 includes northern end of the study area to Edaiyur backwaters, Sector 2 includes the central part between Edaiyur backwaters to Sadras Backwaters, and Sector 3 includes Sadras backwaters to Palar river mouth. These three sectors are shown in .
4 Results and discussion
The changes in the Kalpakkam coastal environment due to tsunami surge were studied in detail using high-resolution satellite/aerial imagery. At Kalpakkam, the extent of inundation in the land varied between 95 and 530 m (, ). The sand ridges and thick vegetation cover acted as natural barriers and minimized the inundation. At sandy plains on the beach, the inundation reached up to 500 m. In the study area about 4 km2 surface area was inundated by the tsunami surge while the run-up varied between 3.3 and 7.7 m (). The field observations have indicated that the run-up depended mainly on local bathymetry and coastal topography (Jayakumar et al. Citation2005, Anandan and Sasidhar 2008).
Table 1. Tsunami impact at Kalpakkam.
Table 2. Run-up values at Kalpakkam.
4.1 Sector 1 ()
This sector is totally devoid of habitation. The morphology of this sector has been characterized by the plain beach bounded by sand dunes in the western side having a thick vegetation cover of Casuarinas and Pandanus. In this sector, nearly 1.10 km2 was inundated by the tsunami surge. The extent of inundation in this sector ranges between 95 and 530 m from the shore and run-up varies between 3.3 and 7.7 m ( and ). At specific locations, where dunes and casuarinas co-occurred, the combination has acted as a good natural barrier for inundation and in those areas only 95 m inundation was recorded. During the tsunami surge, older drainages resurfaced and were clearly discernible. Similarly, in some places new drainages were formed due to receding surge (). In this sector, small patches of coastal grass were also uprooted.
Figure 3. Impact of tsunami observed in the form of change in the coastal morphology and loss of vegetation cover at sector 1 (northern part of the study area).
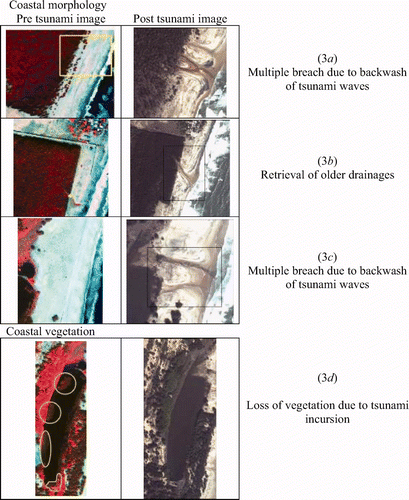
At Kokkilimedu village, distinct inundation patterns were observed in the satellite image due to three separate tsunami surges. The extent of inundation was measured as 430, 250 and 50 m, respectively. Furthermore, the field study conducted by Srinivasalu et al. (Citation2007) also suggested a series of water waves based on the deposition of multiple graded beds.
At three locations, older drainages resurfaced during the tsunami surge ( and c). The salinity in the water lake () increased due to seawater intrusion. The salinity levels of lake water were in the range of 2.82–8.08 psu during pre-tsunami and post-tsunami salinity levels were recorded in the range of 5.35–9.94 psu (Satpathy et al. Citation2008). This increase has adversely affected the algae growth in the lake ().
4.2 Sector 2 ()
Most of the area in sector 2 includes industrial units. The morphology of this sector has been characterized by a combination of sand dunes and flat beach covered with lush vegetation. The extent of inundation was less compared to the other two sectors. Nearly 1.89 km2 surface was inundated by the tsunami surge. The extent of inundation ranges between 125 and 485 m and run-up varies between 4.7 and 6.6 m ( and ). Further, it was observed that sands (with traces of monazites) were deposited along the shore.
Figure 4. Impact of tsunami observed in the form of change in the coastal morphology and loss of vegetation cover at sector 2 (central part of the study area).
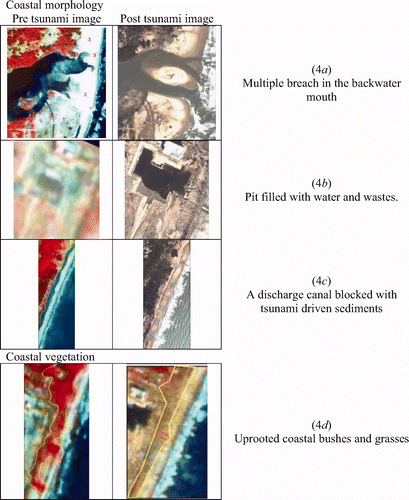
At Edaiyur estuary, during the tsunami, the sand bar near the estuary was breached at three new places, and it had four openings into the sea. The pattern and shape of the channel bars have also changed (). In the central part of this sector, a pit excavated for construction purposes at a distance about 150 m from shore was filled with the seawater (). Besides, a canal of 1.5 km length was filled with coastal sediments brought by the tsunami surge (). The presents the damage to scrubs, bushes and coastal grasses along the coast.
4.3 Sector 3 ()
Sector 3 consists of mainly residential dwellings where the extent of inundation ranges between 275 and 515 m from the shoreline and the run-up varies between 3.8 and 5.7 m. In this sector, nearly 0.94 km2 was inundated due to the tsunami surge.
Figure 5. Impact of tsunami observed in the form of change in the coastal morphology and loss of vegetation cover at sector 3 (southern part of the study area).
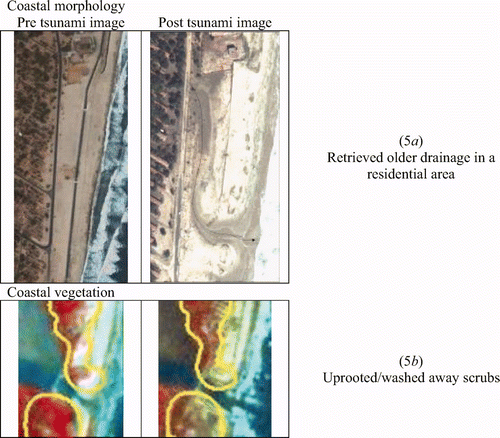
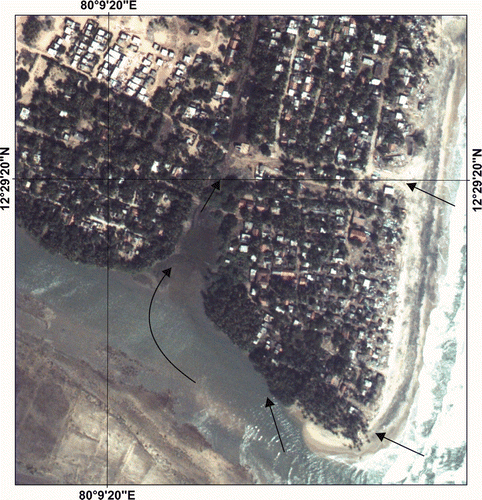
An older drainage resurfaced during this tsunami in this sector (). A tract of land consisting of scrub and grassy outcrops was either washed away or uprooted (). The scrub and grassy outcrops were similarly affected near Sadras village. During the tsunami, extensive sand deposition derived from the inner sea was deposited in the residential complexes up to a distance of 500 m from the shoreline. In this sector, a village – Oyyalikuppam, which is bounded on three sides by water bodies (sea in the east, Palar river in the south and Buckingham canal in the west) – was inundated by the tsunami surge from all three directions (), and property loss was estimated to be high.
Figure 6. Digital aerial imagery shows marooned Oyyalikuppam village due to multidirectional inundation (southern end of the study area).
5 Conclusion
On the Tamil Nadu coast (1076 km length), the shoreline changed considerably immediately after the tsunami. At Kalpakkam, transgression and regression of sea was observed. The shoreline has advanced at Kalpakkam and returned to its pre-tsunami levels after 16 months. The extent of inundation into land ranges between 95 and 530 m, and the run-up varies between 3.3 and 7.7 m. These impacts are controlled solely by local bathymetry and coastal topography. Morphological changes were identified along the coast in the form of drainage resurface and breaches in the river estuary. Small shrubs and grassy outcrops were either washed away or uprooted due to tsunami waves. However, Casuarinas offered good resistance to the tsunami waves and helped minimize the loss to life and property. The sand dunes with bio-shield were found to be an effective barrier to mitigate the impact of tsunami or natural sea wave surges.
Acknowledgement
The authors are grateful to the reviewers for their comments to improve the earlier version of the paper.
References
- Chadha , R. K. , Latha , G. , Yeh , H. , Peterson , C. and Katada , T. 2005 . The tsunami of the great Sumatra earthquake of M 9.0 on 26 December 2004: impact on the east coast of India 2005 . Current Science , 88 : 1297 – 1301 .
- Chandrasekharan , H. , Singh , V. P. , Rao , D. U. M. , Nagarajan , M. and Chandrasekaran , B. 2005 . Effect of tsunami on coastal crop husbandry in parts of Nagapattinam district, Tamil Nadu . Current Science , 89 : 30 – 32 .
- EM-DAT . 2005 . “ The OFDA/CRED International Disaster Database ” . Available online at: http://www.em-dat.net [accessed 18 August 2007]
- Hall , D. B. 2005 . “ 66 of the world's worst disasters ” . Available online at: http://acrpss.co.nz/ [accessed 18 August 2007]
- Jayakumar , S. , Ilangovan , D. , Kirti , A. N. , Gowthaman , R. , Gurudas , T. , Ganesh , N. N. , Ganeshan , P. , Mani murali , R. , Michael , G. S. , Ramana , M. V. and Bhattacharya , G. C. 2005 . Run-up and inundation limits along southeast coast of India during the 26 December 2004 Indian Ocean tsunami . Current Science , 88 : 1741 – 1743 .
- Kumaraguru , A. K. , Jayakumar , K. , Jerald wilson , J. and Ramakritinan , C. M. 2005 . Impact of the tsunami of 26 December 2004 on the coral reef environment of Gulf of Mannar and Palk Bay in the southeast coast of India . Current Science , 89 : 1729 – 1741 .
- Kumar , A. , Chingkhei , R. K. and Dolendro , T. H. 2007 . Tsunami damage assessment: a case study in Car Nicobar Island, India . International Journal of Remote Sensing , 28 : 2937 – 2959 .
- Nagendra , N. , Kamalakannan , B. V. , Sajith , C. , Sen , G. , Reddy , A. N. and Srinivasalu , S. 2005 . A record of foraminiferal assemblage in tsunami sediments along Nagappattinam coast, Tamil Nadu . Current Science , 89 : 1947 – 1952 .
- NRSA . 1989 . “ Manual Of Nationwide Land Use/Land Cover Mapping using Satellite Imagery, Part I ” . NRSA, DOS, Govt. of India .
- NRSA . 1990 . “ Manual of Nationwide Land Use/Land Cover Mapping using Digital Techniques, Part II ” . RRSSC, Nagpur, DOS, Govt. of India .
- Ramachandran , S. , Anitha , S. , Balamurugan , V. , Dharanirajan , K. , Ezhil vendhan , K. , Preeti divien , M. I. , Senthil vel , A. , Sujjahad hussain , I. and Udayaraj , A. 2005 . Ecological impact of tsunami on Nicobar Islands (Camorta, Katchal, Nancowry and Trinkat) . Current Science , 89 : 195 – 200 .
- Ramanamurthy , M. V. , Sundaramoorthy , S. , Pari , Y. , Ranga rao , V. , Mishra , P. , Bhat , M. , Tune , U. , Venkatesan , R. and Subramanian , B. R. 2005 . Inundation of sea water in Andaman and Nicobar Islands and parts of Tamil Nadu coast during 2004 Sumatra tsunami . Current Science , 88 : 1736 – 1740 .
- Ramasamy , S. M. and Kumanan , C. J. 2005 . TSUNAMI: The Indian Contest , Chennai : Allied Publishers Pvt Ltd .
- Reddy , H. R. V. , Katti , R. J. , Raveesha , K. P. , Chandrashekara Vikas , S. J. , Nagendra babu , R. S. and Shiva kumar , K. S. 2005 . Coastal water quality off Dakshina Kannada before and after tsunami . Current Science , 88 : 1026 – 1027 .
- Sasidhar , P. and Anandan , C. 2005 . “ Inundation Zone Mapping at Kalpakkam using RS and GIS techniques ” . Internal Report, SRI/AERB/August 05, 2005/IR1
- Satpathy , K. K. 2005 . Impact of tsunami on meiofauna of Marina Beach, Chennai, India . Current Science , 89 : 1646 – 1647 .
- Satpathy , K. K. , Mohanty , A. K. , Biswas , S. , Selvanayagam , M. and Prasad , M. V. R. A comparative account of water quality characteristics between pre- and post-tsunami periods in a coastal brackish water lake. International Water Association Proceedings . International Conference on Wetland Systems Technology in Water Pollution Control . November 1–7 2008 , Indore, India. Vol. II , pp. 627 – 633 .
- Singh , V. S. , Nandakumar , M. V. , Sarma , M. R. K. and Dimri , V. P. 2005 . Changes in groundwater regime at Neill Island (South Andaman) due to earthquake and tsunami of 26 December 2004 . Current Science , 88 : 1984 – 1987 .
- Singh , R. P. , Cervone , G. , Kafatos , M. , Prasad , A. K. , Sahoo , A. K. , Sun , D. , Tang , D. L. and Yang , R. 2007 . Multi-sensor studies of the Sumatra earthquake and tsunami of 26 December 2004 . International Journal of Remote Sensing , 28 : 2885 – 2896 .
- Srinivasalu , S. , Thangadurai , N. , Switzer , A. D. , Ram mohan , V. and Ayyamperumal , T. 2007 . Erosion and sedimentation in Kalpakkam (N Tamil Nadu, India) from the 26 December 2004 tsunami . Marine Geology , 240 : 65 – 75 .
- Sujatha , C. H. , Aneeshkumar , N. and Renjith , K. R. 2008 . Chemical assessment of sediment along the coastal belt of Nagapattinam, Tamil Nadu, India, after the 2004 tsunami . Current Science , 95 : 382 – 385 .
- UNESCO . 1997 . “ Post-Tsunami Survey Field Guide, Intergovernmental Oceanographic Commission, UNESCO IOC/ITSU ” . 19
- UNESCO-IOC . 2002 . “ UNESCO-IOC Manual No. 37, Post Tsunami Survey Manual ” .