Abstract
Shallow surficial failures or levee slides in the Mississippi River levee system are very common. There is currently no system to identify or predict the location of these slides before they occur. Studies of slide occurrence mechanisms suggest that probable slide-affected areas are characterized by anomalous vegetation. Compact Airborne Spectrographic Imager II (CASI II) imagery was analysed for selected levee sites in association with slide inventory data and field observations. Normalized Difference Vegetation Index (NDVI), Red edge Vegetation Stress Index (RVSI) and Red Edge Position Index (REP) were calculated from the acquired CASI II imagery. The vegetation indices were used to locate the stressed or anomalous vegetation and predict levee slides. The statistical significance of the predictors was determined by logistic regression. All predictors were found statistically significant for developing a slide prediction model. The slide prediction model was developed by combining the single predictors, categorized vegetation indices, into a model based on all three predictors. Percentage of Search Area Reduction (PSAR) and Failure Index (FI) were used to evaluate the performance of the slide prediction model. Evaluation of the model performance shows that it achieves a maximum FI of 0.43 and PSAR of 99.5.
1. Introduction
The occurrence of shallow surficial failures or slides () in the Mississippi River Levee System is very common. The United States Army Corps of Engineers Vicksburg District has repaired approximately 1000 slides since 1964 (Neuner 2002). The current method for detecting slides is by visual inspection, which is not an efficient use of time or funds.
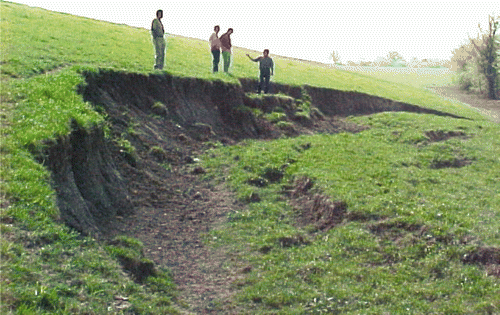
Figure 1. Levee slides (Hossain et al. 2006).
Recent studies have shown that remote sensing imagery can be used to successfully detect surficial failures in the levee system. Kuszmaul et al. (2004) used field data and multispectral imagery to demonstrate the association of levee slides with high moisture content of the levee surface. Airborne multispectral imagery was acquired for areas with limited vegetation cover along with direct measurements of soil moisture content. Space-borne multispectral imagery (IKONOS) was acquired over more heavily vegetated sites to map the relative variation in moisture content across the levee surface.
Hossain et al. (2006) evaluated the potential of commercially available high-resolution multispectral and hyperspectral imagery to detect levee slides. Field investigations were combined with image processing techniques including pan-sharpening, ISODATA clustering, Spectral Angle Mapper (SAM) classification, and Tasselled Cap transformation. QuickBird and IKONOS imagery were found to be suitable for detecting slides by visual inspection and for monitoring active slides. Soil Brightness Index (SBI) and Greenness Index (GI) obtained from a Tasselled Cap-transformed IKONOS imagery was used to develop a slide detection model.
After completion of a successful study to detect levee slides (Hossain et al. 2006), a second project was developed to test a remote sensing based technique to detect the potential weak zones along the levee that were not detected by visual inspection. Early detection of these weak zones would allow for repairs prior to periods of intense rainfall, including the hurricane season. Detection of the potential failure zones would assist in the allocation of maintenance funds for the repair of the levees.
It is believed that the levee slides are a consequence of an ageing process of the levee when the cycle of wet and dry seasons reduces the soil's water retention properties (Skempton1970). A heavy rainfall after an extended period of drying commonly triggers the slide (Sills 1983). The wet–dry cycle reduces the soil strength and the excess water triggers the slide (Hossain et al. 2006). Wetting and drying cycles lead to the translocation of clay particles and mechanical weathering, resulting in mechanical heterogeneities in the soil texture (e.g. Hillel 1998; Birkeland 1999; Kodikara et al. 1999). Plant stress results from the formation of cracks in soil that restrict water movement along capillary boundaries. There should be noticeable contrast in the plant vigour in these areas compared to the vegetation on undisturbed grounds. This contrast in vegetation response, especially in the near-infrared portion of the spectrum, may be useful to detect potential slides before they occur.
Hossain et al. (2006) found that certain types of plants grow in slide-affected areas (after the occurrence of slides) and appeared to be a good indicator of the existence of slides in the field. Although the size of the clusters of these plants were not as large as the 4-m resolution hyperspectral Compact Airborne Spectrographic Imager II (CASI II) imagery can detect by visual inspection, this imagery was used to detect slides with the Spectral Angle Mapper (SAM) classification algorithm using both field- and image-derived spectra.
The increased spectral resolution of the CASI II data and its ability to detect anomalous vegetation of approximately the same areal extent as slides made it suitable to develop the new remote sensing-based model to detect potential weak zones in the levee system. Since the slide occurrence mechanisms suggest that potential slide areas would be characterized by stressed or anomalous vegetation, this study focused on the potential of different vegetation indices (calculated from high-resolution hyperspectral imagery) to detect stressed or anomalous vegetation on the surface of the levee and compare these locations with the areas affected by later slides.
2 Study site
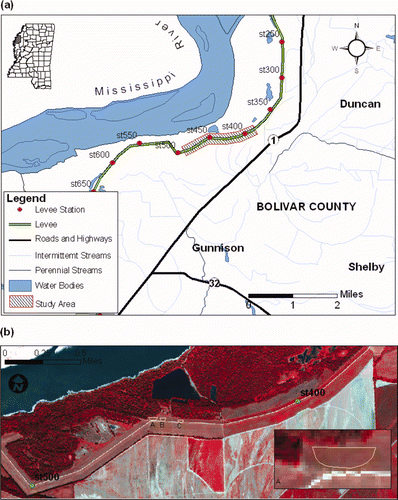
A 3-mile levee reach along the Mississippi River in Bolivar County, Mississippi was selected as the site for this study. The selected levee reach, located between stations 375 and 500, runs nearly parallel to the Mississippi State Highway 1 and is maintained by the Mississippi Levee Board. The site was selected because several parts of the levee have been affected by recent slides, a slide inventory for the levee is available for years 2001 and 2002, high-resolution hyperspectral imagery is available, and the levee is easily accessible from the nearby roads. The location and extent of the study area are shown in .
Figure 2. (a) Location and extent of study area. (b) Levee slides verified from field observations shown on the analysed CASI II imagery.
3 Data used and processing
The data used for this study include (1) slide inventory data, (2) field data from the levees, and (3) airborne hyperspectral imagery. The levee slide inventory data were compiled by the Mississippi Levee Board and included assessment of two slides in 2001 and two slides in 2002. The levee slide data was collected in 2001 during field surveys in the spring and summer months. Fieldwork was conducted in June and September 2003 and February 2004 to study the types and pattern of vegetation on the levee and to collect ground control points (GCP) and Global Positioning Systems (GPS) data for slide locations.
Airborne hyperspectral CASI II imagery was obtained from the Geosystems Research Institute (GRI) (formerly Remote Sensing Technology Centre, RSTC) at Mississippi State University. The data were originally acquired for the Delta Research and Extension Centre (DREC) of Mississippi State University by ITRES. Hyperspectral imagery divides the electromagnetic spectrum into very narrow bandwidths to allow for more precise spectral analysis. The imagery used in this study has aerial coverage of 3489 (along track) by 573 (across track) pixels and was tasked to collect data in 48 spectral bands between 415.8 nm and 946.7 nm. Specific wavelength information for each band is provided in . The imagery was acquired on 25 September 2001 and recorded as 16-bit data at 4-m spatial resolution. The acquired CASI II imagery and the locations of the studied levee slides verified from field observations are shown in .
Table 1. Band wavelengths (in nm) of the used CASI II imagery.
3.1 Pre-processing of hyperspectral imagery
It is a common practice for airborne hyperspectral sensors to acquire imagery in multiple parallel flightlines to provide the areal coverage desired. Multiple flightline data acquisition is necessary because (1) limitations on the sizes of Charge Coupled Device (CCD) arrays make it impossible to acquire high-resolution data covering large areas, and (2) the necessity of data normalization within a single flightline to take into account the view angle effect, which is typical when the field-of-view of the sensor is large. A common strategy is to minimize this effect by acquiring many overlapping flightlines, such that the range of off-nadir view angles within any single flightline is quite small (Asmat et al. 2008). When multiple flightlines are required, it is necessary to standardize the radiometry of the flightlines before geophysical variables are derived from the mosaic of the multiple flightlines.
The CASI II data obtained from RSTC were acquired in multiple flightlines to cover the selected areas in the Mississippi Delta. The imagery were delivered atmospherically corrected, pre-processed (calibrated DN imagery). However, to limit errors that might be introduced from the acquisition of imagery from multiple flightlines, a single flightline was used for this study.
Since the primary focus of this study was to explore the potential of different vegetation indices to detect anomalous areas of vegetation on the levee surface, spectral curves for different vegetation in the study site were analysed to locate the extent of the red edge within the spectral bandwidth of the data. The red edge is defined as the ramp in green vegetation reflectance between the red and near-infrared wavelengths (Eyers and Mills 2005). The vegetation spectra were derived from the image by selecting representative vegetation types and then using the ENVI 3.2 image processing software spectral profile extraction tool. It was found that the red edge for the vegetation within the area of interest lies between 684.2 and 741.5 nm with an error margin of ±5.9 nm (bands 25–30). Therefore, the imagery was spectrally subset to provide data for bands 25–30 for calculating the vegetation indices required for this study. Due to the use of the single flightline and single date imagery, it is expected that the influence of the atmospheric correction and DN values would not influence the calculation of the vegetation indices for this study.
4 Vegetation indices
Normalized Difference Vegetation Index (NDVI) (Rouse et al. 1973) and two vegetation indices utilizing the ‘red edge’, Red edge Vegetation Stress Index (RVSI) (Merton and Huntington 1999), and Red Edge Position (REP) index (Ruiliang et al. 2003) were calculated using the CASI II imagery. These indices were used to detect stressed or anomalous vegetation on the levee.
4.1 Normalized Difference Vegetation Index
Normalized Difference Vegetation Index (NDVI) is one of the most widely accepted and utilized vegetation indices. NDVI was first ascribed by Rouse et al. (1973), although the concept was discussed by Kriegler et al. (1969). NDVI can be used as an indicator of relative biomass and greenness (Boone et al. 2000). It uses the high and low reflectance values of vegetation in the near infrared (NIR) and red regions of the electromagnetic spectrum. NDVI is based on a ratio of the NIR and the red bands, eliminating any discrepancies that may occur in the imagery due to sensor differences or image quality issues, such as brightness, or other interferences. The NDVI may be computed for a wide variety of sensors (Jensen 1996). The formula to calculate NDVI using any visible and near infrared data is:
where near infrared and red are pixel values of the NIR and R bands, respectively.
The CASI II imagery consists of 48 bands which recorded signals between 414.0 nm (±5.7 nm) and 948.7 nm (±5.9 nm). The red region of electromagnetic spectrum (EMS) includes bands 20–26, while the NIR region of the EMS includes bands 27–48. There is no universally accepted way to select the bands for calculating the NDVI from hyperspectral imagery. In this study for healthy vegetation, the band with the lowest mean pixel values in the red region (band 25 for CASI) and the band with the highest mean pixel values in the infrared region (band 30 for CASI) were used to calculate NDVI. This band ratio calculation is as follows:
The objective of this analysis was to determine the distribution of stressed or anomalous vegetation in NDVI imagery.
4.2 Red edge shift indices
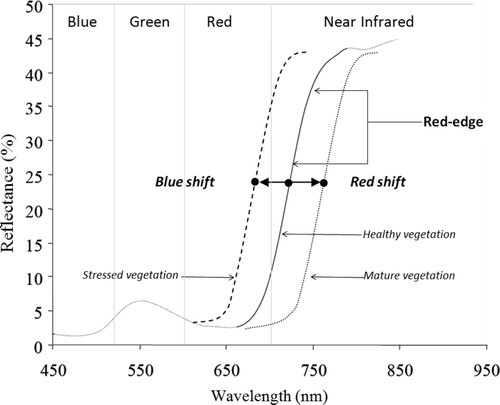
The red edge is shown as a steep increase in vegetation reflectance in the transition zone between the red and near infrared regions of the spectrum (). The red edge is typically located between 680 and 750 nm, is related to the concentration of chlorophyll in the vegetation canopy (Miller et al. 1991) and may be characterized by the position of maximum slope or REP (Eyers and Mills 2005). Experimental and theoretical studies show that the red edge shifts according to changes of chlorophyll content (Belanger et al. 1995), Leaf Area Index (LAI) (Danson and Plummer 1995), biomass and hydric status (Filella and Peñuelas 1994), age (Niemann 1995), plant health levels (Vane and Goetz 1988), and seasonal pattern (Miller et al. 1991). The slope and position of the red edge change under stress conditions and in response to senescence (Rock et al. 1988). The red edge position shifts towards the shorter wavelengths usually due to geochemical and/or water stress caused by excessive water. This condition is called a ‘blue shift’ (Merton 1998). When a plant is mature and healthy with high chlorophyll content and high LAI, the red edge position usually shifts toward the longer wavelengths (Ruiliang et al. 2003). This condition is called a ‘red shift’ (Merton 1998). The positions of red edge for typical healthy, stressed and mature plants are illustrated in by average reflectance curves.
Figure 3. Typical vegetation spectrum showing the shifting of the red edge due to stress condition and maturity of vegetation (adopted from Lauden et al. 2003; Merton 1998; Eyers and Mills 2005).
The behaviour and characteristics of the red edge profile are in response to different scenarios of vegetation stress caused mostly by drought condition and plant disease. We used the behaviour of the red edge profile to detect the vegetation stress in the levee due to changes in the clays as they age and begin to develop slide characteristics.
4.2.1 Red edge Vegetation Stress Index.
Researchers have demonstrated the behaviour of the red edge using spectral reflectance measurements obtained either in the laboratory or from airborne sensors. Merton and Huntington (1999) developed the Red edge Vegetation Stress Index (RVSI) to show the changes in the red edge geometry using the Airborne Visible/Infrared Imaging Spectrometer (AVIRIS) imagery. AVIRIS is a hyperspectral sensor, which acquires data in 224 contiguous channels with wavelengths from 400 to 2500 nm. RVSI measures the spectral concavity as a displacement in reflectance between a ‘modelled’ linear mid-point (defined as the mean reflectance of two bisecting points; the red edge break-point (∼0.716 μm) and the start of the NIR plateau) and the ‘data’ mid-point value and it is defined as:
where ρ 714 is the reflectance value at the band with wavelength 714 nm and ρ 752 is the reflectance value at the band with wavelength 752 nm, and ρ 733 is the modelled reflectance value at wavelength 733 nm.
As this index is designed to measure stress, positive index values indicate increased degrees of relative stress. Conversely, negative index values are calculated for convex upper red edge curves. A zero value marks a probable transition between stressed and non-stressed values.
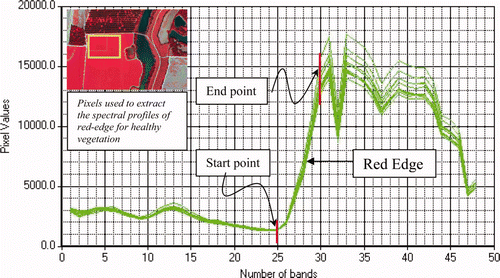
In this study, we did not have the modelled reflectance value at 733 nm for the CASI II imagery. Therefore, we compared the red edge data mid-point values manually with the reflectance values of healthy vegetation to interpret the shifting of the red edge geometry, and thereby determined the ‘blue shift’ and ‘red shift’ in the vegetation. The data mid-point values were obtained for the used CASI II imagery using the average DN values of band 25 and band 30, which mark the starting and ending wavelengths of the red edge for healthy vegetation in the study site. The part of the CASI II imagery that was used to extract the profile of red edge for healthy vegetation and the extracted spectral curves with the red edge are shown in .
Figure 4. Spectral profiles used to derive RVSI in CASI II imagery.
4.2.2 Red edge position.
Ruiliang et al. (2003) derived the Red edge Position (REP) index using Hyperion data. Hyperion is the NASA's first spaceborne hyperspectral sensor, which acquires data in 220 contiguous channels from 400 to 2500 nm with 30-m spatial resolution. REP is defined as the wavelength position of the greatest first-order derivative spectrum. The REP index can be calculated by using a four-point linear interpolation method (Ruiliang et al. 2003). The interpolation assumes that the reflectance curve at the red edge can be simplified to a straight line centred near a mid-point between 670 and 780 nm. The REP index is calculated in two steps: (1) calculation of the reflectance at the inflection point along the red edge of reflectance, and (2) calculation of the wavelength of the reflectance at the inflection point.
where λ 1, λ 2, λ 3 and λ 4 are the wavelengths of 670, 700, 740 and 780 nm, respectively; and ρ 1, ρ 2, ρ 3 and ρ 4 are the reflectances at the corresponding wavelengths, respectively.
In this study, the REP was calculated for CASI II imagery using the reflectances associated with the red edge in the derived spectral profile for healthy vegetation (). The wavelengths and reflectances of corresponding wavelengths used for REP calculation were obtained from bands 25 (ρ 680), 26 (ρ 700 and λ 700), 28 (ρ 720 and λ 720), and 30 (ρ 740) of CASI II imagery.
where λ 700 and λ 720, are the wavelengths of 700 and 720 nm, respectively; and ρ 680, ρ 700, ρ 720 and ρ 740 are the reflectances at 680, 700, 720 and 740 nm wavelengths of CASI II imagery, respectively.
5 Evaluation of prediction potential
Logistic regression is a variation of ordinary regression that is used when the observed outcome is qualitative or categorical and restricted to two values, which usually represent the occurrence or non-occurrence of the outcome event (usually coded as 1 or 0) (Hosmer and Lemeshow 1989; Agresti 1996). It produces a formula that predicts the probability of the occurrence as a function of the independent variables and is expressed as follows:
where p is the probability of the occurrence and Y is a function of the independent variables.
Logistic regression fits a special S-shaped curve by taking the linear regression, that could produce any Y-value between minus (–) infinity and plus (+) infinity. It transforms the produced Y-value (independent variables) with the described probability function, which produces p-values between 0 (as Y approaches –infinity) and 1 (as Y approaches + infinity). Logistic regression was performed using the derived vegetation indices in conjunction with the locations of known slides. The objective of this analysis was to determine statistical significance of the predictors. Microsoft Excel STAT was used to perform the regression analysis. The values of the logistic regression model parameters, Chi-square and Pr. > Chi-square were used to evaluate the significance level of the analysed predictors.
5.1 Chi-square
Chi-square is a statistical test, commonly used to compare observed data with expected data according to a specific hypothesis (Fisher and Yates 1963). Chi-square assesses the goodness of fit between an obtained set of frequencies in a random sample and the expected result of a statistical hypothesis. For example, chi-square is used to determine if there is reason to reject the statistical hypothesis that the frequencies in a random sample are as expected when the items are from a normal distribution. Chi-square is the sum of the squared difference between observed (O) and the expected (E) data, divided by the expected data in all possible categories. Chi-square is expressed as follows:
If the observed (O) data is the same as the expected (E) data the value of X2 will be close to zero. The greater the deviation between the observed data and the expected data the larger the value of X2, and the value of X2 indicates the degree of discrepancy from the expected values (Levine et al. 2001). Low chi-square values indicate good fit of the model and higher probability of the hypothesis being correct, whereas high chi-square values indicate poor fit of the model and lower probability of the hypothesis being correct. How large the value of X2 should be for a hypothesis to be rejected depends on the chi-square value for a given degree of freedom.
5.2 Pr. > Chi-square
Pr. > Chi-square denotes the probability associated with chi-square, which is a parameter of logistic regression analysis obtained as output to evaluate the significance level of analysed independent variable or predictors. A higher value of probability corresponding to chi-square indicates that the predictors in the model are statistically significant. On the other hand, a lower value of probability corresponding to chi-square indicates that the predictors in the model are statistically insignificant.
6 Categorization of predictors
Observations of the pixel values of each predictor and the location of the slide-affected areas suggest that the predictors would be more useful in predicting slides if the pixel values of each predictor were grouped categorically. Therefore, the pixel values of NDVI, RVSI and REP images were classified into different categories on the basis of the capability of the indices to detect stressed or anomalous vegetation.
6.1 Normalized Difference Vegetation Index
The NDVI from CASI II imagery was divided into three categories: (1) bare soil or thin vegetation, (2) stressed vegetation, and (3) healthy vegetation. The thresholds used for these categories were derived from the comparison of field observations and features shown in the unclassified image and using standard spectral curves for classified features. The classified NDVI imagery is shown in . The thresholds values used for this classification are:
Figure 5. Classified NDVI imagery (for Zone 2) from September 2001 CASI II imagery.
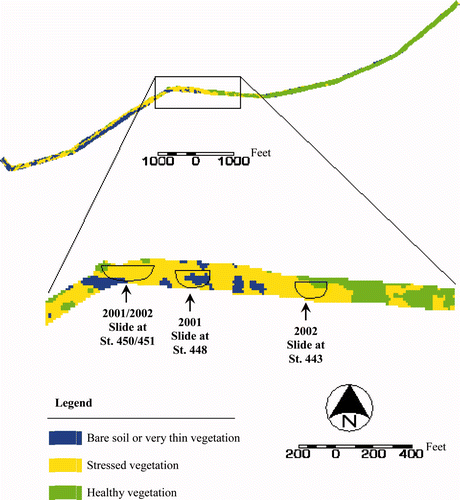
| 1. | bare soil or thin vegetation ≤0.397, | ||||
| 2. | stressed vegetation >0.397 to ≤0.483, and | ||||
| 3. | healthy vegetation >0.483. | ||||
6.2 Red edge Vegetation Stress Index
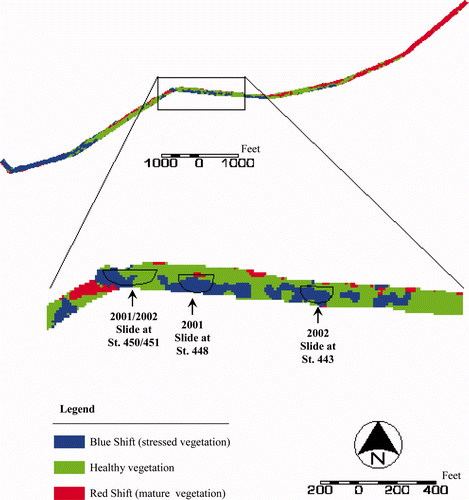
The RVSI from the CASI II imagery was used to interpret the shift of the red edge of the vegetation spectral signature in the study area. The objective of this red edge shift interpretation was to generate data of stressed vegetation and compare it with the NDVI data. In the CASI II imagery of the study area healthy vegetation was selected using the standard spectral curve for healthy vegetation (), and it was observed that the average of DN value in band 25 (start of red edge) () and band 30 (end of red edge) () for healthy vegetation varies from 4500 to 5000 in the study area.
The pixel values obtained by equation (4) (the data mid-point values for CASI II imagery to be used in RVSI) were compared with pixel values included in the healthy vegetation zone to determine the blue and red shift in the vegetation. A DN value of less than 4500 is considered stressed vegetation or a ‘blue shift’, and pixels with a DN value greater than 5000 are considered healthy vegetation or a ‘red shift’. Therefore, the RVSI image was classified into three categories: blue shift (stressed vegetation), healthy vegetation, and red shift (more mature vegetation). The classified RVSI imagery is shown in .
Figure 6. Classified RVSI imagery (for Zone 2) from September 2001 CASI II imagery. (Available in colour online).
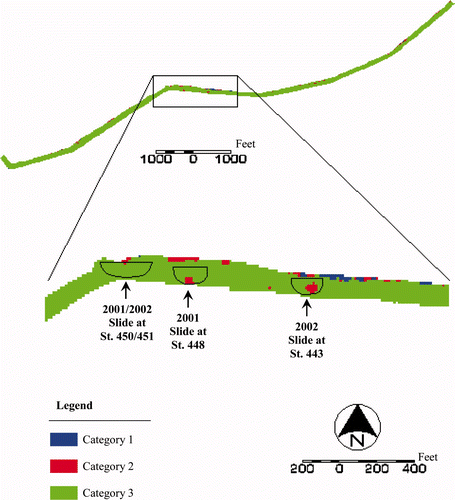
6.3 Red Edge Position
The calculation of REP from the September 2001 CASI II imagery provided a single band image where the pixel value (wavelength in nm) represents the location of the red edge for each pixel (red edge inflection point). To extract the wavelength information for the vegetated area, the image was subset for the wavelengths from 600 to 950 nm. The subset image was classified into three categories to predict the potential slide areas. The classification threshold was selected using the pattern of natural break of pixel values (DN). The classified REP imagery is shown in . The thresholds values used for this categorization are:
| 1. | Category 1: ≤719, | ||||
| 2. | Category 2: >719–≥721, and | ||||
| 3. | Category 3: >721. | ||||
Figure 7. Classification of Red Edge Position (REP) index imagery (for Zone 2) from September 2001 CASI II imagery.
7 Comparison of predictor categories
The distribution of the pixels in each of the different categories of the predictors suggests that each predictor has a category that may have the potential to predict the occurrence of slides. Therefore, we realized the need for the quantitative comparison of the prediction capability of each predictor. We introduced two parameters to do the quantitative comparison. These parameters are:
| 1. | probability of failure or Failure Index (FI) and | ||||
| 2. | Percentage of Search Area Reduction (PSAR). | ||||
7.1 Failure Index
The Failure Index (FI) quantifies the success rate of the predictor to determine the probability of the surficial levee failure. We determined FI by calculating the ratio of the number of pixels occupied by each category (C) to the number of pixels affected by slide in each category (FC ), and it can be expressed as:
7.2 Percentage of Search Area Reduction
The Percentage of Search Area Reducation (PSAR) quantifies the efficiency of the predictor to narrow down the search effort for identifying the areas having potential for failure along the levee system. We calculated PSAR as follows:
where C is the number of pixels occupied by each category and T is the total number of pixels covered by the study site.
8 Prediction model and results
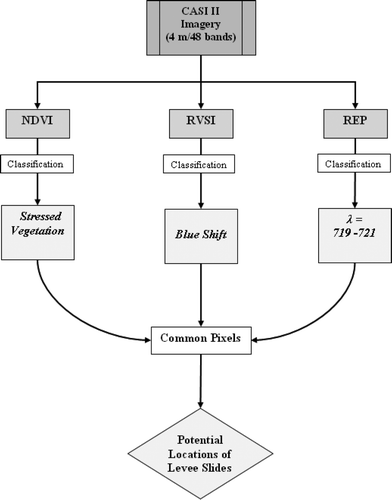
After determining the level of statistical significance of the predictors and the most significant categories of each predictor, a model was developed to predict the occurrence of slides using the combinations of most significant categories of all three predictors (). The categorized NDVI, RVSI and REP imagery were used as the input to this model. The Erdas Imagine graphical spatial modeller was used to create this model.
Figure 8. Slide prediction model.
8.1 Logistic regression
The regression analysis was performed using the ‘Logit’ model and a 95.05 confidence interval using 11,411 data points for each predictor. The summary of the logistic regression parameters is shown in .
Table 2. Summary of the logistic regression parameters.
The chi-square values vary among the predictors. For the given degree of freedom (11,406), the chi-square values for NDVI, RVSI and REP were found to be 28.84, 23.66 and 0.479, respectively. Since the chi-square value of REP is much lower than NDVI and RVSI, we considered REP more statistically significant for predicting levee slides than NDVI and RVSI. This is also evident with the probability corresponding to chi-square (Pr. > Chi-square) values, which are higher for REP (0.489) and very low for both NDVI and RVSI (<0.0001).
8.2 Comparison of predictor categories
Since none of the predictors was found to be statistically insignificant for levee slide prediction, we used all three predictors to develop the slide prediction model.
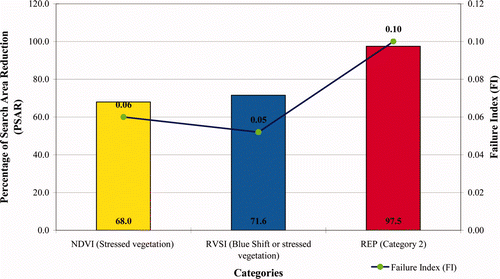
The values of FI and PSAR for NDVI, RVSI and REP are shown in , and , respectively. The values of FI and PSAR are plotted against each category to determine the best category for each predictor. The plots are shown in . From analysis of the tabular and graphical comparisons of FI and PSAR for each category of the predictors the following observations were made.
Table 3. Quantitative comparison of categories for NDVI.
Table 4. Quantitative comparison of categories for RVSI.
Table 5. Quantitative comparison of categories for REP.
Figure 9. Comparison of categories for (A) NDVI, (B) RVSI and (C) REP.
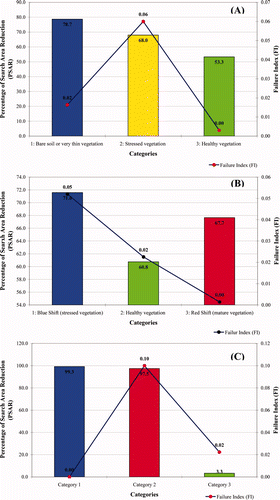
| • | Among all three categories of NDVI, category 2 (stressed vegetation) was found to correspond most frequently with the occurrence of slides with FI and PSAR values of 0.06 and 68.0. | ||||
| • | Among all three categories of RVSI, category 1 (blue-shift or stressed vegetation) was found as the most useful for predicting the occurrence of slides with FI and PSAR values are 0.05 and 71.6. | ||||
| • | Among all three categories of REP, category 2 was observed to be the most useful for predicting the occurrence of slides with FI and PSAR values of 0.10 and 97.5. | ||||
Table 6. Quantitative comparison of predictor categories and prediction model.
Figure 10. Comparison of categories of each predictor.
8.3 Prediction model
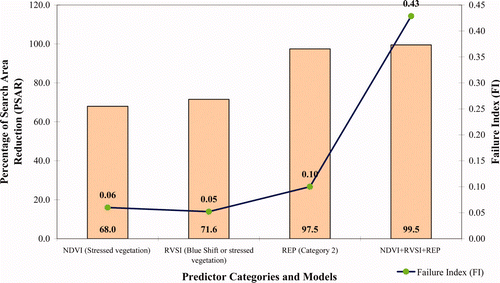
A slide prediction model was developed using category 2 (stressed vegetation) of NDVI, category 1 (blue-shift or stressed vegetation) of RVSI and category 2 of REP to determine the location of pixels where all three categories occur. These common pixels are the most likely locations for the occurrence of slides according to this model. The flowchart of the model is shown in and the slide prediction map obtained from the model is shown in . FI and PSAR values calculated for the slide predicting pixels for this model are shown in .
Table 7. FI and PSAR for prediction model
Figure 11. Slide potential map as produced by slide prediction model.
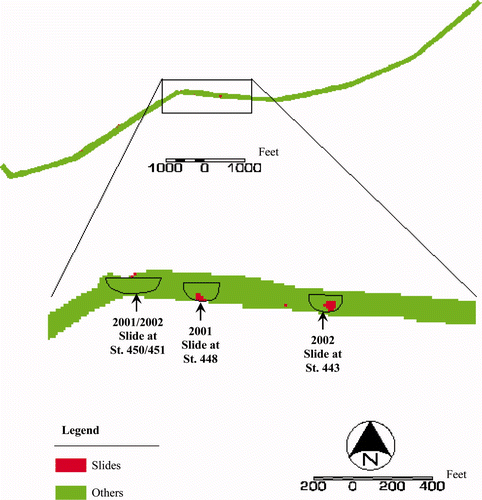
Figure 12. Plot of FI and PSAR for useful predictor categories and predictor models.
8.4 Comparison of predictor categories and prediction model
To determine the most useful methods of slide prediction, the FI and the PSAR of independent predictors and prediction model were compared and plotted. The comparisons are shown in and in .
The comparison table and plot show that category 2 of REP is the best independent predictor to predict the occurrence of slide. The FI and PSAR values of this predictor are 0.10 and 97.5. Slide predictors of NDVI or RVSI were not as useful because of their low FI and PSAR values. However, the results of the prediction model show that the combination of independent predictors increased the value of both FI and PSAR. The highest value of PSAR found was 99.5 in the case of the prediction model.
Other remote sensing land slide studies, including Su and Stohr (2000), used multiresolution aerial photographs and side-looking airborne radar (SLAR) to detect landslides along portion of the Mississippi River bluffs. They identified three levels of confidence on the basis of distinguishing characteristics and ambiguous indicators detected by visual inspection of the colour oblique photography. The use of confidence measures is appropriate for detecting landslides and slope failures, but is less applicable to a prediction model as developed in this research.
9 Discussions and conclusions
Hyperspectral remote sensing data has been successfully used for applications such as agriculture, forestry and water quality. The acquisition of hyperspectral data with high spatial resolution has also been possible for many years by means of airborne sensors. New satellites are being developed to provide remote sensing information based on high-resolution hyperspectral data. Airborne sensors have some advantages, however, including flexibility of scheduling, the possibility of accurate laboratory re-calibrations, a higher spatial resolution and higher spectral resolution. CASI was the first commercial hyperspectral imager and one of the most widely used airborne hyperspectral sensors.
Hossain et al. (2006) showed that 48-band and 4-m resolution CASI II imagery can be used to detect certain types of plants that grow in slide-affected areas (after the occurrence of slides) using the Spectral Angle Mapper (SAM) classification algorithm with both field- and image-derived spectra.
This study is a demonstration of the proof of concept of the application of the high-resolution airborne hyperspectral imagery, particularly CASI data, in locating the potential weak zones in selected parts of the Mississippi River Levee System. This study indicates that high-resolution hyperspectral imagery can be used to develop a model for levee slide prediction. Vegetation indices such as NDVI, RVSI and REP from CASI II imagery were found to be spatially and statistically significant as inputs to a slide prediction model. The model prediction results have shown good agreement with several field detected/verified slide occurrences. The slide-affected areas were mapped by GPS in the field and compared with the model predicted results.
The Red Edge Position (REP) index was found to be the best single predictor to predict the occurrence of slide, based on values of FI (0.10) and PSAR (97.5). Slide predictors based on NDVI and RVSI were not as useful because of their low FI and PSAR values. However, the results of the prediction model show that the combination of independent predictors increased the value of both FI and PSAR. The combination of NDVI and RVSI model has FI and PSAR values 0.08 and 83.9, respectively. These values further increased to 0.43 and 99.5 by combining the REP predictor with the combined model of NDVI and RVSI. This indicates that a slide prediction model that uses NDVI, RVSI and REP index images would be able to identify areas that have potential for surficial failures along the levee systems in our study site. This research can be further extended by applying the developed model on other sections in the Mississippi River Levee system without the prior knowledge of levee slides inventory.
Atmospheric correction is essential to obtain reliable results when using airborne hyperspectral imagery. It is especially critical for the use of data obtained from multiple flightlines. The best results in atmospheric correction are obtained through a radiative transfer approximation. However, radiative transfer approaches need an accurate prior estimation of different atmospheric constituents such as water vapour, aerosols and ozone concentration for most reliable results. The hyperspectral data used in this study was obtained as pre-processed and atmospherically corrected DN imagery. To eliminate the concern of uncertainty and reduce the error a single date and single flightline data was used in this study. For future studies involving imagery acquired by multiple flightlines and it is strongly recommended that atmospheric correction of the data, using a radiative transfer model be performed, incorporating accurate estimation of the necessary atmospheric constituents. It is also suggested that the use of reflectance values converted from DN imagery be used if the study involves multiple dates. Since the major focus of this study is to differentiate the stressed vegetation from the adjacent healthy vegetation, it is recommended that imagery acquired in the leaf-on season be used.
Acknowledgements
Thanks are due to the University of Mississippi Geoinformatics Centre (UMGC) for funding the project, and the Remote Sensing Technology Centre (RSTC) of Mississippi State University (MSU) for providing hyperspectral imagery and Mississippi Levee Board for providing levee slide inventory.
References
- Agresti , A. 1996 . An Introduction to Categorical Data Analysis , New York , NY : John Wiley and Sons, Inc .
- Asmat , A. , Milton , E. J. and Atkinson , P. M. Atmospheric correction of multiple flightline hyperspectral data (CASI-2) . Proceedings of the Remote Sensing and Photogrammetry Society Conference . 15–17 September . pp. 1 – 4 . University of Exeter .
- Belanger , M.J. , Miller , J. R. and Boyer , M. J. 1995 . Comparative relationships between some red edge parameters and seasonal leaf chlorophyll concentrations . Canadian Journal of Remote Sensing , 21 : 16 – 21 .
- Birkeland , P. W. 1984 . Soils and Geomorphology , New York , NY : Oxford University Press .
- Boone , R. B. , Galvin , K. A. and Lynn , S. J. 2000 . Generalizing El Nino effects upon Maasai livestock using hierarchical clusters of vegetation patterns . Photogrammetric Engineering & Remote Sensing , 66 : 737 – 744 .
- Danson , F. M. and Plummer , S. E. 1995 . Red edge response to forest leaf area index . International Journal of Remote Sensing , 16 : 183 – 188 .
- Eyers , R. D. and Mills , J. P. 2005 . Subsidence detection using integrated multi temporal airborne imagery . The International Archives of the Photogrammetry, Remote Sensing and Spatial Information Sciences , 34 : Part XXX
- Filella , I. and Peñuelas , J. 1994 . The red edge position and shape as indicators of plant chlorophyll content, biomass and hydric status . International Journal of Remote Sensing , 15 : 1459 – 1470 .
- Fisher , R. A. and Yates , F. 1963 . Statistical Tables for Biological, Agricultural, and Medical Research , (6th ed) , Edinburgh : Oliver and Boyd .
- Hillel , D. 1998 . Environmental Soil Physics , New York , NY : Elsevier (USA), Academic Press .
- Hosmer , D. W. and Lemeshow , S. 1989 . Applied Logistic Regression , New York , NY : John Wiley & Sons Inc .
- Hossain , A. , Easson , G. and Hasan , K. 2006 . Detection of levee slides using commercially available remotely sensed data . Environmental and Engineering Geoscience , 13 : 235 – 246 .
- Jensen , J. R. 1996 . Introductory Digital Image Processing: A Remote Sensing Perspective , (2nd ed.) , Englewood Cliffs , NJ : Prentice-Hall .
- Kodikara , J. , Barbour , S. L. and Fredlund , D. G. Changes in clay structure and behaviour due to wetting and drying . Proceedings of 8th Australian – New Zealand Conference on Geomechanics . Hobart, Tasmania . pp. 179 – 186 .
- Kriegler , F. J. , Malila , W. A. , Nalepka , R. F. and Richardson , W. Preprocessing, transformations and their effects on multispectral recognition . Proceedings of the Sixth International Symposium on Remote Sensing of Environment . pp. 97 – 131 . Ann Arbor , MI : University of Michigan .
- Kuszmaul , J. , Neuner , J. , Hossain , A. and Easson , G. 2004 . The use of multispectral imagery to detect variations in soil moisture associated shallow soil slumps . EOS Trans. AGU , 85 ( 17 ) Jt. Assem. Suppl., Abstract
- Lauden , R. , Bareth , G. and Doluschitl , R. 2003 . Analysis of hyperspectral field data for detection of sugar beet diseases . EFITA 2003 Conference , 5–9 July, Debrecen, Hungary
- Levine , D. M. , Ramsey , P. P. and Smidt , R. K. 2001 . Applied Statistics for Engineers and Scientists , Upper Saddle River , NJ : Prentice Hall .
- Merton , R. Monitoring community hysteresis using spectral shift analysis and the red edge vegetation stress index . Proceedings of the Seventh Annual JPL Airborne Earth Science Workshop . 12–16 January . California , USA NASA, Jet Propulsion Laboratory, Pasadena
- Merton , R. and Huntington , J. Early simulation results of the ARIES-1 satellite sensor for multi-temporal vegetation research derived from AVIRIS . Proceedings of the Eighth Annual JPL Airborne Earth Science Workshop . pp. 8 – 14 . California NASA, Jet Propulsion Laboratory, Pasadena
- Miller , J. R. , Wu , J. , Boyer , M. G. , Belanger , M. and Hare , E. W. 1991 . Season pattern in leaf reflectance red edge characteristics . International Journal of Remote Sensing , 12 : 1509 – 1523 .
- Neuner , J. A. 2002 . “ Detection of surficial failures in high plasticity, compacted clay slopes using remote sensing along the Mississippi River levee ” . Unpublished MSc thesis, The University of Mississippi
- Niemann , K. O. 1995 . Remote sensing of forest and age using airborne spectrometer data . Photogrammetric Engineering & Remote Sensing , 61 : 1119 – 1127 .
- Rock , B. N. , Hoshizaki , T. and Miller , J. R. 1988 . Comparison of in situ and airborne spectral measurements of the blue shift associated with forest decline . Remote Sensing of Environment , 24 : 109 – 127 .
- Rouse , J. W. , Haas , R. H. , Schell, J.A. , J. A. and Deering , D. W. Monitoring vegetation systems in the Great Plains with ERTS . Third ERTS Symposium . pp. 309 – 317 . NASA SP-351 I
- Ruiliang , P. , Gong , P. , Biging , G. S. and Larrieu , M. R. 2003 . Extraction of red edge optical parameters from Hyperion data for estimation of forest leaf area index . IEEE Transaction on Remote Sensing , 41 : 916 – 921 .
- Sills , G. 1983 . “ Long-term strength reduction and slough slides in Mississippi River levee ” . Vicksburg, United States Corps of Engineers – Vicksburg District
- Skempton , A. W. 1970 . First-term slides in over-consolidated clays . Geotechnique , 20 : 370 – 324 .
- Su , W. and Stohr , C. 2000 . Aerial-photointerpretation of landslides along the Ohio and Mississippi Rivers . Environmental and Engineering Geoscience , 6 : 311 – 323 .
- Vane , G. and Goetz , A. F.H. 1988 . Terrestrial imaging spectroscopy . Remote Sensing of the Environment , 24 : 1 – 29 .