Abstract
Total electron content (TEC) data, obtained from satellites, are used in the search for imprints for identifying the probability factor of an impending earthquake. Extraction of earthquake induced signature is done mainly from day-to-day variations in TEC peak (TECpeak.). The use of a single parameter such as TECpeak is not always enough to formulate such a pointer. The paper therefore focuses on the need to introduce other markers such as the shape of TEC profile and to utilize any modification in the profile shape caused by an impending earthquake to identify precursors. An automatic pattern matching approach for processing global positioning system (GPS) generated TEC records is introduced to achieve this aim and TEC profiles are passed through a template framed from the time series of quiet day data. The Dynamic Time Warping (DTW) algorithm is adopted to look for deviations in the entire TEC profile of days prior to the earthquake with respect to the template. Variation, if any, would be used as an index of earthquake induced signature. A few case studies using this algorithm are presented in the paper. Work is based on TEC data collected from the GPS receiver at Guwahati (26° 10′ N, 91° 45′ E), an equatorial anomaly crest station.
1. Introduction
Total electron content (TEC) data, obtained from satellites, have now been adopted as one of the tools for identifying earthquake induced characteristics (Zaslavski et al. 1998, Devi et al. Citation2001, Citation2004, Liu et al. Citation2001, Citation2002). However, the complexities of earthquake induced effects on the ionosphere make such analysis difficult. The situation is further involved at the Appleton anomaly crest region. One of the reasons for such complexities is due to modulation of ionization density about the anomaly crest by the equatorial electric field (Rajaram Citation1977 and the references therein), controlled by current systems. It is well known that the concentration of charged particles in the ionosphere governs the electrical conductivity because collisions restrict their movement under an impressed electric field. Presence of a magnetic field modifies the motion of such particles across it, thereby making the conductivity anisotropic. Thus, in the ionosphere, there are three conductivities namely, Longitudinal, Pedersen and Hall conductivities.
Longitudinal conductivity determines the current parallel to the magnetic lines of force, Pederson conductivity is relevant to the current parallel to that component of the electric field, while Hall conductivity determines the Hall current flowing in a direction perpendicular to both the electric and magnetic fields. Hall current, acted on by the magnetic field of the earth, generates forces that move the plasma upwards constituting the atmospheric motor, responsible for development of the equatorial anomaly. This process, known as E × B drift, causes transport of ionization from the equator (where the magnetic field has a strong N–S component) to regions off the equator. The effect is called an anomaly because when the electron density should have been maximum at the equator, it makes a minimum over the magnetic equator, while causing maxima at latitudes 10° or 20° north and south of the equator, respectively. Further, the width of the anomaly undergoes changes with the solar geomagnetic environment (Huang et al. Citation1987, Fukushima Citation1989, Walker and Chen Citation1989, Min-Yun and Chang-Shou Citation1991, Devi et al. Citation2002, Citation2008, Anderson et al. Citation2006). Modifications seen in TEC records at this zone thus carry a host of imprints of complex factors contributed by seismic processes, solar geomagnetic variations, as well as impacts from the equatorial current system, to name a few. Therefore, any attempt at identification of a predictive feature in ionization density or electron content at the Appleton anomaly zone is a difficult exercise. Although difficult, such an endeavour offers opportunities for understanding the earthquake time dynamical processes that make interactions at the ionosphere with terrestrial seismogenic electrical systems (Molchanov et al. Citation2002, Depueva et al. Citation2007) in a complex manner.
Most of the low latitude earthquake precursor related reports are based on changes in TEC peak value (Devi et al. Citation2001, Singh et al. Citation2009), but the results sometimes fail to mark a cursor (Devi et al. Citation2010b). In this paper therefore, an approach is presented where modifications forced into the entire TEC profile by earthquake preparatory processes are brought to focus, in addition to a single parameter as the TEC peak. For this purpose, TEC data collected from a geostationary satellite as well as from the global positioning system (GPS) at Guwahati (26° 10′ N, 91° 45′ E), a seismically active zone in the sub Himalayan region, are utilized. The methods used for extraction of earthquake cursors from TEC data are discussed.
2. Data and analysis
TEC data used in the present work are mainly from the GPS receiver of Guwahati, though observations from a geostationary satellite obtained at the same location are referred. Faraday Rotations, measured through two different L-band frequencies, are used to determine TEC from orbiting satellites. From the slant TEC data, matrix inversion and smoothing techniques are used for vertical TEC measurement. At Gauhati University (GU) laboratory, a GPS receiving set up is used for collection of TEC data. The system consists of a GPS antenna with a low noise oven controlled crystal oscillator. The GPS receiver can track up to 11 GPS signals at L1 frequency (1575.42 MHz) and L2 frequency (1227.6 MHz). Further details of measurements of TEC from geostationary satellite, as well as from GPS, are available elsewhere (Tyagi et al. Citation1977, Bardoloi et al. Citation1982, Rahman et al. Citation1988, Devi et al. Citation2008).
Earthquake induced features on TEC are often examined by taking the TEC peak value (TECpeak), as an index. TECpeak is the noon or around noon maximum of daily ionization profiles. The TECpeak alone is not exclusive as it cannot offer electron content magnitudes especially at post sunset hours in situations when abnormally high TEC is detected. Such enhancements in election density, leading to changes in shape of the TEC profile, are often observed on pre-earthquake days (Depueva and Ruzhin Citation1993, Devi et al. Citation2004). Therefore, the TECpeak may not be a sufficient predictive index for an earthquake thus necessitating using the TEC profile shape in a technique that brings the entire TEC profile period to the ambit of earthquake prediction analysis. This technique uses a dynamic programming design known as Dynamic Time Warping (DTW) to identify mismatch between two time series and to determine the deviation between the two. Here, one of the time series is framed from quiet day TEC profiles while the second series is for any other day. The two series are compared by calculating the magnitude of ‘like-to-like’ matches. Based on this matching, a parameter called the ‘certainty factor’ is defined to identify earthquake cursors. However, before applying the DTW technique, it is essential to examine TEC variations due to seismic and other non seismic factors, as discussed in the next paragraphs.
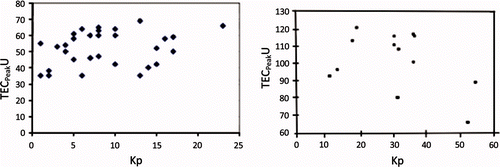
It is well known that ionospheric characteristics are subject to variations with solar geomagnetic conditions. It is thus essential to evaluate the effects of these variabilities from relevant TEC profiles before earthquake tracers are extracted. As a first filtration of unwanted magnetic influence on TEC, the variation of its peak with the geomagnetic parameter Kp, is analysed and representative plots for low solar (2009) activity and high solar (1981) activity periods are shown in and (b), respectively. It is apparent from that no significant relation in the peak value of ionization with Kp is present at low solar activity periods when the solar sunspot number Rz may be as low as 4, but there may be day-to-day fluctuations on TECpeak even on these days. The relation between TECpeak and Kp for high solar situations is far more complex because the ionization magnitude may decrease with an increase in geomagnetic influences as seen from . So, identification of earthquake signatures from TEC will be a complex process. It is seen that in many cases TECpeak itself may work as a reasonably good cursor (Devi et al. Citation2001, Citation2004, Citation2010a), although there are events when its use leads to certain ambiguity. It is therefore preferable to have more than one approach to such an exercise, as will be discussed in subsequent sections.
Figure 1. Relationship between TECpeak and Kp during (a) a low solar activity period (2009, Rz = 2.0) and (b) a high solar activity period (1981, Rz = 143.0).1 TECU = 1016 el m−2.
We will start our analysis with TECpeak variations prior to low latitude earthquakes to assess the confidence of utilization of this parameter as a precursor. An example of day-to-day fluctuations of TECpeak for February 2006 is shown in . This month is selected because of the occurrence of a number of low latitude earthquake events so that variation of the peak ionization density at the time of impending earthquakes can be traced with the aim of identifying a possible earthquake factor as well as to assess the concordance of results. For extracting this factor, we start with TEC profiles with quiet days (Q-days) i.e. the days when the solar geomagnetic situation is considered to be calm. Solar geomagnetic condition of a day is internationally monitored and worked out in 3-hourly figures of Kp indices (as mentioned above). If the total is less than 20, the day is marked as a Q-day. However, even on Q-days there may be statistical (random) variations in TEC. Therefore, to obtain the maximum and minimum limits of TEC fluctuations on Q-days, the standard deviation (STD) of TEC at each hour of at least five Q-days of a month is calculated. Attention is then given to the cases where TEC figures go above the excursion bars. The maximum and minimum fluctuation limits, shown by thick lines in , are for Q-day TECpeak condition only. The earthquake days are also marked. One can note that, a few days prior to the occurrence of an earthquake, TECpeak develops an increasing trend that crosses the maximum boundary of Q-day TEC excursions. thus offers the following inferences:
Figure 2. Day-to-day variation in TECpeak for February 2006. Here days of possible earthquakes identified by us are shown by red rectangles ![]()
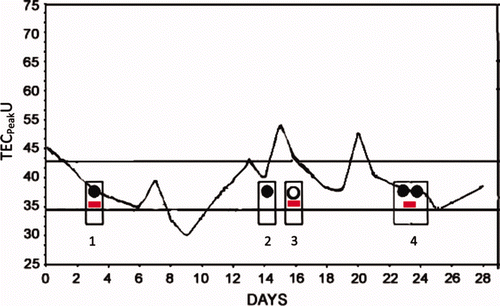
| i. | There are normal fluctuations of TECpeak within a Q-day STD but on some days the magnitude increases so much that it exceeds the maximum excursion bar of the STD limit of Q-day TEC (thick lines). | ||||
| ii. | On attainment of the maximum, the TECpeak decreases. | ||||
| iii. | On days near or at the trough of this decline, occurrence of a low latitude earthquake is noted. | ||||
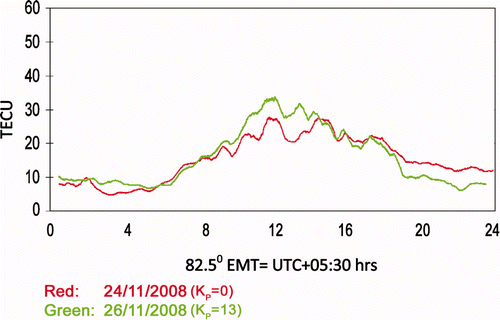
The TEC profile shape is now brought into consideration for its possible use as another marker for precursor, because it is expected that the alteration in shape is forced on it by pre-earthquake processes (Depueva and Rotanova Citation2001, Deviet al. Citation2004, Citation2010b). The profile shape is also subjected to changes by other factors, of these the solar geomagnetic ambience is most important (Devi et al. Citation2002). In , the typical Q-day and disturbed day (D-day) TEC profiles are presented for a high solar activity period (1980–1981) when Rz becomes as high as 180. Changes in shape of the profile are clearly detectable as Kp increases (Kp = 28). However, such a modification in shape is practically not visible during low solar situations (Rz may go to 0), as can be seen in , presenting TEC profiles for the year 2008. The maximum Kp in such low solar situations may rarely exceed 15, thus the TEC for Kp = 13 in November 2008 can be considered as a representative for a worst magnetic condition prevailing at this (lowest) solar cycle. With this background, the effect of an impending earthquake on the shape of TEC profiles is examined.
Figure 3. TEC profile shape for high solar activity period for a quiet day on 14 June 1980 and for a disturbed day on 2 February 1981. 1 TECU = 1016 el m−2.
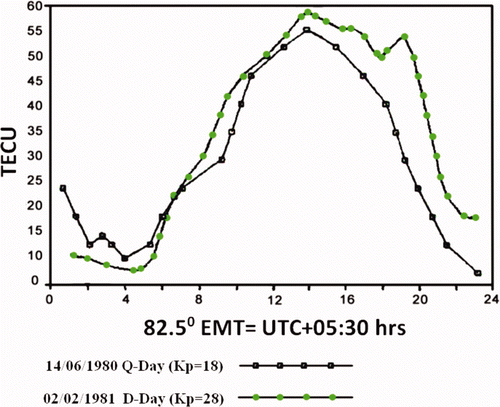
Figure 4. TEC profile shape at a low solar activity period for 24 November 2008 (red curve) with Kp = 0 and for 26 November 2008 (green curve) with Kp = 13. 1 TECU = 1016 el m−2.
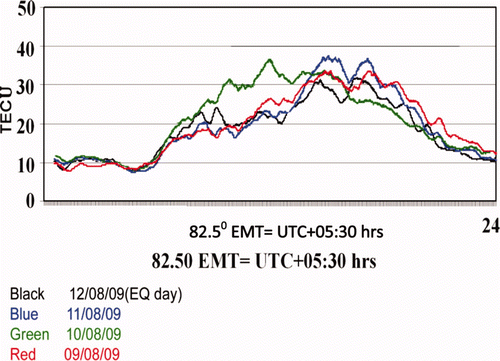
It is noted in earlier reports of this group (Devi et al. Citation2002, Citation2004), that earthquake time changes in TEC, at this low latitude station, occur not only during noon periods but also at post noon and after sunset hours, suggesting that it is important to look for seismic features in TEC for the entire day. Such modification of the profile shape could also be seen from the following example where a number of diurnal TEC variation records consisting of pre-earthquake to earthquake days are superimposed. This is an attempt to look for seismic linked changes on shape of profiles for 12 August 2009 earthquake (see ). Here significant modification in diurnal features could be noted 2 days before this earthquake (with the epicentre at 24.34° N and 94.79° E and M = 5.5). This fact, along with earlier observations of this group, provides an input for adapting the profile shape as a tool for identifying a possible earthquake day. Thus, the Dynamic Time Warping (DTW) method is considered next, for determination of earthquake time deviation in the entire TEC profile relative to that of a Q-day; the analysis technique is presented below.
Figure 5. Superimposition of a number of TEC profiles covering pre-earthquake to earthquake days for examining modifications in TEC profile shape by the earthquake preparatory process. Earthquake event shown in the figure is for 12 August 2009. 1 TECU = 1016 el m−2.
In this approach a template is framed by selecting TEC profile of Q-days to filter out the geomagnetically induced disturbed factors. This group of profiles will then be used as a reference time series and be defined as a ‘template’ for extracting a significant deviation that may appear on other day TEC profiles. Magnitude of ‘like-to-like’ match between the two time series is marked by a parameter we call ‘certainty factor’. The magnitude of ‘certainty factor’ (as a percentage), will be maximum if any profile matches with the template. This technique therefore addresses TECpeak as well as any changes in shape between the two time series.
The DTW uses a dynamic programming approach (Sakoe and Chiba Citation1978, Myers et al. Citation1980, Efrat et al. Citation2007) to align a time series with a specified template so that distance between the two reaches a minimum. Since the time series is compressed to achieve a reasonable fit, any point i in the time series may be aligned with some jth point in the template (i may or may not be equal to j), to compute distance between the two. Specifically, the pattern detection task involves searching a match between a template T and any other series S where
The sequences S and T can be arranged to form an n-by-m grid where each grid point (i, j) corresponds to an alignment between elements s i and t j. A warping path W aligns the elements of S and T such that the distance between them is minimized. W can be written as
Here, each w k corresponds to a point (i, j)k, where k is length of the warping path p. When there is no difference between the two time series, the warping path coincides with a diagonal line i = j, giving the minimum distance between two elements. There are a number of techniques available for measuring the distance δ between two elements. This parameter can be expressed either in ‘magnitude of the difference’ or ‘square of the difference’ as given by the following equations:
To find the best match or alignment between these two sequences, one needs to find a path through the grid which minimizes the total distance between them. The procedure for computing this path involves finding all possible routes through the grid, then calculate the overall distance. Now, DTW problem can be formally defined as a minimization over potential warping paths based on the cumulative distance for each path given by equation (5)
Searching through all possible warping paths to obtain the minimum distance is very tedious. To reduce the search space, several types of restriction can be used, some of these are:
| i. | Monotonicity: the path will not turn back on itself, i.e. for consecutive pairs w k−1 and w k in W , i k−1 ≤ ik and j k−1 ≤ jk . | ||||
| ii. | Continuity: the path advances one step at a time i.e. i k −i k−1 ≤ 1 and jk−jk−1 ≤ 1. | ||||
| iii. | Boundary condition: the path starts at the bottom left and ends at the top right. | ||||
| iv. | Warping window condition: a good path is unlikely to wander very far from the diagonal. Distance that the path is allowed to wander is the window width. | ||||
| v. | Slope constraint condition: the path should not be too steep or too shallow thereby avoiding excessively large movements in a single direction. | ||||
Other similar recurrence functions can also be used, but equation (6) is symmetric. Moreover, it has been seen that symmetric formulation gives better results for the speech reorganization field. Equation (6) is thus utilized in the application of TEC profile matching for identifying an earthquake precursor. The ‘certainty parameter’ (D) is then defined by the length normalized distance function given by equation (7)
Where, A and B are curves of the template and the other time series, respectively. The dynamic programming algorithm fills in a table of cumulative distances as the computation proceeds. Upon completion, the optimal warping path ( W ) can be found by tracing backwards in the table.
3. Results and discussions
The DTW technique will now be put to test for its application as a cursor marker in a few earthquake cases listed in . The events are selected so that observing station Guwahati lies within or about the preparatory zone. Epicentre positions and earthquake magnitudes are presented in the table along with the group of days selected for construction of the template. Corresponding Kp values of the days are also given in .
Table 1. Earthquake epicentres and magnitudes of the cases analysed with the Dynamic Time Warping (DTW) technique. The days for which total electron content (TEC) profiles are used for construction of a template are shown. Kp values for the respective day are also presented.
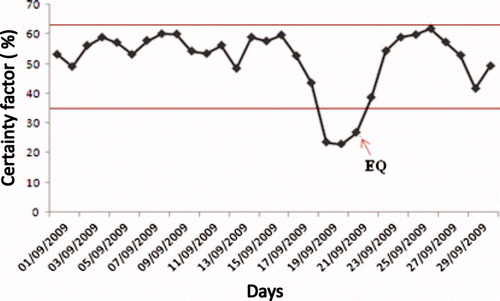
The 2009 Bhutan earthquake with magnitude M = 6.1 that occurred at 08:53 h UT, on 21 September 2009, is taken as one of the case studies for this purpose. The epicentre was at 27.32° N, 91.42° E, 180 km (radius 445.85 km) east of the capital Thimphu. The receiving station at Guwahati thus lies within the earthquake preparatory zone. Another earthquake on the same day occurred at the India–Myanmar border with epicentre 20.39° N, 94.77° E, M = 5.7. The DTW technique demands framing of the template from at least 5 Q-days (preferably near to earthquake event), therefore in , a Q-day TEC feature (a representative profile) along with one of the pre-earthquake days () is presented to highlight the differences in shape between the two. The modification in shape of TEC profile before the earthquake day (see ) is significant compared to that for the Q-day. It is expected that ‘certainty factor’ should be low before the earthquake. Thus, from a number of Q-day TEC profiles, a template for this particular month is created to measure the distance of deviation between template and the time series of other days of this month, finally to derive the ‘certainty factor’. The result is presented in . The standard deviation (STD) of the ‘certainty factor’ is calculated as discussed in §2, for obtaining its maximum possible fluctuations for this month. One can note that the earthquake time anomaly in this frame remains well below the STD limits (). Q-days selected for this purpose are shown in .
Figure 6. TEC profile for (a) a Q-day (representative case) and (b) a pre-earthquake day of 20 September 2009. An earthquake occurred on 21 September 2009. 1 TECU = 1016 el m−2.
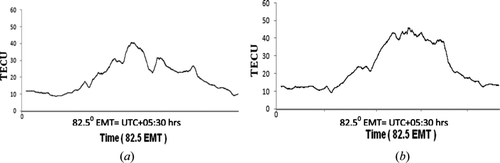
Figure 7. ‘Certainty factor’ for the month of September 2009. Note the drop in this factor during the earthquake event, which occurred on 21 September 2009.
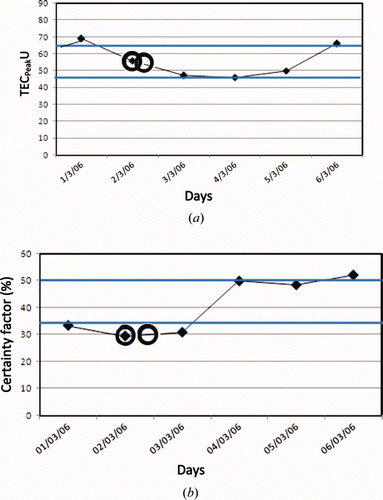
The above approach is now applied for identifying the earthquakes of 2 and 3 March 2006. The details of epicentre positions and earthquake magnitudes are listed in , along with the group of days used for construction of the TEC template. presents TECpeak variations around the earthquake days of March 2006 wherein one can note an increase in TECpeak value exceeding the STD limit one day before the earthquakes of 2 and 3 March. Thus, as discussed in the data and analysis section of the paper, one may identify 2 or 3 March as probable earthquake days but uncertainty persists because of a lone high value of TECpeak on 1 March 2006. Next, the result from the DTW technique for the same case is displayed in . The dip in ‘certainty factor’ noted prior to or during the earthquake is significant and unambiguous.
Figure 8. Identification of earthquake days by (a) TECpeak variations, (1 TECU = 1016 el m−2) and (b) DTW technique with ‘certainty factor’ for events of 2 March 2006 and 3 March 2006. The circles in the figures mark the earthquake days.
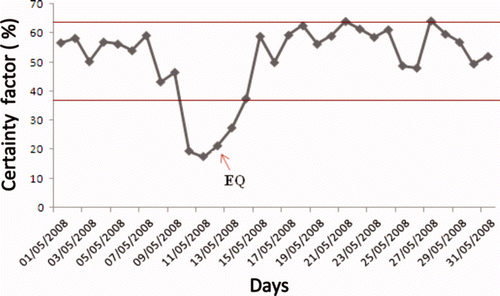
The DTW technique is then applied to the very strong 12 May 2008, 7.9 magnitude China earthquake that occurred in Sichuan, China (epicentre at 31° 24′ N, 103° 58′ E). This earthquake has an active radius R of 2980 km, therefore Guwahati lies well within the earthquake preparatory zone, offering a rare occasion to examine the reliability of the DTW technique for a case like this. The Q-day template (the group of days is presented in ) has been made and the ‘certainty factor’ between the template and the other days of this month is calculated and presented in . Here too, a clear drop of this factor prior to the earthquake is seen. Low values of the ‘certainty factor’, even after the earthquake events, are interesting because such a factor may be associated with aftershocks.
Figure 9. ‘Certainty factor’ calculated by the DTW method for May 2008. Note the dip in the ‘certainty factor’ prior to the 12 May 2008 earthquake, marked by an arrowhead. The post earthquake anomaly in the ‘certainty factor’ is likely to be associated with strong aftershocks.
Thus, the first results of utilizing the DTW technique for earthquake precursor identification in TEC data are encouraging, though there are scopes for improvement (like in finer temporal resolution), which will be included in our future studies.
This paper addresses the problems of unearthing anomalous features induced by pre-earthquake activities on TEC seen at Guwahati when this station comes within or around the ambit of the preparatory zone. The TECpeak no doubt carries pre-earthquake signatures, but for Guwahati, located at the equatorial Appleton anomaly crest region, TEC features are controlled by a number of factors, focused on in §1.
Past studies on the analysis of TEC features that appear prior to an impending earthquake have shown that precursors at low-latitudes manifest themselves as a kind of Appleton type E × B charge movement when the epicentre lies near to the equator (Depueva and Ruzhin Citation1995, Devi et al. Citation2001, Hayakawa Citation2004, Depueva et al. Citation2007), imparting a mark in the TEC value (Depueva and Rotanova Citation2001, Devi et al. Citation2004, Citation2010b). It is shown by Devi et al. (2010b) that low-latitude earthquakes also force similar changes on profiles of electron density, though the modifications may extend to beyond the day peak. Thus, modifications to electron content imposed by an equatorial earthquake may not be similar to that of a low latitude one, when shifts of the anomaly crest may lead to either an increase or decrease of TEC, depending in a complex way on magnitude of the earthquake, proximity of the epicentre to the observing station and the simultaneous presence of an equatorial earthquake (Devi et al. Citation2010b). In this context, we refer here to the work of Liu et al. (2010), who reported a significant decrease in TEC, five days prior to the very strong equatorial earthquake of M = 9. Xia et al. (2011), on the other hand, observed an enhancement in daytime TEC 2–3 days before the severe China earthquakes of 12 May 2008, a finding similar to that reported by Devi et al. (2010a). Thus, the above reports highlight the facts that earthquake induced modification in TEC around the low latitude zone is complex. This fact is also noted by Devi et al. (2010b) in the evaluation of pre-seismic TEC parameters, through a model like the International Reference Ionosphere (IRI). It was reported by them that even after they inserted the values of the ‘F-region peak ionization density’ appropriate to ‘earthquake time situations’ into the model, the computed outcome falls short to conform with the observed high TECpeak. Therefore, the TECpeak alone cannot make an exclusive factor on assessment of pre-earthquake changes in ionospheric density at least at low latitude stations. On this background, the DTW approach offers an alternative method because here all TEC values within the 24-hour profile are considered, instead of a single parameter such as the TECpeak, to improve the reliability of the earthquake cursor signature. In this connection, the work of Karatay et al. (2010), who made efforts to identify TEC variations associated with earthquakes from geomagnetic storm data, may be mentioned. A correlative study on simultaneous ground based and ionospheric observations will improve understanding of the complex earthquake–time lithosphere–ionospheric coupling processes (Parrot et al. Citation1989, Devi et al. Citation2007, Singh et al. Citation2010), necessary for realizing a reliable cursor.
4. Conclusion
The search for an earthquake cursor using TEC data shows that TECpeak alone cannot be an exclusive factor for assessment of pre-earthquake changes in ionospheric density, at least at low latitude stations, because of the complex dynamical situation of this region. We have thus considered a pattern recognition algorithm, the DTW approach, where variations in the entire 24-hour profile of TEC are taken, instead of a single parameter such as the TECpeak. It is seen that the ‘certainty factor’ in the DTW technique has provided a tool for marking a cursor of moderate to strong earthquakes, when the observing station lies around the earthquake preparatory zone. The results are an improvement on prediction capability, compared to that obtained by TECpeak. However, the limitation of DTW is such that it cannot resolve finer temporal and spatial information because of the enormous increase in size of the necessary matrix. The next attempt will be to make the algorithm capable of preparing large matrices and to adopt the same for identification of finer details of an earthquake event, through use of multiple features of TEC as discussed by Devi et al. (2010a).
References
- Anderson , D. , Anghel , A. , Chau , J. L. and Yumoto , K. 2006 . Global low-latitude, vertical E × B drift velocities inferred from daytime magnetometer observations . Space Weather , 4 S08003, DOI: 10.1029/2005SW000
- Bardoloi , P. , Rahman , K. , Devi , M. and Barbara , A. K. 1982 . An experimental arrangement for satellite RB signal amplitude measurements using Rotating Antenna . Indian Journal of Radio & Space Physics , 1 : 122 – 123 .
- Depueva , A. H. and Ruzhin , Yu. YA . 1993 . The equatorial earthquake preparatory stage as a reason of ‘fountain’-effect in the ionosphere . Preprint IZMIRAN (Institute of Terrestrial Magnetism, Ionosphere, and Radiowave Propagation, Russian Academy of Sciences) , 82 : 1029
- Depueva , A. H. and Ruzhin , Yu. YA . 1995 . Seismoionospheric fountain effect as analogue of active space experiment . Advances in Space Research , 15 : 151–154
- Depueva , A. and Rotanova , N. 2001 . Low-latitude ionospheric disturbances associated with earthquakes . Annali di Geofisica , 44 : 221 – 228 .
- Depueva , A. , Mikhailov , A. , Devi , M. and Barbara , A. K. 2007 . Spatial and time variations in critical frequencies of the ionospheric F region above the zone of equatorial earthquake preparation . Geomagnetism and Aeronomy , 47 : 129 – 133 .
- Devi , M. , Barman , M. K. , Barbara , A. K. and Depueva , A. H. 2001 . Total electron content near anomaly crest as precursor of earthquake . Indian Journal of Radio & Space Phyics , 30 : 209 – 213 .
- Devi , M. , Barman , M. K. and Barbara , A. K. 2002 . Identification of quiet and disturbed days through TEC profile features over Anomaly Crest Station . Journal of Atmospheric and Solar Terrestrial Physics , 64 : 1413 – 1423 .
- Devi , M. , Barbara , A. K. and Depueva , A. H. 2004 . Association of total electron content and foF2 variations with earthquake events at the anomaly crest region . Annals of Geophysics , 47 : 83 – 91 .
- Devi , M. , Barbara , A. K. , Ruzhin , Yu. Ya. and Depueva , A. H. 2007 . Beyond the horizon propagation of VHF signals, atmospheric features and earthquake . Investigated in Russia , 129 : 1331 – 1340 . http://zhurnal.ape.relarn.ru/articles/2007/129e.pdf (English version)
- Devi , M. , Barbara , A. K. , Depueva , A. and Depuev , V. 2008 . Preliminary results of TEC measurements in Guwahati, India . Advances in Space Research , 42 : 753 – 756 .
- Devi , M. , Barbara , A. K. , Depueva , A. H. , Ruzhin , Yu. Ya. and Depuev , V. 2010a . Anomalous Total Electron Content (TEC) and atmospheric refractivity prior to very strong China earthquake of May 2008 . International Journal of Remote Sensing , 31 : 3589 – 3599 .
- Devi , M. , Barbara , A. K. , Kashyap , P. , Depueva , A. , Ruzhin , Yu. Ya and Depuev , V. 2010b . Earthquake time low latitude Total electron Content (TEC) variations and model based pattern: identification of earthquake induced atmospheric dynamics . Advances of Geosciences , 28 : 69 – 84 .
- Efrat , A. , Fan , Q. and Venkatasubramanian , S. 2007 . Curve matching, time warping, and light fields: new algorithms for computing similarity between curves . Journal of Mathematical Imaging , 27 : 203 – 216 .
- Fukushima , N. 1989 . Contribution to geomagnetic Sq field and equatorial electrojet from the Day/Night asymmetry of ionospheric current under dawn-dusk electric fields of magnetospheric origin . Pure and Applied Geophysics , 131 : 437 – 446 .
- Hayakawa , M. 2004 . Electromagnetic phenomena associated with earthquakes: a frontier in terrestrial electromagnetic noise environment . Recent Research Development in Geophysics , 6 : 81 – 112 .
- Huang , Y. N. , Cheng , K. and Chen , W. 1987 . Daily observations of development of ionospheric equatorial anomaly by means of differential Doppler shift method . Radio Science , 22 : 433–438
- Karatay , S. , Arikan , F. and Arikan , O. 2010 . Investigation of total electron content variability due to seismic and geomagnetic disturbances in the ionosphere . Radio Science , 45 : 1 – 12 .
- Liu , J. Y. , Chen , Y. I. , chou , Y. J. and Tsai , H. F. 2001 . Variations of ionospheric total electron content during the Chi-Chi earthquake . Geophysical Research Letters , 28 : 1383 – 1386 .
- Liu , J. Y. , Chino , Y. J. , Pulinets , S. A. , Tsai , H. F. and Zeng , Xiaoping . 2002 . “ A study on the TEC perturbation prior to the Rei-Li Chi-Chi and Chi-Yi earthquake ” . In Seismo Electromagnetics: Lithosphere–atmosphere –ionosphere coupling , Edited by: Hayakawa , M. and Molchanov , O. A. 293 – 301 . Tokyo : Terapub .
- Liu , J. Y. , Chen , Y. I. , Chen , C. H. and Hattori , K. 2010 . Temporal and spatial precursors in the ionospheric global positioning system (GPS) total electron content observed before the 26 December 2004 M9.3 Sumatra–Andaman Earthquake . Journal of Geophysical Research , 115 A09312, DOI: 10.1029/2010JA015313
- Min-Yun , Zi and Chang-Shou , Shen . 1991 . The equatorial electrojet and the magnetosphere–ionosphere coupling – I. Analysis of low-latitude geomagnetic data . Planetary and Space Science , 39 : 907 – 917 .
- Molchanov , O. A. , Hayakawa , M. , Afonin , V. V. , Akentieva , O. A. and Mareev , E. A. 2002 . “ Possible influence of seismicity by gravity waves on ionospheric equatorial anomaly from data of IK-24 satellite 1. Search for idea of seismo–ionospheric coupling ” . In Seismo Electromagnetics: Lithosphere–atmosphere–ionosphere coupling , Edited by: Hayakawa , M. and Molchanov , O. A. 275 – 285 . Tokyo : Terapub .
- Myers , C. , Rabiner , L. and Rosenberg , A. 1980 . Performance tradeoffs in dynamic time warping algorithms for isolated word recognition . Acoustics, Speech, and Signal Processing , 28 : 623 – 635 .
- Myers , C. , Rabiner , L. and Rosenberg , A. 1980 . Performance tradeoffs in dynamic time warping algorithms for isolated word recognition . Acoustics, Speech, and Signal Processing , 28 : 623 – 635 .
- Parrot , M. and Mogilevskii , M. M. 1989 . VLF emissions associated with earthquakes and observed in the ionosphere and magnetosphere . Physics of the Earth and Planetary Interiors , 57 : 86 – 99 .
- Rahman , K. , Devi , M. , Barbara , A. K. and Bardoloi , P. 1988 . “ A simple approach for derivation of various formula for RB study ” . In Investigation of the Ionosphere by Means of Beacon Satellite Measurements , Edited by: Chong , Cao . 217 – 274 . Beijing, China: International Academic Publishers .
- Rajaram , G. 1977 . Structure of the equatorial F-region, topside and bottom side a review . Journal of Atmospheric and Terrestrial Physics , 39 : 1125 – 1144 .
- Sakoe , H. and Chiba , S. 1978 . Dynamic programming algorithm optimization for spoken word recognition . Acoustics, Speech and Signal Processing , 26 : 43 – 49 .
- Singh , O. P. , Chauhan , V. , Singh , V. and Singh , B. 2009 . Anomalous variation in total electron content (TEC) associated with earthquakes in India during September 2006–November 2007 . Physics and Chemistry of the Earth , 34 : 479 – 484 .
- Singh , R. P. , Mehdi , W. , Gautam , R. , Kumar , J. S. , Zlotnicki , J. and Kafatos , M. 2010 . Precursory signals using satellite and ground data associated with the Wenchuan Earthquake of 12 May 2008 . International Journal of Remote Sensing , 31 : 3341 – 3354 .
- Tyagi , T. R. , Singh , L. , Devi , M. and Barbara , A. K. 1977 . Total electron content measurements at Gauhati using 140 MHz ATS-6 transmission . Indian Journal of Radio and Space Physics , 6 : 241 – 244 .
- Walker , G. O. and Chen , H. F. 1989 . Computer simulation of the seasonal variations of ionospheric equatorial anomaly in East Asia under solar minimum conditions . Journal of Atmospheric and Terrestrial Physics , 51 : 953 – 974 .
- Xia , C. , Wang , Q. , Yu , T. , Xu , G. and Yang , S. 2011 . Variations of ionospheric total electron content before three strong earthquakes in the Qinghai–Tibet region . Advances in Space Research , 47 : 506 – 514 .
- Zaslavski , Y. , Parrot , M. and Blanc , E. 1998 . Analysis of TEC measurements above 180, active seismic regions . Physics of the Earth and Planetary Interiors , 105 : 219 – 228 .