
Abstract
This paper illustrates the contribution of Persistent Scatterer SAR Interferometry (PSInSAR) technique to landslide detection, using interferometric data acquired in C-band by European remote-sensing satellite (ERS) 1/2 and environmental satellite (ENVISAT) satellites. The main purpose is to update a pre-existing landslide inventory map, by changing or confirming the landslide geometry and state of activity and eventually, identifying new phenomena.This work presents an application of satellite remote sensing to analyse ground displacement movements in the Setta basin, located on the northern Appennine (Bologna province, Italy) and extended up 268 km2.The proposed methodology, resting upon pre-existing works already consolidated in the scientific community, combines interferometric measures with aerial imagery and other auxiliary data, in order to detect landslide indicators, finally validated with field surveys. The use of an activity matrix allows the identification of the state of activity of landslide phenomena with respect to the velocity of the radar displacement rates. Field validations are carried out in the areas that are more relevant because of the highest ground velocities and the presence of structures extensively affected by ground movements.The final updated landslide database of the Setta basin, based on Persistent Scatterer Interferometry analysis and in situ checks, consists of 1550 landslides, 236 of which have persistent scatterer information.
1. Introduction
Natural hazard databases, such as landslide inventories, are essential for risk management purposes, since they allow improving systems of phenomena indicators and maps on disaster vulnerability, at national and sub-national (i.e. regional and basin) scales.
Landslide inventory maps show the spatial distribution of past and current landslides and often include information about their typology and state of activity (Wieczorek Citation1984). Landslide databases are crucial to assess landslide hazard, susceptibility and risk within an area (Aleotti & Chowdhury Citation1999; Dai et al. Citation2002). However, landslide inventories may have different spatial resolution and detail, according to the different goals, scales and data collection methods. In Italy, the official landslide inventories provided by local authorities are usually based on documental sources, historical archives, aerial orthophotos analysis and geomorphological surveys (Crozier Citation1984; Soeters & Van Westen Citation1996).
The IFFI project (Inventory of Landslide Phenomena in Italy), carried out by ISPRA (Istituto Superiore per la Protezione e la Ricerca Ambientale) (ISPRA Citation2007) and the Regions and Autonomous Provinces, supplies a detailed picture of the distribution of landslide phenomena within Italy, aiming at identifying and mapping landslides over the whole national territory, based on standardized criteria.
An environmental analysis within the updating of these existing landslide inventory maps needs to be performed. The landslide spatial extensions are often not up to date and, moreover, landslide classification and validation strategies (Guzzetti et al. Citation1999; Agnesi et al. Citation2012) need to be optimized for phenomena assessment procedures at regional and local scales. Synthetic aperture radar (SAR) techniques, such as Persistent Scatterer Interferometry (PSI), can offer great support in the implementation of landslide inventory maps, since they provide ground displacement data that are characterized by rapid and easily updatable measurements, very high (millimetre) accuracy, great spatial resolution (up to 1 m), good temporal radar data availability (starting from 1992 up to present, with monthly acquisitions) and wide area coverage, consequently reducing efforts, fieldwork and costs.
A new approach for the updating of pre-existing landslide inventories has been recently developed and experimented (Farina et al. Citation2004, Citation2006; Righini et al. Citation2012), combining traditional geomorphological thematic information (e.g. topographic, geological, land use maps, optical images) and in situ observations with ground displacement data obtained through PSI analysis. This operational methodology, which has been successfully tested and used within several scientific applications (Meisina et al. Citation2006; Pancioli et al. Citation2008; Herrera et al. Citation2009, Citation2010; Cascini et al. Citation2009; Cigna et al. Citation2010, Citation2013; Notti et al. Citation2010; Bianchini et al. Citation2011, Citation2012; Righini et al. Citation2012) is based on the coupled radar-interpretation and photo-interpretation procedures (Casagli et al. Citation2008; Farina et al. Citation2008; Pancioli et al. Citation2008; Herrera et al. Citation2009) and on the classification of the landslide state of activity (WP/WLI Citation1993; Cruden & Varnes Citation1996), integrating qualitative and quantitative information of the phenomenon at hand.
This paper, resting upon the recent studies and scientific works carried out in the last years, shows the contribution of European remote-sensing satellite (ERS) and environmental satellite (ENVISAT) persistent scatterers (PS) data for the spatial and temporal updating of a pre-existing landslide inventory map in the Setta basin within Bologna province in central Italy.
In this work, an application of the recent matrix-based methodology (Bianchini et al. Citation2012; Righini et al. Citation2012; Cigna et al. Citation2013) for characterizing landslides geometry and activity throughout PS measures is performed. A field survey is carried out in the areas that showed the highest PS ground motion rates affecting buildings and manufactures: in situ checks confirmed the SAR data results, finally validating and updating the landslide inventory map within the whole Setta basin.
The updated landslide database can represent a useful tool for future landslide hazard assessment, since it could be used and integrated in land use management and civil protection policies by environmental authorities, in order to identify landslide-prone areas and eventually to prevent and mitigate landslide occurrences in the investigated basin.
2. Case study area
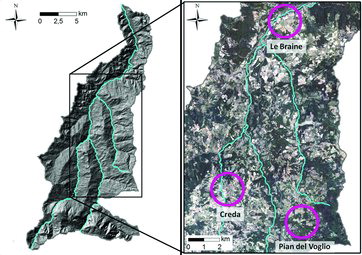
The case study area, extended up 268 km2, is the Setta basin, which is located in the southern Emilia-Romagna region in central Italy on the northern Appennine within Bologna province; the investigated territory includes the watershed of Setta stream, which is the right tributary of the Reno river ().
Figure 1. Study area: Location and geological sketch map of the Setta basin.
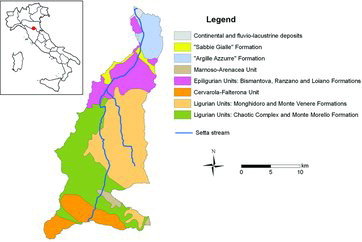
The northern Appennine belt is part of the major orogenic Appennine system of the Italian peninsula. It is composed of mostly NE-verging tectonic units piled up first during the Cretaceous–Eocene pre-collisional convergence, and then during the Oligocene–Neogene collisional steps of the Appennine orogenic development.
The terrains outcropping in the investigated area are mainly represented by metapelitic–carbonate succession belonging to the Ligurian domain, turbiditic sandstones–marls succession belonging to the Tuscanian domain (Cervarola–Falterona unit) and clay–sandy deposits of the Epiligurian domain ().
The oldest and uppermost tectonostratigraphic sequence is composed of Jurassic to Eocene–Ligurian units that were originally deposited in the Ligurian-Piedmont ocean and progressively accreted at the convergent orogenic margin (Principi & Treves Citation1984). Ligurian units in the test area include ophiolites, which are made of gabbros and serpentines scattered in the undifferentiated chaotic complex, and their sedimentary cover, i.e. Monte Venere and Monghidoro formations: these successions are, respectively, Paleocenic calcareous–marly turbidites and arenaceous–shaly turbidites, and crop out in the eastern portion of the area of interest ().
The Ligurian units tectonically overlie the Cervarola–Falterona unit that represents the detached top of the Tuscan succession; Cervarola–Falterona sequence is made of Lower Miocene deep-sea silicoclastic sediments that accumulated in the eastward migrating foredeep basin developing in front of the Appenninc orogenic wedge (Remitti et al. Citation2007).
The tectonic Ligurian and Tuscan nappe stack in the northern Appennine is unconformably overlain by Eocene to Pliocene Epiligurian units, deposited in marine thrust-top piggyback basins (Ricci Lucchi Citation1986; Barchi et al. Citation2001; Cibin et al. Citation2001). Epiligurian units, which outcrop in the central-northern part of the investigated area, consist, from bottom to the top, of Bismantova formation (Lower-Middle Miocene), Ranzano sandstones (Oligocene) and Loiano sandstones (Lower Miocene), and are mostly made of siliciclastic and bioclastic marly–silty sediments, alternating with pelitic-arenaceous and arenaceous bodies, calcarenites and sandstones (Bettelli et al. Citation2002).
Clay marine sediments, known as “Argille Azzurre” formation deposited in Lower-Middle Pliocene, also crop out in the northern portion of the study area. Above the “Argille Azzurre”, the Pleistocene “Sabbie Gialle” deposits, made up of yellowish sands with clays, finally close the sedimentary sequence, also outcropping in the northern portion of the investigated basin (Bargossi et al. Citation2004) ().
Overall, the geological setting of the Setta basin is characterized by clay and alternated clayey, silt and sandy formations that have poor geotechnical characteristics, triggering the occurrence of many shallow slow-moving ground movements.
3. Materials and methods
3.1. Methodology
Nowadays interferometric radar approaches represent a powerful tool to study movements on the Earth's surface. Thus, classical surveying techniques have recently been complemented by satellite SAR data analysis for detecting, monitoring and mapping landslide phenomena (Gabriel et al. Citation1989; Bamler & Hartl Citation1998; Rosen et al. Citation2000). In particular, PSI is an advanced multi-temporal interferometric technique that analyses long temporal series of SAR images, providing annual velocities along the satellite line of sight (LOS) on a space grid of stable pointwise targets, hereafter called PS (Ferretti et al. Citation2001).
The methodology used in this work follows the approach proposed by Farina et al. Citation(2006) and Righini et al. Citation(2012), based on the integration of conventional geomorphological tools with satellite radar data.
The methodology is summarized in the flow chart in .
Figure 2. Flow chart of the methodology.
As a preliminary phase, all the available data, i.e. radar data, landslide database and additional geo-thematic data, are collected and implemented in a GIS (geographic information system) environment. Thereafter, on the basis of pre-existing inventory map and PS distribution, the combined radar-interpretation and aerial photo-interpretation procedures (Farina et al. Citation2006; Casagli et al. Citation2008; Pancioli et al. Citation2008; Herrera et al. Citation2009) allow the detection and mapping of landslides, validated through field survey.
Once mapped the spatial distribution of landslides, the state of activity is also evaluated for each phenomenon ().
The landslide activity assessment is performed by means of a PSI-based matrix approach. The activity matrix is defined in terms of velocity and acquisition time and follows the approach proposed by Righini et al. (2012) and Cigna et al. Citation(2013) (.
Figure 3. Landslide activity matrix based on velocity rates of ERS and ENVISAT data velocity index (Ixy): N → no data; 0 → V < 2 mm/year; 1 → V > 2 mm/year.
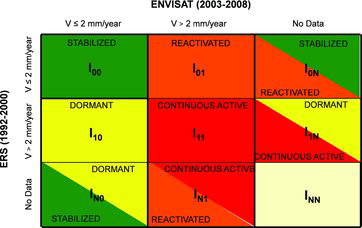
For every phenomenon, a representative velocity is assigned by calculating the average velocity of all the PS included within its boundaries; this velocity is compared with a threshold that is chosen as 2 mm/year to evaluate the state of activity, according to the cell grid of the matrix (). The 2 mm/year threshold corresponds to the minimum value exceeding the precision of the PSI technique. It is worth to highlight that the current satellites can only measure movements up to few decimetres per year, due to their technical parameters (i.e. signal wavelength, revisiting time).
Thus, the characterization of the landslides is only focused on extremely slow and very slow landslides, according to the velocity classification of Cruden and Varnes Citation(1996).
The activity matrix proceeds from the combination of the landslide velocities derived from the PS ground displacement rates extracted by ERS and ENVISAT satellites for the two time periods, i.e. past and recent intervals, respectively, from 1992 to 2001 for ERS, and from 2002 to 2007 for ENVISAT.
Therefore, each landslide is characterized by two velocity rates related to the ERS data and ENVISAT data; in both cases, either the ascending or descending mean velocity is considered, whichever is higher.
The considered velocity classes are two: one is ≤2 mm/year and the other is >2 mm/year. By combining the two different velocity classes and taking into account the data acquisition period, nine velocity combinations are defined, which correspond to nine different states of activity.
Each combination that identifies a specific state of activity is defined by a velocity index (Ixy) composed of two subscripts. The first subscript refers to the mean velocity rate of the ERS data-set, and the second one refers to the mean velocity rate of the ENVISAT data-set. Subscripts can be:
0 – velocity from 0 to 2 mm/year;
1 – velocity higher than 2 mm/year;
N – lack of interferometric data.
In the case of missing information from ERS or ENVISAT data, the new state of activity is considered as undetermined between two states of activity, resulting in a double name in four matrix cells. If ERS data (past information) indicate velocity higher than 2 mm/year, but there is a lack of ENVISAT data (recent information), then the landslide state of activity could be either “active continuous” or “dormant” since the present behaviour of the phenomenon is unknown. If ERS data indicate velocity equal or lower than 2 mm/year and there is a lack of ENVISAT data, then the landslide state of activity could be either “reactivated” or “stabilized”. On the other hand, if a lack of ERS data exists, while ENVISAT rates indicate stability (velocity in the range of 0–2 mm/year), then the state of activity could be either “dormant” or “stabilized”. If there is a lack of ERS data, but ENVISAT data indicate a ground movement (velocity higher than 2 mm/year), then the state of activity could be either “continuous active” or “reactivated”. In these cases, further information related to the past or recent period is needed to solve the ambiguity.
3.2. Input data
The available input data for the study area are taken from different sources and homogenized in a GIS (.
The interferometric data derive from SAR images acquired in both ascending and descending orbits by ERS 1/2 and ENVISAT satellites, producing 7125 and 3702 PS, respectively ( and ).
Table 1. Interferometric data derived from SAR images of ERS 1, ERS 2 and ENVISAT missions.
Figure 4. Available input data for the Setta basin study area.
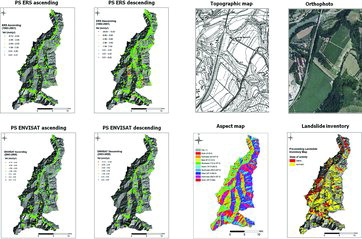
The most significant geomorphological data of the area, useful for identifying counter lines and slope orientations, consist in the topography, which is derived from the Regional Technical Map at 1:5000 scale and the orthophotos, which are based on monoscopic aerial photos acquired by AIMA Italy flight 2000 at a 1:5000 scale (). A DTM (digital terrain model) made by IGM (Military Geographical Institute) with a 20 m resolution and a geological map on a 1:50,000 scale are also used as additional layers. From the DTM, we derive the aspect map, which shows the orientation of the slopes with respect to the north direction. The study area is mainly characterized by E–W facing slopes, while N–S-oriented slopes cover very poorly extended zones (). For this reason, the test area turns out to be suitable to be investigated through radar systems that are side-looking and can better monitor E–W slopes.
The pre-existing landslide inventory map for the Setta basin is derived from the geological survey of Emilia Romagna region at 1:10,000 scale, within IFFI (Inventario Fenomeni Franosi in Italia) project (ISPRA Citation2007) and dated up to 2003 (). The total number of recorded landslides is 1537, covering an area of 72 km2 (26% of the total basin). The geometry, the typology and the state of activity are provided for each phenomenon. The number of dormant landslides is 886, while the active landslides are 651. The Emilia Romagna region classifies as dormant all the phenomena named “inactive” (dormant, naturally stabilized, artificially stabilized and relict), according to Cruden and Varnes Citation(1996).
4. Field survey
Field validations are essential for verifying the reliability of the radar data interpretation and evidencing the presence of building cracks, counter slopes and geomorphological signs due to landslides. In the area of interest, the field activity was carried out on the following most relevant sites (: Creda in the municipality of Castiglione dei Pepoli; Le Braine in the municipality of Monzun; and Pian del Voglio in the municipality of San Benedetto Val di Sambro.
Figure 5. Location of the investigated sites.
4.1. Creda site
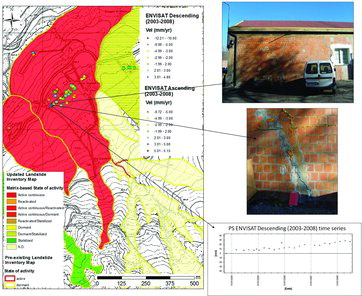
Creda is located in the municipality of Castiglione dei Pepoli, in the right side of Setta stream. The distribution of the interferometric data reveals that ground movements affect the area ( and ). The displacement scenario obtained with ERS data shows that the area was characterized by slope instability with a mean velocity up to 28 mm/year and with a strong displacement pattern in the period 1992–2000 (). The analysis of the ENVISAT data highlights a slower ground movement with a velocity up to 8 mm/year (). The radar interpretation and the application of the activity matrix allow the enlargement of a pre-mapped dormant landslide, modified in “continuous active”, and the detection of three new active ones, one “active continuous/reactivated” and two “active continuous/dormant”. During field survey, some damaged buildings and ground surface cracks were found, corresponding to the moving radar benchmarks, which confirm these ongoing movements ( and ).
Figure 6. Updated landslide inventory map by means of ERS PS in Creda site.
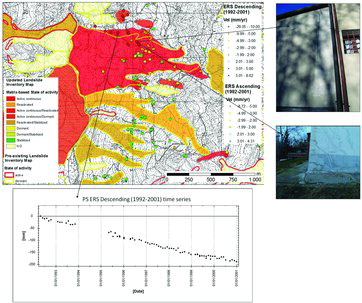
Figure 7. Updated landslide inventory map by means of ENVISAT PS in Creda site.
4.2. Le Braine site
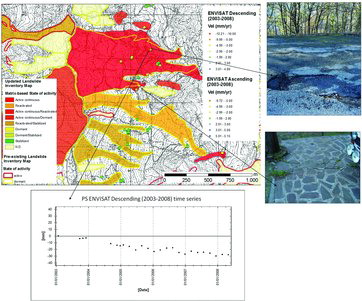
Le Braine is located in the municipality of Monzuno and a complex landslide affects the area ( and ). The interferometric data included within its geometry show a ground motion displacement in both historical (1992–2001) and recent (2002–2007) temporal periods.
Figure 8. Updated landslide inventory map by means of ERS PS in Le Braine site.
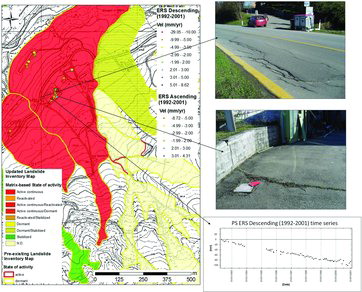
Figure 9. Updated landslide inventory map by means of ENVISAT PS in Le Braine site.
From 1992 to 2001, the whole area is characterized by consistent displacements with an average velocity of 6.8 mm/year, as shown by ERS data ().
The PS ENVISAT data-sets reveal not such a significant and constant pattern, but provide displacement with a mean yearly velocity of 4.6 mm (). In relation to the activity matrix, the state is changed from “dormant” to “continuous active”.
During the survey validation, many geomorphological evidences and indicators of movement (e.g. anomalies in vegetation coverage) were observed in the area; as shown in and , many cracks are visible on the main road with some little scarps, revealing the instability of the area.
Some of the buildings checked in the area are characterized by many fractures due to the movement of the settlement ground. Moreover, ground motions affect mainly the road network: cracks or scarps in the surface show clear landslide evidence; sometimes the tension cracks expand, determining elongated depression.
4.3. Pian del Voglio site
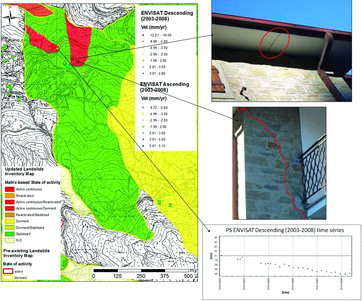
Pian del Voglio is located in the municipality of San Benedetto Val di Sambro, in Bologna province in the right hydrographic side of Setta stream; the area is affected by a landslide phenomenon classified as “dormant” translational slide. The radar velocities within ERS and ENVISAT data-sets and the field checks allow confirming this stability, but permit to delineate two active portions at the toe of the main landslide movement, identified as independent from it. The displacement rates reach up values of 10–29 mm/year in the period 1992–2001 () and 5–9.99 mm/year in the following period 2002–2007 (). The PS time series of these two time intervals show a strong temporal evolution trend ( and ). The in situ observations show cracks that are clearly referred to the terrain movement. Thus, the two active phenomena are identified as “continuous active”, while the larger already mapped landslide is classified as “stabilized”.
Figure 10. Updated landslide inventory map by means of ERS PS in Pian Del Voglio site.
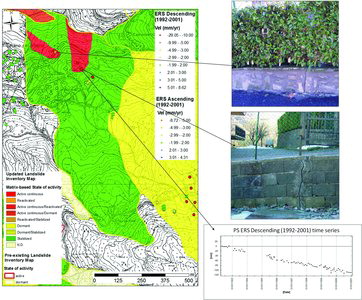
Figure 11. Updated landslide inventory map by means of ENVISAT PS in Pian Del Voglio site.
5. Final results
The applied state of activity classification of landslides takes benefit from the effective radar ground motion data. The landslides within the Setta basin, analysed by means of PSI technique, are 236 of which 223 were already mapped in the pre-existing landslides inventory map. In this work, we have reclassified the state of activity of the landslides, both the pre-mapped and the 13 newly detected phenomena, by means of the activity matrix in relation to the PS velocities.
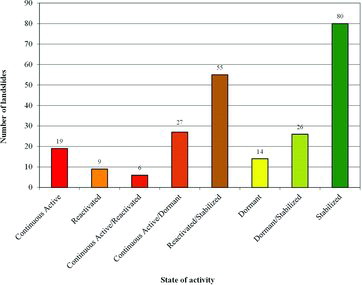
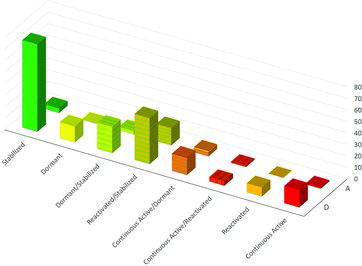
The landslide database updated with PS information includes 19 continuous active phenomena (8%), 9 reactivated (3.8%), 6 continuous active/reactivated (2.5%), 27 continuous active/dormant (11.4%), 55 reactivated/stabilized (23.3%), 14 dormant (5.9%), 26 dormant/stabilized (11.1%) and 80 stabilized (33.9%) ().
Figure 12. State of activity of 236 landslides with PS information classified according to the used activity matrix.
The 28 landslides classified as “active” in the pre-existing landslides database of Emilia Romagna region are reclassified, as we can see in . In particular 7 landslides are confirmed in the state of activity and boundaries, while 21 landslides are modified both in the state of activity and boundaries.
Figure 13. Reclassification of the 28 “active” (A) and 195 “dormant” (D) landslides in relation to the activity matrix used.
The 195 landslides classified as dormant by Emilia Romagna region are reclassified as we can see in . In particular, 82 are the landslides varied in the state of activity and boundaries and 113 confirmed.
Figure 14. Variations for the 236 landslides updated with PS data. For each state of activity the number of landslides is given and divided in relation to the type of updating (variation, confirm and new detection).
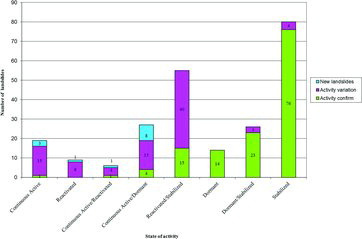
Among the 236 landslides with PS information, 134 phenomena are confirmed and 89 modified. Moreover 13 new phenomena were detected and classified as continuous active (3), reactivated (1), continuous active/reactivated (1) and continuous active/dormant (8).
In , for each state of activity the recorded landslides are counted according to the type of updating (confirm, variation and new detection).
In conclusion, we can summarize that:
new landslide perimetrates are all “active”;
there are few confirms for “active” landslides;
between “inactive” landslides there are many confirms;
there are many landslides that vary the activity status in “reactivated/stabilized” and “continuous active/dormant” due to the lower number of ENVISAT data available;
there are many variations to an “active” status (82).
6. Discussion
This work represents an application of slope instability mapping and updating by means of PSI analysis.
The Setta basin is a typical widespread situation in the Appennine chain in Italy: many small villages are built on hills characterized by soft sediments and affected by landslides that can experience sudden reactivation and acceleration of ground movements, triggered by rainfall and seismic activity.
The satellite orbit (approximately N–S) strongly limits the technique capabilities for detecting processes with N–S direction of movement, because the velocity measured along the LOS can be an underestimate of the real velocity. The study area is characterized by E–W facing slopes and, assuming that mass movements occur along the maximum slope direction, the LOS velocities are reliable for measuring the real displacements. Regarding the availability of radar point targets in the investigated area, the number of SAR images and the consequent low PS density obtained with ENVISAT data, especially for descending orbits, are lower than the ERS one (25 images and 9.23 PS/km2 for ENVISAT versus 76 images and 26.27 PS/km2 for ERS). Thus, the number of ERS PS within the mapped landslides is significantly higher (1749) than the amount of ENVISAT PS (931). Consequently, the number of the landslides containing ERS PS is 205 with an area of 34 km2, while the landslides with ENVISAT PS are 155 covering an area of 27 km2.
The recent launches of space-borne SAR missions, such as the X-band missions COSMO-SkyMed (Constellation of small Satellites for Mediterranean basin Observation) and TerraSAR-X, are providing acquisitions with a shorter revisiting time and higher spatial resolution, being more suitable for landslide investigations and reducing some of the PSI limitations. The updating of the product using new satellite missions, such as COSMO-SkyMed and TerraSAR-X (or even Sentinel that will be launched in 2014), could be a further potential perspective, deeply encouraged.
The radar interpretation demonstrates the usefulness of quantitative information that can be obtained from PSI technique in analysing and characterizing landslide phenomena at basin scale.
The distribution of PS inside a landslide cannot be homogeneous and the interferometric data can have different density (PS/km2). ERS and ENVISAT medium resolution data can detect a low amount of radar scatterers on the ground. Nevertheless, even few PS benchmarks can be significant if they are integrated and validated with field survey and additional geo-thematic information. This work is carried out at a basin scale, so the radar interpretation is site specific and performed singularly. Thus, all the available ERS and ENVISAT data in the investigated area are taken into account, even if few PS are retrieved, despite the PS density.
One of the main pending issues of this kind of investigation is the choice of the velocity threshold that must be selected to distinguish moving from not moving PS and consequently active from no-active landslide phenomena. There are no fixed rules to define stable velocity value thresholds. The choice is usually based on visual or statistical parameters, bearing in mind that these velocity thresholds are site specific and empirically determined taking into account the characteristics of the phenomena we are investigating (types, velocity) and the precision technique (e.g. the velocity threshold must be higher than the errors and noises within the measurements). In the study area of this work, PS populations of ERS and ENVISAT sensors are characterized by an almost Gaussian (normal) distribution, with coincident mean and median values and with standard deviation values ranging 1.5–2. As a result, we decided to establish the stability threshold of velocity at ±2 mm/year, since this is the widely and mostly used value in literature for this type of analysis with C-band radar data (Wasowski et al. Citation2002; Meisina et al. 2008; Righini et al. Citation2012) and since it fits our data and case study well.
The activity matrix used in this work is the outcome of several previous approaches and represents an appropriate tool when managing PS data for landslide state of activity assessment (Righini et al. Citation2012; Bianchini et al. 2012; Cigna et al. Citation2013).
The new classification based on the activity matrix permits not to underestimate the activity when there is a lack of interferometric data. Thus, for example, in the case of absence of ENVISAT data where it is not possible to assign a state of activity to a certain phenomenon due to the lack of data, we preserve the two possible states of activity, not to discard those that may be the probable causes of the absence of data. The lack of ENVISAT data accompanied by PS ERS that record velocities lower than 2 mm/year could lead to considering a landslide as “inactive” for the period 2000–2007, but it is not excluded that in the presence of ENVISAT data it could be a reactivated landslide.
Therefore, it is useful to have some classification parameters taking into account the origin of the interferometric data; in fact, the presence of both or only one of the data-sets gives a different weight to the final classification of the state of activity.
A landslide classified as “inactive” in relation to the presence of both stable ERS and ENVISAT PS has a higher reliability than a landslide classified as “inactive” for the presence of only stable ERS PS, bearing in mind that in this last case they give an information only for the temporal period between 1992 and 2000.
A better identification of the geometry of unstable areas and of their state of activity by means of radar data, especially in urban sectors, improves the quality of the urban and environmental planning in the areas characterized by a high hydrogeological hazard.
The PSI technique can only measure slow displacements so far: this fits well with the high number of extremely slow processes that affect the study area, characterized by clay, silt and sandy formations, prone to slow-moving ground movements.
Field surveys mainly confirm PSI analysis outcomes, since several damaged buildings were pointed out in correspondence with moving radar benchmarks; moreover, many signs of instability such as cracks, depressions and evidences of new layers of road fills were found on road networks.
In the area of interest, the number of landslides with no PS targets is 1314; this lack of PS information should be efficiently integrated by further other traditional geomorphological techniques, for example, ground-truth systems.
The distribution of PS is higher in urbanized areas that in agricultural and semi-natural areas; anyhow, the number of retrieved target points is quite satisfying as it ranges from 5 to 21points per km2 in the two different data-sets.
7. Conclusions
This work focuses on landslides inventory map updating in the Setta basin (Emilia Romagna region, Italy), integrating the interpretation of information retrieved from PSI with thematic maps and field survey. The results highlight the capabilities of multi-interferometric InSAR data, combined with conventional techniques, to support landslides investigation over large areas.
In particular, the contribution of this work relies on the use of a landslide activity matrix, which allowed us to reclassify the state of activity of landslides newly detected or already recorded in the pre-existing landslide database.
The outcomes demonstrate the usefulness of the PSI technique to update landslide inventories at basin scale, thanks to the available archives of historical and recent satellite data with monthly sampling and millimetre-scale accuracy.
This work represents a valuable tool that can be exploited by national agencies and local authorities for environmental planning in landslide-prone areas.
Acknowledgements
This work was carried out in the framework of the Terrafirma project (www.terrafirma.eu.com) which is one of the initiatives run by the European Space Agency under the Global Monitoring for Environment and Security (GMES) Service Element Program (GSE).
ERS and ENVISAT data were provided and processed by Tele-Rilevamento Europa (TRE) through the PSInSAR technique.
Access to IFFI (Inventario Fenomeni Franosi in Italia) landslide database was performed through the ISPRA's web map service (WMS), while the landslide phenomena map (Carta Inventario dei fenomeni franosi) for the test area was provided by Emilia Romagna region through region portal website and both inventories were homogenized and imported into GIS.
References
- Agnesi V, Angileri S, Arnone G, Calì M, Calvi F, Cama M, Cappadonia C, Conoscenti C, Costanzo D, Lombardo L, Rotigliano E. 2012. A multi-scale regional landslide susceptibility assessment approach: the sufra_sicilia (suscettibilità da frana in sicilia) project. In: Proceedings of the 7th EUREGEO. Bologna: Centro Stampa Regione Emilia-Romagna.
- Aleotti P, Chowdhury R. 1999. Landslide hazard assessment: summary review and new perspectives. Bull Eng Geol Environ. 58:21–44.
- Bamler R, Hartl P. 1998. Synthetic aperture radar interferometry. Inverse Probl. 14:R1–R54.
- Barchi M, Landuzzim A, Minellim G, Piallim G. 2001. Outer northern Apennines. In: Vai GB, Martini IP, editors. Anatomy of an orogen: the Apennines and adjacent Mediterranean basins. Dordrecht: Kluwer Academic Publishers; p. 215–254.
- Bargossi GM, Gamberini F, Gasparotto G, Grillini GC, Marocchi M. 2004. Dimension and ornamental stones from the Tosco-Romagnolo and Bolognese Apennine. Periodico di Mineralogia - LXXIII, special issue 3: 171–195.
- Bettelli G, Boccaletti M, Cibin U, Panini F, Poccianti C, Rosselli S, Sani F. 2002. Note illustrative della carta geologica d’Italia alla scala 1:50.000 Foglio 252 [Illustrative notes of the geological map of Italy, 1:50,000 scale, sheet 252]. Barberino del Mugello (Florence): Servizio Geologico d'Italia; p. 15–94.
- Bianchini S, Cigna F, Casagli N. 2011. Improving landslide inventories with multi-temporal measures of ground displacements retrieved through persistent scatterer interferometry [abstract]. In: Catani F, Margottini C, Trigila A, Iadanza C, editors. The Second World Landslide Forum. Putting Science into practice. Rome: FAO Headquarters.
- Bianchini S, Cigna F, Righini G, Proietti C, Casagli N. 2012. Landslide hotspot mapping by means of persistent scatterer interferometry. Environ Earth Sci. 67:1–18.
- Casagli N, Colombo D, Ferretti A, Guerri L, Righini G. 2008. Case study on local landslide risk management during crisis by means of remote sensing data. In: Proceedings of the First World Landslide Forum; Tokyo, Japan; p. 125–128.
- Cascini L, Fornaro G, Peduto D. 2009. Analysis at medium scale of low-resolution DInSAR data in slow-moving landslide affected areas. ISPRS J Photogrammetry Remote Sens. 64:598–611.
- Cascini L, Fornaro G, Peduto D. 2010. Advanced low- and full-resolution DInSAR map generation for slow-moving landslide analysis at different scales. Eng Geol. 112:29–42.
- Cibin U, Spadafora E, Zuffa GG, Castellarin A. 2001. Continental collision history from arenites of episutural basins in the northern Apennines, Italy. Geol Soc Am Bull. 113:4–19.
- Cigna F, Bianchini S, Casagli N. 2013. How to assess landslide activity and intensity with persistent scatterer interferometry (PSI): the PSI-based matrix approach. Landslides. 10:267–283.
- Cigna F, Bianchini S, Righini G, Proietti C, Casagli N. 2010. Updating landslide inventory maps in mountain areas by means of persistent scatterer interferometry (PSI) and photo-interpretation: central Calabria (Italy) case study. In: Malet JP, Glade T, Casagli N, editors. Mountain risks: bringing science to society. Florence: CERG Editions; p. 3–9.
- Crozier MJ. 1984. Field assessment of slope instability. In: Brunsden D, Prior DB, editors. Slope instability. London: Wiley; p. 103–142.
- Cruden DM, Varnes DJ. 1996. Landslide types and processes. In: Turner AK, Schuster RL, editors. Landslides: investigation and mitigation, Volume 247 of special report, Transportation Research Board, National Research Council Series. Washington (DC): National Academy Press; p. 36–75.
- Dai FC, Lee CF, Ngai YY. 2002. Landslide risk assessment and management: an overview. Eng Geol. 64:65–87.
- Farina P, Casagli N, Ferretti A. 2008. Radar-interpretation of InSAR measurements for landslide investigations in civil protection practices. In: Proceedings of the 1st North American Landslide Conference; 2007 Jun 3; Vail, CO; p. 272–283.
- Farina P, Colombo D, Fumagalli A, Marks F, Moretti S. 2006. Permanent scatterers for landslide investigations: outcomes from the ESA-SLAM project. Eng Geol. 88:200–217.
- Farina P, Moretti S, Colombo D, Fumagalli A, Manunta P. 2004. Landslide risk analysis by means of remote sensing techniques: results from the ESA/SLAM project. In: Proceedings of the International Geoscience and Remote Sensing Symposium; 2004 Sep 20–24; Anchorage, Alaska; Vol. 1, p. 62–65.
- Ferretti A, Prati C, Rocca F. 2001. Permanent scatterers in SAR interferometry. IEEE Trans Geosci Remote Sens. 39:8–20.
- Gabriel AK, Goldstein RM, Zebker HA. 1989. Mapping small elevation changes over large areas: differential radar interferometry. J Geophys Res. 94:9183–9191.
- Guzzetti F, Carrara A, Cardinali M, Reichenbach P. 1999. Landslide hazard evaluation: an aid to a sustainable development. Geomorphology. 31:181–216.
- Herrera G, Davalillo JC, Mulas J, Cooksley G, Monserrat O, Pancioli V. 2009. Mapping and monitoring geomorphological processes in mountainous areas using PSI data: central Pyrenees case study. Nat Hazards Earth Syst Sci. 9:1587–1598.
- [ISPRA] Istituto Superiore per la Protezione e la Ricerca Ambientale. 2007. IFFI, Inventario dei Fenomeni Franosi in Italia. http://www.isprambiente.gov.it/it/progetti/iffi-inventario-dei-fenomeni-franosi-in-italia
- Meisina C, Zucca F, Fossati D, Ceriani M, Allievi J. 2006. Ground deformation monitoring by using the permanent scatterers technique: the example of the Oltrepo Pavese (Lombardia, Italy). Eng Geol. 88:240–259.
- Meisina C, Zucca F, Notti D, Colombo A, Cucchi G, Giannico C, Bianchi M. 2008. Geological interpretation of PSInSAR data at regional scale. Sensors. 8(11):7469–7492.
- Notti D, Davalillo JC, Herrera G, Mora O. 2010. Assessment of the performance of X-band satellite radar data for landslide mapping and monitoring: upper Tena Valley case study. Nat Hazards Earth Syst Sci. 10:1865–1875.
- Pancioli V, Raetzo H, Campolmi T, Casagli N. 2008. Terrafirma landslide services for Europe based on space-borne InSAR data. In: Proceedings of the First World Landslide Forum; Tokyo, Japan; p. 81–84.
- Principi G, Treves B. 1984. Orogenic belts as accretionary prism: the examples of the northern Appennines. Ofioliti. 9:557–618.
- Remitti F, Bettelli G, Vannucchi P. 2007. Internal structure and tectonic evolution of an underthrust tectonic melange: the Sestola-Vidiciatico tectonic unit of the northern Apennines, Italy. Geodinamica Acta. 20:37–51.
- Ricci Lucchi F. 1986. The Oligocene to recent foreland basins of the northern Apennines. In: Allen PA, Homewood P, editors. Foreland basins. International Association of Sedimentologists. Oxford (UK): Blackwell Publishing; p. 105–140.
- Righini G, Pancioli V, Casagli N. 2012. Updating landslide inventory maps using persistent scatterer interferometry (PSI). Int J Remote Sens. 33:2068–2096.
- Rosen PA, Hensley S, Joughin IR, Li FK, Madsen SN, Rodriguez E, Goldstein RM. 2000. Synthetic aperture radar interferometry. Proc IEEE. 88:333–382.
- Soeters R, Van Westen CJ. 1996. Slope instability recognition, analysis and zonation. In: Turner AK, Schuster RL, editors. Landslides: investigation and mitigation, Volume 247 of special report, Transportation Research Board, National Research Council Series. Washington (DC): National Academy Press; p. 129–177.
- Wasowski J, Refice A, Bovenga F, Nutricato R, Gostelow P. 2002. On the applicability of SAR interferometry techniques to the detection of slope deformations. In: Proceedings of 9th IAEG Congress; Durban, South Africa.
- Wieczorek GF. 1984. Preparing a detailed landslide-inventory map for hazard evaluation and reduction. IAEG Bull. 21:337–342.
- [WP/WLI] Working Party on World Landslide Inventory. 1993. Multilingual glossary for landslides. Richmond (BC): The Canadian Geotechnical Society, BiTech.