
Abstract
Automated remote sensing methods have not gained widespread usage for damage assessment after hurricane events, especially for low-rise buildings, such as individual houses and small businesses. Hurricane wind, storm surge with waves, and inland flooding have unique damage signatures, further complicating the development of robust automated assessment methodologies. As a step toward realizing automated damage assessment for multi-hazard hurricane events, this paper presents a mono-temporal image classification methodology that quickly and accurately differentiates urban debris from non-debris areas using post-event images. Three classification approaches are presented: spectral, textural, and combined spectral–textural. The methodology is demonstrated for Gulfport, Mississippi, using IKONOS panchromatic satellite and NOAA aerial colour imagery collected after 2005 Hurricane Katrina. The results show that multivariate texture information significantly improves debris class detection performance by decreasing the confusion between debris and other land cover types, and the extracted debris zone accurately captures debris distribution. Additionally, the extracted debris boundary is approximately equivalent regardless of imagery type, demonstrating the flexibility and robustness of the debris mapping methodology. While the test case presents results for hurricane hazards, the proposed methodology is generally developed and expected to be effective in delineating debris zones for other natural hazards, including tsunamis, tornadoes, and earthquakes.
1. Introduction
Tropical cyclones are a significant natural hazard in coastal areas around the world, posing a severe threat to human lives and properties. Annual losses from hurricanes in the US alone are estimated at approximately $5.4 billion (Li & van de Lindt Citation2012). To rapidly evaluate the severity of damage in disaster areas, remote sensing is both cost-effective and efficient for assessing large areas. Zhang et al. (Citation2002), Tralli et al. (Citation2005), Hutchinson and Chen (Citation2005), Chen and Hutchinson (Citation2007), Chen and Hutchinson (Citation2010), Kashani et al. (Citation2014), Pesaresi et al. (Citation2007), Guo (Citation2010), Wang et al. (Citation2010), Hussain et al. (Citation2011), Li et al. (Citation2011), and Olsen et al. (Citation2013) have demonstrated successful applications of remote sensing for natural disaster damage assessment across a wide range of hazards, including floods, earthquakes, tornadoes, volcanoes, landslides, tsunamis, and tropical cyclones.
Post-tropical cyclone damage assessments have utilized imagery ranging from very high (e.g., IKONOS; Vijayaraj et al. Citation2008) to medium (e.g., Landsat; Womble et al. Citation2006) to low (e.g., MODIS; Wang et al. Citation2010) spatial resolution. For detection of residential structural damage, a spatial resolution of 1.5 m is considered to be the minimum pixel size threshold (Jensen Citation2007; Battersby et al. Citation2012). Additionally, Lidar has been used to detect three-dimensional variance after hurricanes (Li et al. Citation2008; Hussain et al. Citation2011) and tornadoes (Kashani et al. Citation2014). Texture information derived from imagery (Vijayaraj et al. Citation2008; Radhika et al. Citation2012) has been used to rapidly detect damaged areas, as have band ratios (e.g., Normalized Difference Vegetation Index; NDVI) (Ill et al. Citation1997; Womble et al. Citation2006; Liou et al. Citation2010; Wang and Xu Citation2010; Wang et al. Citation2010). Multi-temporal analysis is generally employed for post-disaster events through the application of change detection (Al-Khudhairy et al. Citation2005; Chen & Hutchinson Citation2007, Citation2010; Wang et al. Citation2010; Butenuth et al. Citation2011) for co-registered pre- and post-event images. Mono-temporal analysis requires only post-event imagery, and eliminates errors caused by co-registration, illumination, incidence angle, temporal lag, and image anomalies between pre- and post-event imagery (e.g., Taskin Kaya et al. Citation2011; Voigt et al. Citation2011).
Olsen et al. (Citation2013) focus on the concept of damage assessment scale and Vijayaraj et al. (Citation2008) have used a spatially tiered damage assessment to scan areas at a regional level to identify where to focus neighbourhood and building-level damage assessment efforts. Ghosh et al. (Citation2007) evaluated damage at three different scales, namely, regional, neighbourhood, and per-building scales. Friedland et al. (Citation2011) and Zheng et al. (Citation2011) have identified damage at both the neighbourhood and per-building scale.
Hurricane Katrina (23–30 August 2005) made landfall along the northern central Gulf of Mexico coast in the United States, causing significant economic losses, injuries, and fatalities predominantly in Louisiana and Mississippi (Womble et al. Citation2006; Fritz et al. Citation2007). Hurricane Katrina's storm surge destroyed building structures along the coastal area, sweeping away residential neighbourhoods. Previous research in urban areas shows that building damage increases with increased proximity to the coastline (Womble et al. Citation2006; Friedland et al. Citation2007a, Citation2007b), and the building damage debris line seen in post-hurricane imagery has been proposed to divide the disaster area into distinct zones to facilitate identification of building damage categories (Womble et al. Citation2006; Friedland et al. Citation2011). Existing research utilized labour-intensive (Barnes et al. Citation2007) manual approaches through visual identification and digitization of the debris boundary and application of the vectored debris line for categorization of debris zones. In addition to the amount of time required to manually define the debris zone, there is much subjectivity in the delineation, and efforts to quickly establish a debris line or zone result in errors and oversimplification (Friedland et al. Citation2011). Wang and Xu (Citation2010), Wang et al. (Citation2010), Thompson et al. (Citation2011), and Szantoi et al. (Citation2012) investigated detection of hurricane-damaged forest areas and forest debris, but automatic mapping of urban debris zones remains a research gap, particularly for events with widespread impacts.
There are many parameters that must be optimized to obtain ideal post-event imagery, and selection of imagery is often a compromise of these parameters. For example, satellite imagery can be collected for large geographical extents at one time, but is prone to haze and cloud cover. Aerial imagery, which can be collected below cloud ceilings, can be specifically tasked; however, unless it is provided by an agency or the cost distributed amongst many users, tasking aerial imagery acquisition can be much more expensive than acquisition of one or two satellite scenes. Additionally, revisit time may be an issue for satellite collection on cloud-free days, and controlled airspace could limit collection of aerial imagery. Consequently, robust remote sensing damage assessment methodologies should be flexible in their imagery requirements to provide reliable results independent of the data collection platform.
This paper proposes an automated mono-temporal methodology to detect primary building damage debris zones in urban areas following tropical-cyclone-induced storm surge events using either satellite or aerial imagery. The methodology incorporates the classification of spectral and textural information and the extraction of the debris zone and debris line in an automated approach. The immediate application of this methodology is to map the debris zone and debris line for further damage assessment at the neighbourhood and per-building levels. The framework was tested with IKONOS panchromatic satellite and NOAA aerial imagery collected within 4 days after the landfall of Hurricane Katrina in Gulfport, Mississippi. The results show that the proposed methodology is robust for post-hurricane debris zone mapping across image platforms (satellite vs. aerial), number and type of bands (panchromatic vs. red-green-blue [RGB]), and classification methods, and that the introduction of textural classification significantly improves debris zone identification. The methodology has been developed following a general approach, and it is expected to produce reliable results for other hazards that generate significant building debris, including tsunamis, tornadoes, and earthquakes.
2. Study area and data
Hurricane Katrina made landfall at the western border of coastal Mississippi on 29 August 2005 (Fritz et al. Citation2007; Womble et al. Citation2008) and significantly impacted the Mississippi coastline, causing damage and destruction to engineered infrastructure, especially to commercial, public, and residential buildings. Mississippi's three coastal counties were all affected, with damage caused by wind, storm surge and associated waves, and inland flooding (Womble et al. Citation2006; Friedland et al. Citation2007b). A 900 m by 630 m section of the city of Gulfport, Mississippi, was selected for this research (black area shown in ) and exhibits three zones with distinct visual signatures: the primary debris zone and the areas landward and seaward of the primary debris zone. The study area size was selected based on previous research using very high-resolution imagery for land use classification in urban areas (Li et al. Citation2010) and road damage assessment after earthquakes (Li et al. Citation2011).
Figure 1. Study area location (Data source: United States Census Bureau).
The datasets used in this study include IKONOS panchromatic imagery with 1 m spatial resolution acquired on 2 September 2005 and NOAA aerial photography consisting of three (RGB) bands with 0.3 m spatial resolution collected on 30 August 2005 (). IKONOS is a high-resolution satellite now operated by DigitalGlobe (formerly Space Imaging and GeoEye), consisting of four multispectral bands and one panchromatic band. IKONOS was launched on 24 September 1999, and has provided imagery since 1 January 1 2000. IKONOS data for the study were obtained online from Mississippi Automated Resource Information System (MARIS). For the past several years, NOAA has provided aerial photography in response to natural disasters. Photo survey missions are conducted quickly after the disaster event and digital photos are available online (http://oceanservice.noaa.gov/geodesy/aerialphotos/) within 12 hours after the survey mission. For Hurricane Katrina, both sources of imagery were captured within 4 days of landfall and clearly show a primary debris zone resulting from building and tree damage.
Table 1. Post-Katrina remote sensing datasets for the study area.
The NOAA aerial photo was co-registered with IKONOS to ensure the locations in the two imagery sources corresponded. The resample root-mean-square error (RMSE) was 0.364 pixels, meeting the RMSE threshold of 0.5 pixels (Li et al. Citation2009, Citation2011). In order to test the data sources at the same spatial resolution, the registered NOAA photo was resampled to 1 m spatial resolution. The IKONOS and NOAA imagery were processed separately and the results derived from the imagery types are compared.
3. Methodology
The methodological workflow for debris zone identification consists of image classification, debris zone extraction, and evaluation (). After preliminarily identifying separate debris areas, further image processing is implemented to connect the primary, contiguously located debris areas together. No single post-classification method has been found to adequately capture the entire debris zone, so several post-classification approaches are recommended, including majority/minority analysis, morphological operations, and sieve. shows these the post-classification methods without a specific order of application, as they are applied in an iterative fashion based on the acceptability of the identified debris zone. Detailed information of each processing step is provided and explained in the following sections.
Figure 2. Debris zone and debris line extraction workflow.
3.1. Image classification
To preliminarily identify debris zones, three land cover classification approaches were implemented: supervised support vector machine (SVM; Chih-Wei and Chih-Jen Citation2002) classification using only the spectral band, unsupervised iterative self-organizing data analysis (ISODATA; Melesse and Jordan Citation2002) classification using imagery-extracted texture information, and SVM classification using combined spectral–textural information. ISODATA classifies imagery by grouping similar pixels together without pre-training samples, while training sample selection is essential for SVM.
Texture has been widely applied for damage mapping after natural disasters (Vijayaraj et al. Citation2008; Radhika et al. Citation2012), and multivariate texture (Bourgault & Marcotte Citation1991; Abarca-Hernández & Chica-Olmo Citation1999; Chica-Olmo & Abarca-Hernandez Citation2000; Jin et al. Citation2011) has been adopted for debris extraction (equation (1); Bourgault and Marcotte Citation1991; Li et al. Citation2009). One advantage of multivariate texture is that a specific band is not required for texture calculation, which is required by most traditional single-texture measures (Li et al. Citation2009). The multivariate variogram is expressed by equation (1).
(1) where
is the multivariate variogram at vector distance
; and
and
are pixel vectors at position
and
, respectively, with lag distance
. The superscript
denotes the transpose of the matrix; and
is a symmetric positive definite matrix
, where p represents image bands. The experimental multivariate variogram was further calculated by averaging the multivariate distance squared (equation (2); Abarca-Hernández and Chica-Olmo Citation1999; Chica-Olmo and Abarca-Hernandez Citation2000; Li et al. Citation2009).
(2) where
is the number of distance pairs
; and
and
are pixel vectors at
and
, respectively. Lag distance and moving window size parameters required for multivariate texture calculation (Karathanassi et al. Citation2000; Chen et al. Citation2004) were selected using a trial-and-error method.
The imagery was classified into two land cover classes: debris and non-debris. As the ranges of the derived texture and spectral data were different, they were first normalized into the range [0, 1] before further classification, which is formulated in equation (3).
(3) where
is the normalized value of pixel i,
is the original digital number at pixel i, and
and
are the minimum and maximum digital number values of the corresponding band (Li et al. Citation2009). For supervised spectral classification and combined spectral–textural classification, multiple land cover classes (e.g., buildings, forest, grass) were first determined, and then classified as non-debris. For classification with texture alone, the image was directly classified to debris and non-debris classes by setting the ISODATA classifier parameter to 2.
3.2. Debris zone extraction
Debris zone extraction was accomplished by iteratively connecting adjacent non-contiguous debris areas together by majority/minority analysis and morphological dilation and erosion operations, and then applying sieve to remove isolated pixels, resulting in the primary debris zones and non-debris areas.
For conventional remote sensing classification, salt and pepper noise (SPN) is a common problem associated with pixel-based classification. In SPN, random pixels do not belong to the class of the majority pixels in the surrounding area. To eliminate speckling and isolated pixels, Ehlers et al. (Citation2003) and Yuan et al. (Citation2005) applied a majority filter during post-classification processing. For disaster debris, which is not entirely contiguous, isolated debris areas are expected. For this reason, a minority filter is used to connect separate debris areas together by recoding isolated non-debris class pixels to the debris class.
Mathematical morphology provides an approach to process digital images that is becoming more common in the remote sensing domain (Soille & Pesaresi Citation2002; Al-Khudhairy et al. Citation2005; Li & Xiao Citation2007), including structural damage assessment with IKONOS data (Al-Khudhairy et al. Citation2005). Two morphological operators are used in this research: dilation and erosion. Dilation combines two sets using vector addition of set elements and erosion combines two sets using vector subtraction of set elements (Haralick et al. Citation1987). In the greyscale morphology, dilation and erosion
are defined by equations (4) and (5).
(4)
(5) where
is a function representing an image,
represents a structure element set, and
is the element of B(s, t). After the image was classified into debris or non-debris classes, morphological operations were applied to capture the debris zone by connecting separate debris areas. It is noted that for two distinct classes, application of a dilation operator to one class (e.g., debris) is the equivalent of application of an erosion operator to the other class (e.g., non-debris).
After capturing the main debris zone, isolated non-debris pixels were still scattered throughout the main debris region and isolated debris pixels were distributed throughout the non-debris area. The sieve tool in the ENVI software package was applied to remove these isolated pixels. During the sieving operation, the sieve threshold was selected by visually estimating the number of isolated pixels or using the ENVI Region of Interest (ROI) tool to count the number of maximum isolated pixels. If the number of isolated pixels was less than the selected threshold, they would be removed and the removed pixels would be assigned to the surrounding class. Finally, the processed imagery consisted of only the debris zone and non-debris areas. While the specific order of application of the post-classification methods will vary for distinct images and debris signatures, a generalized flowchart for debris zone extraction is shown in . Dilation/majority filter and erosion/minority filter are shown together to convey their similar mathematical meanings.
Figure 3. Flowchart for debris zone extraction based on debris and non-debris classification result.
3.3. Evaluation of debris zone
After the debris zone was determined, its boundary was extracted as a vector debris line. Previous studies of urban debris delineation (e.g., Friedland et al. Citation2011) identified the debris zone and debris line by visual interpretation of post-disaster imagery with no criteria for evaluating the extracted debris zone or debris line. In this study, the extracted debris zone and debris line were evaluated by quantifying the number of pixels identified by each classification approach and imagery type, through qualitative visual inspection of the debris zone for each classification approach and imagery type, and by comparison of the debris zone vector difference for the two image types.
4. Results and discussion
The focus of this research was to accurately and rapidly map the debris zone and extract the debris line after Hurricane Katrina for a study area in Gulfport, Mississippi, using IKONOS and NOAA aerial imagery. The results are presented in the following sections.
4.1. IKONOS debris zone extraction
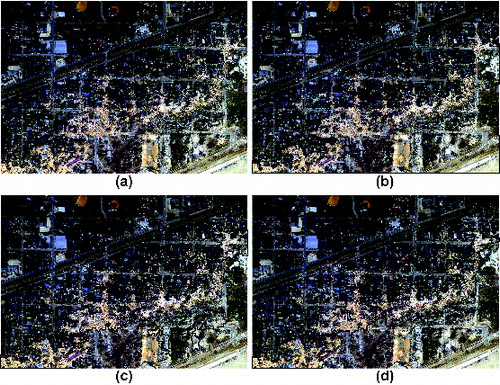
For spectral and spectral–textural classification, SVM was applied to classify land cover types into four classes: tree, grass, building, and debris. Tree, grass, and building classes were further classified as a single non-debris class. For texture classification, ISODATA was used to directly classify the texture image to debris and non-debris classes. The lag distance was set as 1 (pixel) and the window size was 3, 5, 7, 9, 11, 13, and 15 for multivariate texture calculation. Based on the trial-and-error method, texture derivation using a window size of 7 was selected for debris classification. The textural and spectral data were further normalized to the same range for classification. provides the original IKONOS panchromatic image and the classification results, where white represents debris and black represents non-debris classes.
Figure 4. IKONOS data and classification results: (a) IKONOS-2 panchromatic image (Source: DigitalGlobe 2-Sep-05); (b) spectral only classification; (c) textural only classification; (d) spectral–textural classification (white = debris class, black = non-debris class).
(b)–(d) show significant differences in the results of the classification methods. The spectral classification ( (b)) shows significant misclassification between debris and building and grass land cover types. The misclassification is obvious in the right bottom corner of the image, which is identified as debris although it is actually covered with grass or bare land. Through visual comparison of misclassification areas of (b)–(d), it was found that textural ((c)) and spectral–textural ((d)) approaches performed better than spectral ((b)), with spectral–textural ((d)) resulting in the minimum amount of misclassification. Although the overall debris identification in (d) was better than that in (c), (c) still captured the main debris distribution, which is the primary motivation of this study. Because hurricanes generally influence large areas and many image tiles are often needed to cover the disaster area (Vijayaraj et al. Citation2008), this result suggests that ISODATA texture classification alone may be sufficient to rapidly process large volume of images with good results without the need for supervised classification.
Following classification, majority/minority, dilation/erosion, and sieve image processing were used to extract the main debris zone. All image processing was completed using the ENVI software package based on image-dependent parameters. The order of processing methods and parameters differ based on the imagery and classification results. The general methodology shown in was followed as a guide to the process based on visual evaluation of the debris zone identification with the original image. The specific process order and parameters are provided in for the three classification results for IKONOS and NOAA imagery. Because of the similar intent of dilation and majority filter, these operations are shown in in bold font, where erosion and minority filter are shown in with underlined font. Additionally, indicates the class used for each operation, i.e., debris or non-debris. It is noted that for complementary operations, dilation of debris class is equal to erosion of non-debris class. After the final debris zone was identified, it was converted from a polygon to polyline in the ArcGIS software package. shows the extracted debris zone results (i.e., polygons) and shows the polyline overlain on the original IKONOS data for the three classification methods.
Table 2. Case study operations and corresponding parameters for debris zone extraction based on imagery type and classification approach.
Figure 5. Debris zone results for IKONOS imagery based on classification approach: (a) spectral only; (b) textural only; (c) spectral–textural (white = debris class, black = non-debris class).
Figure 6. Debris line results for IKONOS imagery (Source: DigitalGlobe 2-Sep-05) based on classification approach: (a) spectral only; (b) textural only; (c) spectral–textural.
Based on the results shown in (a) and (a), the spectral only classification included significant areas of non-debris in the debris zone, most prominently in the bottom right corner where bare soil is included in the debris zone, resulting from misclassification shown in (b). Given the improvements in classification shown in (b), (b), (c), and (c), textural or spectral–textural approaches were found to more accurately capture the debris distribution visible in the original image. By inspecting (b) and (c), the spectral–textural approach provides improved results through elimination of extraneous or erroneously classified debris at the boundary of the identified debris zone. However, considering (b) was completed with ISODATA classification only, this method may provide adequate results by capturing the primary debris zone with less human interference.
4.2. NOAA aerial photo
The resampled NOAA aerial photo and overlain results of the extracted debris polyline are provided in for the three classification methods. Similar to the IKONOS results, textural ((c)) and spectral–textural ((d)) approaches perform better than spectral alone ((b)). Comparing (c) and (d), the spectral–textural approach is more accurate for debris zone mapping, as a significant area of lower debris density is identified in the lower right corner of (c), which visually does not appear to be part of the primary debris zone.
Figure 7. NOAA imagery and debris line results based on classification approach: (a) resampled NOAA photo (Source: NOAA 30-Aug-05); (b) spectral only; (c) textural only; (d) spectral–textural.
4.3. Debris boundary evaluation
One of the primary underlying validation issues for remote sensing damage assessment is the availability of appropriate validation data. This is caused, in part, because a major advantage of remote sensing imagery is that it is captured immediately after an event when ground-based accessibility may not yet be possible. Although the authors possess detailed ground-based, georeferenced, high-definition video and still images within the study location, the collection of which was completed within two weeks of the landfall of Hurricane Katrina, it is uncertain in which ways the damage state was changed by inhabitants and response workers to restore accessibility and functionality to the area. Because of this temporal lag, ground-based datasets may not always be appropriate for remote sensing validation, especially for studies of debris, which would be quickly removed to restore accessibility to the area. Ground-based Lidar is similarly affected by accessibility issues, and aerial Lidar may hold the most promise for validation of remote sensing debris delineation; however, these data must be collected very proximate to the time of the imagery and optical data would also be needed to use in conjunction with the Lidar, as changes in elevation not associated with debris (e.g., sediment transport) are possible, thus necessitating the use of remote sensing imagery, in one form or another, for validation of the assessment derived from the same imagery. This issue is prevalent throughout remote sensing literature, and is one that deserves much more attention.
While these data were not available for this study, two alternative evaluation methods were utilized. The first compares the debris zones extracted from the different imagery types and the second compares the extracted debris zone to a visually identified debris line from previous research. (a) provides a comparison of the spectral–textural-classified debris zone extracted from IKONOS and NOAA imagery ((d) and (d)). The grey region in (a) was classified as “debris” with IKONOS data and “non-debris” with the NOAA photo (25501 pixels), and the black region was classified as “debris” with the NOAA photo and “non-debris” with IKONOS data (12425 pixels). The interior white region was classified as “debris” using both data sources (71787 pixels).
Figure 8. (a) Comparison of debris zone results obtained from spectral–textural classification approach for IKONOS and NOAA imagery (interior boundary = identified as debris from both data types; grey = identified as debris in IKONOS imagery but non-debris in NOAA imagery; black = identified as debris in NOAA imagery but non-debris in IKONOS imagery). (b) Extracted IKONOS spectral–textural classification debris line compared with manually interpreted results from Friedland et al. (Citation2011). Image source: DigitalGlobe 2-Sep-05.
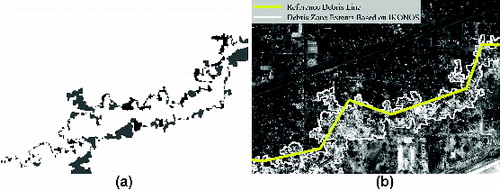
From (a), the results from both the IKONOS data and NOAA photo capture the main debris distribution, although there are differences on the debris zone boundary. Quantified measurements (pixels) of the extracted debris zones by imagery type and classification method are shown in . Spectral classification produced the largest debris zones for both imagery types, followed by texture and spectral–textural. NOAA data resulted in debris zones approximately 20% larger than IKONOS data for spectral and texture methods, but the NOAA spectral–textural debris zone was approximately 15% smaller than using IKONOS data. These results show that the proposed method provides similar results by data type, with spectral–textural methods resulting in the most streamlined primary debris zone. It is expected that both satellite and aerial imagery will provide adequate results for definition of the primary debris zone. Therefore, it is recommended that the most readily available or inexpensive imagery be utilized for future events. However, for very small study areas where the most accurate debris zone is desired, a trial-and-error process may be required to identify imagery types that result in the most accurate interpretations for distinct areas.
Table 3. Debris zone areas (measured in pixels) extracted using the three different classification methods for IKONOS and NOAA imagery.
Friedland et al. (Citation2011) previously used visual interpretation to manually define the inland extents of building debris (i.e., landward debris line). Based on this previous work, the available time to perform manual delineation, geographic extents of the study area, precision of the assessor, and other factors were found to significantly affect the results of manual debris line determination. To further evaluate the method proposed in this paper, the visually identified debris line is compared with the spectral–textural classification debris line extracted from IKONOS ((c)). (b) shows that the visually identified debris line roughly captures the furthest extent of debris, although it provides an overly simplified debris boundary. The debris line extracted using the proposed method provides much more detail relevant to the building level, while capturing both the seaward and landward debris line, providing a significantly improved understanding of the damage zones.
Image processing time is an important consideration for post-disaster response using remote sensing imagery. Although spectral–textural classification performed better than textural classification, textural classification performed very well in this study and is accomplished through unsupervised classification with less human interference that can be used to rapidly identify the debris class. While it is possible that textural classification may not provide ideal results for every study area, it is recommended that textural classification be completed first to determine whether adequate results can be achieved, especially for very large study areas. The image processing time of the proposed workflow is divided into two primary categories – image classification and debris zone extraction. Supervised image classification was found to take 20–40 minutes to classify one scene using a 64-bit Windows 7 computer with 2 cores and 2GB memory, while ISODATA classification takes approximately 5 minutes. There is manual work to pick up the suitable parameters for the post-classification debris zone and debris line extraction, and the time varies for different images, approximately 90–120 minutes. The approximate processing time for debris zone extraction for IKONOS data and NOAA photo is shown in . For large areas affected by a natural disaster, there are often many image tiles to process, and considerable speed up can be achieved by using parallel processing (Vijayaraj et al. Citation2008).
Table 4. Approximate processing time for debris zone extraction based on classification approach for case study image.
The proposed framework was developed using a general approach and therefore it is expected to perform well for debris zone mapping after other natural hazard events. Because the focus of this methodology is on the identification of primary debris zones, the debris itself should not be too scattered, as it is very challenging to accurately connect separate debris areas without introducing error if the distance between debris is too great. Further research is needed to investigate damage assessment at different scales (Ghosh et al. Citation2007; Vijayaraj et al. Citation2008; Friedland et al. Citation2011; Olsen et al. Citation2013) and larger study areas or more image tiles will be used in the future work in plan.
5. Conclusions
In this study, a rapid debris zone mapping framework was developed and demonstrated using IKONOS satellite and NOAA aerial imagery taken within four days of Hurricane Katrina's landfall. The framework consists of preliminary land cover classification, debris zone extraction, and evaluation of the extracted debris zone. The conclusions from this study are as follows:
Texture information calculated from post-hurricane images was effective for rapid debris classification, especially in combination with spectral bands. Overall, spectral–textural classification provided the most streamlined and accurate debris zone classification result, regardless of imagery type. However, spectral–textural classification requires supervised classification and additional user interference. Based on the case study, textural classification produced good results and is accomplished through unsupervised classification. For more automated assessment and large study areas where image processing time is an issue, use of textural classification may produce adequate results and should be investigated.
Majority/minority analysis and erosion and dilation morphological operations were useful in connecting non-contiguous debris areas, and then extracting the debris zone. The parameters for these processes were found to be image-dependent and best optimized using a trial-and-error approach.
Through visual comparison (1 m IKONOS versus resampled 1 m NOAA aerial imagery), the methodology generated similar results regardless of imagery type.
The mono-temporal approach demonstrated in this study can be used to rapidly process a large volume of remote sensing imagery for damage assessment without errors inherent in multi-temporal assessment.
Increasing coastal populations and projected increases in hurricane intensities and impacts will result in increased risk to life and property. The proposed methodology to rapidly and accurately identify debris zones has the potential to increase the efficiency and accuracy of damage assessment over large areas, which can speed disaster relief efforts and bolster further development of spatially tiered automated remote sensing damage assessment methodologies.
Acknowledgements
Dr. Timothy Andrew Joyner is gratefully acknowledged for review and valuable feedback that contributed to the completeness and clarity of the finished manuscript.
Additional information
Funding
References
- Abarca-Hernández F, Chica-Olmo M. 1999. Evaluation of geostatistical measures of radiometric spatial variability for lithologic discrimination in Landsat TM images. Photogramm Eng Remote Sensing. 65:705–711.
- Al-Khudhairy DHA, Caravaggi I, Glada S. 2005. Structural damage assessments from Ikonos data using change detection, object-oriented segmentation, and classification techniques. Photogramm Eng Remote Sensing. 71:825.
- Barnes CF, Fritz H, Yoo J. 2007. Hurricane disaster assessments with image-driven data mining in high-resolution satellite imagery. IEEE Trans Geosci Remote Sensing. 45:1631–1640.
- Battersby SE, Hodgson ME, Wang J. 2012. Spatial resolution imagery requirements for identifying structure damage in a hurricane disaster: a cognitive approach. Photogramm Eng Remote Sensing. 78:625–635.
- Bourgault G, Marcotte D. 1991. Multivariable variogram and its application to the linear model of coregionalization. Math Geol. 23:899–928.
- Butenuth M, Frey D, Nielsen AA, Skriver H. 2011. Infrastructure assessment for disaster management using multi-sensor and multi-temporal remote sensing imagery. Int J Remote Sensing. 32:8575–8594.
- Chen D, Stow DA, Gong P. 2004. Examining the effect of spatial resolution and texture window size on classification accuracy: an urban environment case. Int J Remote Sensing. 25:2177–2192.
- Chen Z, Hutchinson TC. 2007. Urban damage estimation using statistical processing of satellite images. J Comput Civil Eng. 21:187–199.
- Chen Z, Hutchinson TC. 2010. Probabilistic urban structural damage classification using bitemporal satellite images. Earthquake Spectra. 26:87–109.
- Chica-Olmo M, Abarca-Hernandez F. 2000. Computing geostatistical image texture for remotely sensed data classification. Comput Geosci. 26:373–383.
- Chih-Wei H, Chih-Jen L. 2002. A comparison of methods for multiclass support vector machines. IEEE Trans Neural Networks. 13:415–425.
- Ehlers M, Gähler M, Janowsky R. 2003. Automated analysis of ultra high resolution remote sensing data for biotope type mapping: new possibilities and challenges. ISPRS J Photogramm Remote Sensing. 57:315–326.
- Friedland CJ, Adams BJ, Levitan ML. 2007a. Remote sensing classification of hurricane storm surge structural damage. ASCE Structures Congress 2007. Long Beach (CA): American Society of Civil Engineers.
- Friedland CJ, Adams BJ, Levitan ML. 2007b. Results of neighborhood level analysis of structural storm surge damage to residential structures. Fifth International Workshop on Remote Sensing for Post-Disaster Response; 2007 Sep 10–12; Washington, DC.
- Friedland CJ, Massarra CC, Henderson E. 2011. Integrated aerial-based and ground-based damage assessment of single family dwellings at the neighborhood and per-building spatial scales. 9th International Workshop on Remote Sensing for Disaster Response; Stanford, CA.
- Fritz HM, Blount C, Sokoloski R, Singleton J, Fuggle A, McAdoo BG, Moore A, Grass C, Tate B. 2007. Hurricane Katrina storm surge distribution and field observations on the Mississippi Barrier Islands. Estuar Coast Shelf Sci. 74:12–20.
- Ghosh S, Adams BJ, Womble JA, Friedland C, Eguchi T. 2007. Deployment of remote sensing technology for multi-hazard post-Katrina damage assessment. Proceedings of the 2nd International Conference on Urban Disaster Reduction; Taipei, Taiwan.
- Guo H. 2010. Understanding global natural disasters and the role of earth observation. Int J Digital Earth. 3:221–230.
- Haralick RM, Sternberg SR, Zhuang X. 1987. Image analysis using mathematical morphology. IEEE Trans Pattern Anal Mach Intell. PAMI-9:532–550.
- Hussain E, Ural S, Kim K, Fu C-S, Shan J. 2011. Building extraction and rubble mapping for City Port-au-Prince post-2010 earthquake with GeoEye-1 imagery and Lidar data. Photogramm Eng Remote Sensing. 77:1011–1023.
- Hutchinson TC, Chen ZQ. 2005. Optimized estimated ground truth for object-based urban damage estimation using satellite images from the 2003 Bam, Iran, earthquake. Earthquake Spectra. 21:239–254.
- Ill EWR, Chappell DK, Baldwin DG. 1997. AVHRR imagery used to identify hurricane damage in a forested wetland of Louisiana. Photogramm Eng Remote Sensing. 63:293–297.
- Jensen JR. 2007. Remote sensing of the environment: an earth resource perspective 2/e. Upper Saddle River (NJ): Pearson Prentice Hall.
- Jin H, Li P, Cheng T, Song B. 2011. Land cover classification using CHRIS/PROBA images and multi-temporal texture. Int J Remote Sensing. 33:101–119.
- Karathanassi V, Iossifidis C, Rokos D. 2000. A texture-based classification method for classifying built areas according to their density. Int J Remote Sensing. 21:1807–1823.
- Kashani AG, Crawford PS, Biswas SK, Graettinger AJ, Grau D. 2014. Automated tornado damage assessment and wind speed estimation based on terrestrial laser scanning. J Comput Civil Eng. [Internet]. [cited 2014 Nov 10];1. DOI: 10.1061/(ASCE)CP.1943-5487.0000389
- Li H, Gu H, Han Y, Yang J. 2010. Object-oriented classification of high-resolution remote sensing imagery based on an improved colour structure code and a support vector machine. Int J Remote Sensing. 31:1453–1470.
- Li M, Cheng L, Gong J, Liu Y, Chen Z, Li F, Chen G, Chen D, Song X. 2008. Post-earthquake assessment of building damage degree using LiDAR data and imagery. Sci China Ser E Technol Sci. 51:133–143.
- Li P, Xiao X. 2007. Multispectral image segmentation by a multichannel watershed-based approach. Int J Remote Sensing. 28:4429–4452.
- Li P, Xu H, Song B. 2011. A novel method for urban road damage detection using very high resolution satellite imagery and road map. Photogramm Eng Remote Sensing. 77:1057–1066.
- Li P, Yu H, Cheng T. 2009. Lithologic mapping using ASTER imagery and multivariate texture. Can J Remote Sensing. 35:S117–S125.
- Li Y, van de Lindt JW. 2012. Loss-based formulation for multiple hazards with application to residential buildings. Eng Struct. 38:123–133.
- Liou Y-A, Kar SK, Chang L. 2010. Use of high-resolution FORMOSAT-2 satellite images for post-earthquake disaster assessment: a study following the 12 May 2008 Wenchuan earthquake. Int J Remote Sensing. 31:3355–3368.
- Melesse AM, Jordan JD. 2002. A comparison of fuzzy vs. augmented-ISODATA classification algorithms for cloud–shadow discrimination from Landsat images. Photogramm Eng Remote Sensing. 68:905–912.
- Olsen MJ, Chen Z, Hutchinson T, Kuester F. 2013. Optical techniques for multiscale damage assessment. Geomat Nat Hazards Risk. 4:49–70.
- Pesaresi M, Gerhardinger A, Haag F. 2007. Rapid damage assessment of built-up structures using VHR satellite data in tsunami-affected areas. Int J Remote Sensing. 28:3013–3036.
- Radhika S, Tamura Y, Matsui M. 2012. Use of post-storm images for automated tornado-borne debris path identification using texture-wavelet analysis. J Wind Eng Ind Aerodyn. 107–108:202–213.
- Soille P, Pesaresi M. 2002. Advances in mathematical morphology applied to geoscience and remote sensing. IEEE Trans Geosci Remote Sensing. 40:2042–2055.
- Szantoi Z, Malone S, Escobedo F, Misas O, Smith S, Dewitt B. 2012. A tool for rapid post-hurricane urban tree debris estimates using high resolution aerial imagery. Int J Appl Earth Obs Geoinf. 18:548–556.
- Taskin Kaya G, Musaoglu N, Ersoy OK. 2011. Damage assessment of 2010 Haiti earthquake with post-earthquake satellite image by support vector selection and adaptation. Photogramm Eng Remote Sensing. 77:1025–1035.
- Thompson BK, Escobedo FJ, Staudhammer CL, Matyas CJ, Qiu Y. 2011. Modeling hurricane-caused urban forest debris in Houston, Texas. Landsc Urban Plan. 101:286–297.
- Tralli DM, Blom RG, Zlotnicki V, Donnellan A, Evans DL. 2005. Satellite remote sensing of earthquake, volcano, flood, landslide and coastal inundation hazards. ISPRS J Photogramm Remote Sensing. 59:185–198.
- Vijayaraj V, Bright EA, Bhaduri BL. 2008. Rapid damage assessment from high resolution imagery. Geoscience and Remote Sensing Symposium, 2008. IGARSS 2008. IEEE International.
- Voigt S, Schneiderhan T, Twele A, Gähler M, Stein E, Mehl H. 2011. Rapid damage assessment and situation mapping: learning from the 2010 Haiti earthquake. Photogramm Eng Remote Sensing. 77:923–931.
- Wang F, Xu YJ. 2010. Comparison of remote sensing change detection techniques for assessing hurricane damage to forests. Environ Monit Assess. 162:311–326.
- Wang W, Qu JJ, Hao X, Liu Y, Stanturf JA. 2010. Post-hurricane forest damage assessment using satellite remote sensing. Agric For Meteorol. 150:122–132.
- Womble J, Ghosh S, Adams B, Friedland C. 2006. Advanced damage detection for Hurricane Katrina: integrating remote sensing and VIEWS field reconnaissance. Buffalo (NY): MCEER.
- Womble JA, Adams BJ, Ghosh S, Friedland CJ. 2008. Remote sensing and field reconnaissance for rapid damage detection in Hurricane Katrina. ASCE Structures Congress 2008. Vancouver, Canada: American Society of Civil Engineers.
- Yuan F, Sawaya KE, Loeffelholz BC, Bauer ME. 2005. Land cover classification and change analysis of the Twin Cities (Minnesota) metropolitan area by multitemporal Landsat remote sensing. Remote Sensing Environ. 98:317–328.
- Zhang J, Zhou C, Xu K, Watanabe M. 2002. Flood disaster monitoring and evaluation in China. Global Environ Change B Environ Hazards. 4:33–43.
- Zheng S, Cao CX, Zhang H, Gao MX, Xu M, Zhao J, Chen W, Li XW. 2011. Assessment of the degree of building damage caused by the 2010 Yushu, China earthquake using satellite and airborne data. Geomat Nat Hazards Risk. 2:141–157.