
Abstract
Disasters are the coincidences between hazardous events, elements at risk, and conditions of vulnerability. Vulnerability integrates social and environmental systems to reduce the intensity and frequency of these risks. By categorizing regions according to their level of vulnerability, one can examine and assess the possible impacts of developmental and environmental degradation processes. This study is an attempt to map the sub-national areas (districts) in India that are vulnerable to natural and climate-induced disasters. The assessment is considered under the framework of Intergovernmental Panel on Climate Change definition of vulnerability. Using analytical hierarchy process as a multi-criteria decision-mapping method, vulnerability is measured in terms of exposure, sensitivity, and adaptive capacity. Based on this mapping assessment, districts in the state of Arunachal Pradesh, Assam, Bihar, Himachal Pradesh, Jharkhand, Manipur, Meghalaya, Mizoram, Uttar Pradesh, Uttarakhand, and West Bengal are the most vulnerable regions; while districts in the state of Punjab, Haryana, Gujarat, Tamil Nadu, Maharashtra, Goa, Andhra Pradesh, Kerala, and Karnataka are among the least vulnerable regions. The results of this study can serve as the basis for targeting prioritization efforts, emergency response measures, and policy interventions at district level for mitigating disaster vulnerability in the country.
1. Introduction
Vulnerability is defined as the susceptibility of human and environmental systems that are likely to experience harm or damage from the exposure to stresses and from the absence of capacity to adapt (IPCC Citation2001; Adger Citation2006). Despite the advances in scientific research and literature, the measurement and classification of vulnerability are highly uncertain (Kates et al. Citation2001; Kasperson et al. Citation2003; Adger Citation2006; Eakin & Luers Citation2006). The major challenge of developing vulnerability indices is the requirement of data-sets from various fields (Hinkel Citation2011). Many vulnerability indices are based on the assumption of equal importance of the indicators of vulnerability (Eakin & Bojorquez-Tapia Citation2008). The most common method for quantifying vulnerability in the global change scenario is the use of composite proxy indicators (Kelly & Adger Citation2000; Moss et al. Citation2001). More recently, the concept of multi-dimensionality has been applied for analysing vulnerability (IPCC Citation2001; Luers et al. Citation2003; Turner et al. Citation2003). It is typically described as a function of three overlapping elements: (1) exposure (the shocks and stresses experienced by the system), (2) sensitivity (the response of the system), and (3) adaptive capacity (the capacity of the system for any kind of adaptive action). While increase in sensitivity and exposure increases the vulnerability, an increase in adaptive capacity will reduce the vulnerability of the system (O’Brien et al. Citation2004; Adger Citation2006; Smit & Wandel Citation2006).
Disaster vulnerability lies under the circumstances affecting the social and economic structures of the society (Morrow Citation1999; de Chazal et al. Citation2008; Maskrey Citation1989). Natural and climate-induced disasters are considered as the coincidences between hazardous events (such as earthquake, cyclones, floods, droughts, and sea-level rise), elements at risk (such as environmental, financial, and political systems), and conditions of vulnerability of any system (Maskrey Citation1989; Birkmann Citation2011). The susceptibility to the risk of any disaster invariably becomes higher when one or more natural hazards occur in a vulnerable region (Wisner & Luce Citation1993). Numerous frameworks, theories, and modelling techniques have been developed for assessing disaster vulnerability (Adger Citation2006; Eakin & Luers Citation2006; Gallopín Citation2006; Füssel Citation2007). The theoretical conceptualization of vulnerability assessments to identify disaster risk zones have often been used as the basis for pre-impact studies and mitigation planning strategies (O’Brien et al. Citation2004; Brooks et al. Citation2005; Cutter et al. Citation2008). Various sectors, such as agriculture (Lin et al. Citation2013), forests (Simonovich & Sharabi Citation2013), water resources (Propastin Citation2013), glaciers and snow covers (Wang et al. Citation2013), and coastal regions (Paul & Ismail Citation2013), have been projected to have several catastrophic impacts due to natural and climate-induced disasters. The severity of these impacts are further exacerbated by the current vulnerability of any region from single stressors (hazards) to multiple stressors (global change) (Helmer & Hilhorst Citation2006; O’Brien et al. Citation2006; Schipper & Pelling Citation2006; Van Aalst Citation2006). The distribution of these incidences, however, varies with the geography encompassed throughout the entire globe (Cutter et al. Citation2008). In addition to this, multi-dimensional assessments of such impacts also vary across at different levels and scales of assessments (O’Brien et al. Citation2004). Therefore, understanding the cumulative impacts at the sub-national and national level to natural and climate-induced disasters is essential to decipher the complex processes that address human rights and humanitarian development. The prior knowledge of vulnerability of the system and ways to increase its adaptive capacity would help in reducing the adverse risks due to disasters. In resource-constrained countries, disaster vulnerability assessments will help in identifying and enhancing the actions required for adaptation and mitigation strategies for the most vulnerable communities.
The long-term developmental processes in India would be greatly influenced by the frequency and magnitude of the occurrence of natural and climate-induced disasters. With a wide variety of physical and climatic features, the vast diversity in India leads to different disaster-prone scenarios in the country. Despite this fact, India is often criticized for its lack of disaster preparedness and response strategies (Özerdem & Jacoby Citation2006). One of the major reasons for such a conclusion is the inadequate database and community or sector-specific adaptation and mitigation strategies (Guha-Sapir et al. Citation2013). The identification and characterization of the vulnerable communities and sectors are essential for targeting and planning any policy intervention.
The analytic hierarchy process (AHP) has been widely used to solve a broad range of multi-criteria decision-making problems, with the pairwise comparison matrix calculating the weights for each criterion considered (Ying et al. Citation2007; Aghataher et al. Citation2008; Pourghasemi et al. Citation2012; Cozannet et al. Citation2013). The flexibility of using AHP over multi-criteria methods brings intuitive appeal to decide solutions for integrated processes, with the enhanced ability to check inconsistencies of each criterion considered to study environmental impacts (Ramanathan Citation2001). The uniqueness of applying AHP in different studies helps in modelling situations of uncertainty without losing subjectivity and objectivity of any evaluation measure. Such procedure-oriented methodology can easily incorporate tangible and non-tangible factors in making major policy decisions.
With the aim of examining disasters under the concept of vulnerability, this study is an attempt to map the sub-national areas (districts) in India that are vulnerable to natural and climate-induced disasters. Using AHP as a multi-criteria decision-mapping method, vulnerability measured in terms of exposure, sensitivity, and adaptive capacity was assessed for entire country at the sub-national level. The results of this study can serve as the basis for targeting prioritization efforts, emergency response measures, channelizing funds, and raising environmental concern and policy interventions at district level for mitigating disaster vulnerability in the country.
2. Study area
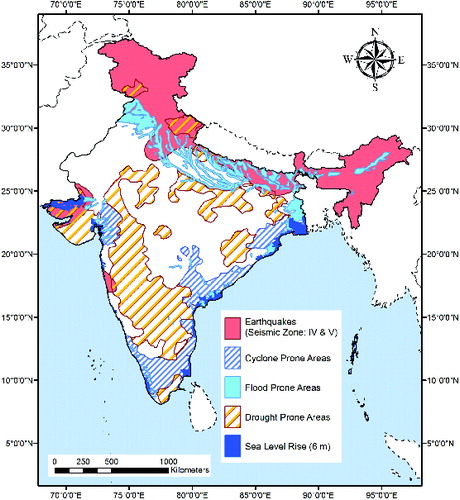
The disaster vulnerability was assessed for the entire region of India. Officially known as the Republic of India, India is a country in South-Asia, situated between 6°44′ and 37°30′ north latitude and 68°7′ and 97°25′ east longitude, covering an area of 3.3million sq. km. The country has a coastline measuring 7517 km in length; of this distance, 5423 km belongs to peninsular India and 2094 km to the Andaman, Nicobar, and Lakshadweep chain of islands. shows the vulnerable regions prone to natural and climate-induced disasters in the country.
Figure1. Location of the study area showing the natural and climate-induced disaster in the country.
3. Data and methodology
3.1. Data
The AHP was used to measure the vulnerability in terms of exposure, sensitivity, and adaptive capacity for the districts (Zilā) in India. As per the data available for the Census 2001, 594 districts in India were considered in the study. Five indicators were considered for each element. The disaster vulnerability assessment is based on the rankings across a number of composite indicators; each constructed using a different set of weights. The indicators considered for each element are as follows: (1) exposure (earthquake, cyclones, floods, droughts, and sea-level rise); (2) sensitivity (population density, marginal workers, forest cover, protected area, and net sown area); and (3) adaptive capacity (literacy rate, electricity availability, road facilities, communication facilities, and medical facilities). Since time immemorial, the Indian sub-continent has been exposed to many natural and climate-induced disasters. Around 57% of the Indian landmass is vulnerable to earthquakes (high seismic zones III–V), 28% is vulnerable to droughts, 12% is vulnerable to floods, and 8% is vulnerable to cyclones (Sinha Citation2003). Adding to this, the recent events of increase in the sea-level rise have damaged the human, social, and ecological resources in huge numbers. Major natural hazard and disaster, namely, earthquake, along with four climate-related risks, namely, cyclones, floods, droughts, and sea-level rise were considered as the best available proxies to predict future drastic disasters events. For computing sensitivity index, population sensitivity (indicators including marginal workers and population density) and ecological sensitivity (indicators including net sown area, forest cover, and protected areas) were considered to examine responsiveness to these disasters. To measure the adaptive capacity, indicators such as literacy rate, electricity availability, and facilities of health, communication, and accessibility (road networks) were considered.
The construction of the vulnerability profile requires explicit selection of indicators to assess vulnerability for each district in the country. In the area of vulnerability research, categorizing vulnerability of natural and climate-induced disasters requires an overall index from a suite of indicators to comprehend the underlying major cause of disaster vulnerability. The selection of indicators and the weights for each sub-indicator is, however, difficult considering the complex nature of vulnerability. Depending on the major causes of disaster vulnerability and availability of data, suitable indicators were selected. For this study, natural and climate-induced disasters (namely, earthquake, cyclones, floods, droughts, and sea-level rise), population and ecological sensitivity (namely, marginal workers, population density, net sown area, forest cover, and protected areas), and adaptive capacity measured in terms of literacy, electricity, health, and communication facilities, and accessibility to road networks were considered as indicators for exposure, sensitivity, and adaptive capacity, respectively. The details of the indicators considered for mapping disaster vulnerability for the associated database were acquired from the respective responsible agencies ().
Table 1. Vulnerability indicators used in the study.
3.2. Methodology
The approach of the study requires explicit selection of the indicator variables depicting the best available proxies of disastrous events. The indicators selected for each of these elements are essential variables for any kind of comprehensive vulnerability assessment. The composite vulnerability index approach was used to map the districts in India vulnerable to natural and climate-induced disasters. Vulnerability indices were calculated using data for each district in India. By aggregating the relative indices of exposure, sensitivity, and adaptive capacity, the cumulative composite vulnerability index has been calculated to categorize the highest and lowest vulnerable regions in India at the sub-national level (districts).
Using the indicators described in , the disaster vulnerability in India was assessed. Apart from the indicators selected for exposure, the spatial database was created for sensitivity and adaptive capacity for each district. The details of the sources of the data are mentioned in . Since each indicator was measured on different scales, dimension indices for each of the indicators for a district were calculated by normalizing the data using the following equation:
(1) where Index is the normalized value of an indicator, Xa is the actual value of the same indicator, and Xmin and Xmax are the minimum and maximum values, respectively, of the same indicator.
After normalizing all the indicators, each indicator of the respective element was assigned weights using the AHP. The AHP was used as a multi-criteria decision-making tool to develop priorities that best represent the respective element (exposure, sensitivity, and adaptive capacity). The AHP framework uses hierarchical structures to represent a problem and judgement alternatives for users by providing methodology to calibrate numeric scale for measuring the qualitative performances (Saaty Citation1980). The main steps involved in the AHP process are as follows: (1) defining the unstructured problem and developing the AHP hierarchy; (2) pairwise comparison of the criteria using Saaty's scale; (3) estimating the relative weights; (4) checking the consistency ratio (required threshold value of less than 0.1); and (5) generation of the resulting overall AHP indices. The pairwise comparison matrix for exposure, sensitivity, and adaptive capacity using the Saaty's scale of measurement (Saaty Citation2008) is shown in (a)–(c), respectively.
Table2. Pairwise comparison matrix using Saaty's scale of measurement (Saaty Citation2008).
The quantification of the disaster vulnerability was carried out with the method of multi-level weighted sum after the normalization of indicators representing each element. The normalized weighted values of the indicators were added to generate the three sub-indices of exposure, sensitivity, and adaptive capacity. In other words, the following formulations were used to generate the sub-indices (exposure, sensitivity, and adaptive capacity) of disaster vulnerability:
(2) where w is the weight of each indicator, u is the value of each indicator, and n is the total number of indicators, i = 1, 2, 3,…,n.
To obtain the final composite vulnerability index, these sub-indices were combined using the additive (averaging) approach. The equation for calculating the disaster vulnerability was as follows:
(3) where V, E, S, and AC represent vulnerability, exposure, sensitivity, and adaptive capacity, respectively.
The summarized sequential method used in this study for evaluating disaster vulnerability in India has been shown in .
Figure2. The sequential process in this study to map the disaster vulnerability.
4. Results
The indicators used in this study measure the vulnerability parameter intended to characterize the system. For this study, the system of interest includes the entire heterogeneous landscape of India. The scale of the study is at the sub-national level, which is represented by the districts in the country. The data on the spatial distribution of the indicators were used to explain the exposure, sensitivity, and adaptive capacity collectively for each district.
By combining the natural and climate-induced disasters, the overall exposure has been mapped for India. (a) depicts the inclusive exposure map showing the combination of natural (earthquakes) and climate-induced disasters (cyclones, floods, droughts, and sea-level rise). The map shows higher degrees of exposure in the districts located especially in the north-eastern part of the country. Many districts in other states including Arunachal Pradesh, Manipur, Meghalaya, Mizoram, and Nagaland in the north-eastern belt are also prone to extreme seismic events and flood-prone disasters. Along the northern and central part of the country, Jammu and Kashmir, Himachal Pradesh, Uttarakhand, parts of Punjab and Uttar Pradesh, the National Capital Territory (NCT) of Delhi, Bihar, West Bengal, and Kachchh district in Gujarat are more prone to events of incurring disasters, including the earthquake, drought, and flood-prone areas. Such instances of high exposure can be explained by the prevalence of earthquake as major natural hazard in these regions. The higher exposure could also be explained by the frequent climate-related occurrence of floods and droughts prolonging in these regions, especially in the Indo-Gangetic river basin. The relatively less-exposed districts lie mostly in the coastal region, in states including Gujarat, Maharashtra, Kerala, Tamil Nadu, Andhra Pradesh, Orissa, and West Bengal, with the lesser probability of natural and climate-induced disaster. The state of Orissa (districts including Baleshwar, Bhadrak, Ganjam, Jagatsinghapur, Kendrapara, and Puri) has suffered momentous losses over the decades to tropical cyclones; these vulnerable regions are clearly highlighted in the exposure map ((a)). Districts in West Bengal and Gujarat have the higher probabilities of area inundated as a result of rising sea-water level. The situation has been aggravated due to anthropogenic influences disturbing the ecological systems in these exposed regions. The district-level map shows comparatively lower exposure to disasters in the interior portions of the country, particularly in the states of Madhya Pradesh, Chhattisgarh, Jharkhand, Rajasthan, and parts of the Maharashtra, Karnataka, Punjab, and Haryana to natural and climate-induced disasters considered in this study.
Figure3. District-level mapping to disasters in India: (a) exposure, (b) sensitivity, and (c) adaptive capacity.
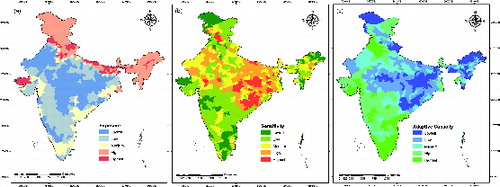
To measure sensitivity of the districts to the exposure of natural and climate-induced disasters, population sensitivity (indicators including marginal workers and population density), and ecological sensitivity (indicators best explaining the ecological sensitiveness including net sown area, forest cover, and protected areas) were considered to compute the sensitivity index. The presence of aggregated clusters of population, with large number of marginal workers, and the area covered by forests, or declared as a protected area, or the presence of irrigated/cultivated area, have been considered to measure the sensitivity of the districts in India to any possible natural and climate-induced disaster. (b) shows the sensitivity of the districts to external stresses and shocks. The regions more sensitive owing to high population ratios and ecologically fragile environments make the states Himachal Pradesh (districts including Bilaspur, Chamba, Hamirpur, Kangra, and Mandi), Chhattisgarh (districts including Baster, Jangir-Champa, Jashpur, Koriya, and Surguja), Jharkhand (districts including Garhwa, Giridih, Godda, Gumla, Lohardada, palamu, and Pashchimi Singhbhum), Madhya Pradesh (districts including Balaghat, Dindori, Mandla, Rajgarh, Seoni, and Umaria), Orissa (districts including Balangir, Bargarh, Baudh, Debagarh, Gajapati, Kalahandi, Kandhamal, Koraput, Malkangiri, Mayurbhanj, Nabarangapur, Naupada, and Rayagada), Uttar Pradesh (districts including Kushinagar, Maharajganj, Siddharthnagar), and West Bengal (majorly in Puruliya district) more sensitive to extreme events (disasters). Few districts in Nagaland, Gujarat, Rajasthan, and Jammu and Kashmir are also sensitive to exposed stresses of disasters. The foremost reason for such higher sensitivity would be the continuous increase in the number of marginal workers with rising population in most of these states. The economy is inextricably tied to the climate-sensitive sector, primarily agriculture, which is the most prevalent source of income in these regions. Any drastic event such as cyclones, floods, and droughts would hamper the agricultural productivity. This would directly or indirectly endanger livelihoods of communities dependent on it and the food security of the states. Interlinkages between different sectors would have a ripple effect on the entire economy. The impacts will be most felt on the vulnerable and poor sections of the society. The state of Tamil Nadu (except the districts sharing the coastal boundary) is comparatively less sensitive to changes in the system. The extreme north-western district in the state of Jammu and Kashmir also shows lower sensitivity; however, this might be due to no available data for this district in the state.
Based on the indicators that explain the ability of the districts to accommodate the changes due to natural and climate-induced disasters, (c) depicts the adaptive capacity across the districts in India. The indicators (road facilities, communication facilities, medical facilities, electricity availability, and literacy rate) help in developing the index for measuring the adaptive capacity at the sub-national level in the country. Although the exposure and sensitivity increase the vulnerability, showing a negative relationship; higher value and increase in adaptive capacity reduce the vulnerability of any system, indicating a positive relationship. The study indicates highest degree of adaptive capacity in all the districts in the state of Kerala. Other than this region, particularly in the Deccan Plateau, the states including Tamil Nadu, parts of Andhra Pradesh, Maharashtra, and Gujarat, along with districts in Punjab and Haryana are the least affected in terms of their capacity to adapt to external stresses. Lower adaptive capacity can be clearly seen in states in the central and eastern part of the country. States, such as Arunachal Pradesh (districts including Lower and Upper Subansiri), Jharkhand (districts including Chatra, Deoghar, Dumka, Garhwa, Giridih, Godda, Kodarma, Pakuar, Pashchiimi, and Purbi Singhbhum), Orissa (districts including Kandhamal and Malkangiri), Bihar (districts including Banka and Jamui), and Uttarakhand (districts including Garhwal, Tehri Garwal, Chamoli, Bageshwar, and Almora), have the least adaptive capacity to natural and climate-induced disasters. Few districts in the north-eastern part of the country also have lesser capacity to adapt disastrous events. The district-based accessibility due to paved roads and availability of facilities for transport, health, communication, electricity, and education majorly contribute in determining the adaptive capacity for each district. The social, technological, and infrastructural indicators would affect the sensitivity of the districts, either positively or negatively.
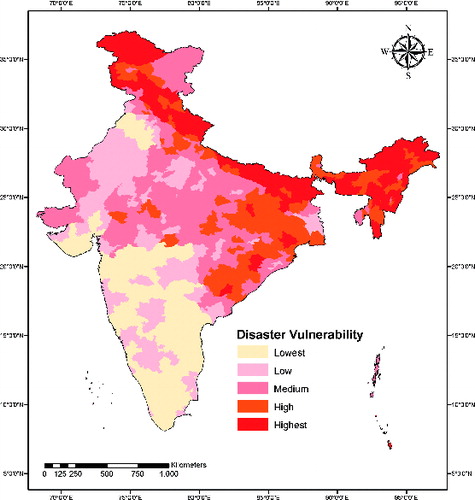
The disaster vulnerability mapping at the sub-national level (districts) was measured as a composite of exposure, sensitivity, and adaptive capacity across the entire regions in India. Districts are ranked and represented as quantiles of high and low vulnerability profiles. reflects the vulnerable regions in the country to natural and climate-induced disasters. Districts in the states of Arunachal Pradesh (Lower Subansiri, Upper Subansiri, and West Kameng), Assam (Dhemaji, Dibrugarh, and Karbi Anglong), Bihar (Araria, Banka, Darbhanga, Gopalganj, Jamui, Katihar, Kishanganj, Lakhisarai, Nalanda, Pashchim Champaran, Purnia, Saran, Siwan, Sitamarhi, Saarsa, and Supaul), Himachal Pradesh (Chamba, Mandi, and Solan), Jharkhand (Godda and Chandel), Manipur (Chandel and Churachandpur), Meghalaya (all the districts), Mizoram (Lawngtlai district), Uttar Pradesh (Balrampur, Kushinagar, Maharajganj, Shrawasti, and Siddarthnagar), Uttarakhand (districts including Bageshwar, Chamoli, Champawat, Garhwal, Tehri Garhwal, and Pithoragarh), and West Bengal (Dakshin Dinajpur district) are among the most vulnerable regions in India. While districts in the state of Punjab, Haryana, Gujarat, Tamil Nadu, Maharashtra, Goa, Andhra Pradesh, Kerala, and Karnataka are among the least vulnerable regions in the country. The districts in the state of Rajasthan, Madhya Pradesh, the union territories (NCT of Delhi, Chandigarh, Pondicherry, Daman and Diu, Dadra and Nagar Haveli), along with the chain of islands in Lakshadweep and Andaman and Nicobar show comparatively medium vulnerability to disasters and risk hazards in the country. shows the vulnerability of the districts in India to natural and climate-induced disasters.
Table3. District-wise disaster vulnerability in India.
Figure4. District-level mapping of disaster vulnerability in India, measured as a composite of exposure, sensitivity, and adaptive capacity indices.
5. Discussion
In a country, such as India, with the rising population to about one billion people, declining economic scenario, and changing climatic conditions, urgent necessity for better understanding of natural and climate-induced disasters and developmental processes would require an integrated approach to comprehensively assess the vulnerability of any region. The availability and accessibility in the database in terms of presence of heterogeneity in the scales of assessment make vulnerability mapping even more complicated (Preston et al. Citation2011). Despite such inconsistencies, vulnerability has been often studied for many fields including natural hazards, extreme rainfall, economic globalization, and climate change (Janssen et al. Citation2006).
Using multi-criteria decision-mapping methods, considerable research has been attempted to evaluate the risk of vulnerability in different systems. There are numerous examples of the use of AHP in mapping natural and climate-induced disasters. The AHP has been used for landslide hazard and susceptibility (Yoshimatsu & Abe Citation2006; Pourghasemi et al. Citation2012), soil erosion hazard (Rahman et al. Citation2009), earthquake hazard (Aghataher et al. Citation2008), flood hazard (Sinha et al. Citation2008), and coastal risks (Hu et al. Citation2009) mapping.
Many studies in India have attempted to map vulnerability across smaller regions in the country (O’Hare Citation2001; Roy & Venema Citation2002; Gaiha & Imai Citation2004; Brenkert & Malone Citation2005; Sanyal & Lu Citation2005; Kelkar et al. Citation2008; Rahman Citation2008; Singh et al. Citation2009). However, large-scale study for the entire nation was first attempted by O’Brien et al. (Citation2004) to map regional vulnerability to climate change primarily for the agriculture sector. The inclusion of disasters using multi-criteria decision-mapping method under the concept of vulnerability has not been yet attempted for India. In this study, the first attempts to map the vulnerability to natural and climate-induced disasters for the entire country at the sub-national (district) level are provided.
According to this study, the north-eastern part of the country is highly vulnerable to natural and climate-induced disasters. This region has always experienced many earthquakes; the north-eastern India is one among the major seismically active intra-continental regions of the world. Some of the examples include the Cachar earthquake in Assam and subsequent tremors in the vicinity of the district, and seismic activities near the Indo-Burma border showing consistent exposure to earthquakes (Gupta Citation1989). Earthquake incidences in Latur district in Maharashtra (Valdiya Citation1993) and Bhuj in the Kutch district of Gujarat (Rajendran et al. Citation2001) have also caused heavy losses to life and property in the western part of the country. The north-eastern India is also prone to frequent flooding in the Brahmaputra river basin. The river along with its tributaries causes recurrent devastating floods in the state of Assam almost every year. Nagaon district in Assam is the worst affected flood area suffering major losses and damages in the many villages near the Kopili and Brahmaputra rivers (Sharma et al. Citation2012). Many flood-prone and drought-prone areas have also been identified in the Indo-Gangetic basin. The recent and past events of flash floods and earthquakes in Uttarkashi and Garhwal district, Gaurikund, Rambara, and Kedarnath in Rudraprayag district, Alaknanda and Birahi valley in Chamoli districts of Uttarakhand (Dobhal et al. Citation2013; Gupta et al. Citation2013), flooding in Satluj catchment in Kinnaur district in Himachal Pradesh, Ludhiana, and Firozpur districts in Punjab (Sharma et al. Citation1996; Gupta & Sah Citation2008), the flood plains of Ganga and Brahmaputra river basins (Singh et al. Citation2009), Bhagmati and Kosi river basin flooding in the alluvial plains of north Bihar (Chandran et al. Citation2006), intense rainfall resulting in sudden flooding in many parts of Mumbai (Prasad & Singh Citation2005), high danger seismic-risk zones in northern India, particularly in the Himalaya belt (Valdiya Citation1993), some incidents of extreme seismicity in the Kangra district of Himachal Pradesh (Arya Citation1992) and Munger and Muzaffarpur districts of Bihar (Krishnan Citation1934) are examples showing the extreme vulnerability of these regions to natural and climate-induced disasters. The submerging coasts due to increase in the sea levels and cyclones in the Bay of Bengal have affected the eastern coasts of India and continue to rise from the past few decades (Tripati & Unnikrishnan Citation2011; Unnikrishnan et al. Citation2011). The eastern coast is prone to increase in the sea-water level, especially, the states including West Bengal, Odisha, and Andhra Pradesh show much area inundated due to the rising water level (Naik et al. Citation2013). With the increasing impacts of climate change, the rising sea levels would pose much threat to the coastal vulnerable areas in India.
With the help of using AHP as a tool for assessing disaster vulnerability, information from qualitative assessments can be converted to quantitative information by defining the weightages of various indicators in multi-criteria analysis. The consequences of identifying vulnerable regions to natural and climate-induced disasters by generating such a database would aid in pre-impact studies, contingency planning, and annual resource allocations with inclusion of ecological sensitivities, developing innovative projects including environmental impact assessments, planning and decision making for disaster management systems, and increasing skills sets of communities and various sectors to increase the adaptive capacity by infrastructure and urban planning (Clark et al. Citation2000; Turner et al. Citation2003; O’Brien et al. Citation2004; Brooks et al. Citation2005; IPCC Citation2007; Cutter et al. Citation2008).
6. Conclusion
From time immemorial, the Indian sub-continent has been exposed to natural disasters and more recently, higher magnitudes and frequencies of climate-induced disasters. This drastic increase in recent years poses serious threats to the overall development of the country. However, the driving forces behind these developmental processes in itself have contributed to the increase in susceptibility of any region to such extreme events. Lack of information and communication channel challenges in the progress of the entire country as a whole.
No single methodology will be able to capture completely the multi-scale and multi-faceted dimensions of vulnerability. Ultimately, the framework for analysing vulnerability would require various set of methods and modelling techniques to explain vulnerability characteristics within and between systems. Perhaps, the best probable results of vulnerability can be expected in scenarios when wide range of indicators are representing the system in consideration.
This study identifies the districts in India vulnerable to natural and climate-induced disasters. Since the districts have different levels of exposure, highest sensitivity does not always lead to highest disaster vulnerability, and the highest adaptive capacity does not always necessarily result in the lowest disaster vulnerability. The combined influence of the three elements of vulnerability (exposure, sensitivity, and adaptive capacity) was used to generate the composite vulnerability index for the country. The districts in the state of Arunachal Pradesh, Assam, Bihar, Himachal Pradesh, Jharkhand, Manipur, Meghalaya, Mizoram, Uttar Pradesh, Uttarakhand, and West Bengal are the most vulnerable regions in India. While districts in the state of Punjab, Haryana, Gujarat, Tamil Nadu, Maharashtra, Goa, Andhra Pradesh, Kerala, and Karnataka are among the least vulnerable regions in the country. The districts in the state of Rajasthan, Madhya Pradesh, the union territories (NCT of Delhi, Chandigarh, Pondicherry, Daman and Diu, and Dadra and Nagar Haveli), along with the chain of islands in Lakshadweep and Andaman and Nicobar show comparatively medium vulnerability to disasters and risk hazards in the country.
Such a database would help in creating policy intervention for the most critical regions in the country. The impacts of natural and climate-induced disasters continue to rise across the globe. Instead of dealing with disaster risks in isolation, management practices should integrate the social and environmental systems to reduce the intensity and frequency of these risks. The results of this study can serve as the basis for targeting prioritization efforts, emergency response measures, channelizing funds, and raising environmental concern and policy interventions at district level for mitigating disaster vulnerability in the country.
Acknowledgements
Authors are thankful to the anonymous reviewers for valuable suggestions. A. Chakraborty would like to acknowledge HSBC Climate Scholarship of TERI University for funding PhD research.
Related Research Data
References
- Adger WN. 2006. Vulnerability. Global Environ Change. 16:268–281.
- Aghataher R, Delavar MR, Nami MH, Samnay N. 2008. A fuzzy-AHP decision support system for evaluation of cities vulnerability against earthquakes. World Appl Sci J. 3:66–72.
- Arya AS. 1992. Possible effects of a major earthquake in Kangra region of Himachal Pradesh. Curr Sci. 62:251–256.
- Birkmann J. 2011. First-and second-order adaptation to natural hazards and extreme events in the context of climate change. Nat Hazard. 58:811–840.
- Brenkert AL, Malone EL. 2005. Modeling vulnerability and resilience to climate change: a case study of India and Indian states. Clim Change. 72:57–102.
- Brooks N, Neil Adger W, Mick Kelly P. 2005. The determinants of vulnerability and adaptive capacity at the national level and the implications for adaptation. Global Environ Change. 15:151–163.
- Chandran RV, Ramakrishnan D, Chowdary VM, Jeyaram A, Jha AM. 2006. Flood mapping and analysis using air-borne synthetic aperture radar: a case study of July 2004 flood in Baghmati river basin, Bihar. Curr Sci. 90:249–256.
- Clark WC, Jäger J, Corell R, Kasperson R, McCarthy JJ, Cash D, Cohen SJ, Desanker P, Dickson NM, Epstein P et al. 2000. Assessing vulnerability to global environmental risks. Discussion paper 2000–12, Environment and Natural Resources Program; Belfer Center for Science and International Affairs, Harvard Kennedy School, Cambridge (MA).
- Cozannet GL, Garcin M, Bulteau T, Mirgon C, Yates ML, Méndez M, Baills A, Idier D, Oliveros C. 2013. An AHP-derived method for mapping the physical vulnerability of coastal areas at regional scales. Nat Hazard Earth Syst Sci. 13:1209–1227.
- Cutter SL, Barnes L, Berry M, Burton C, Evans E, Tate E, Webb J. 2008. A place-based model for understanding community resilience to natural disasters. Global Environ Change. 18:598–606.
- De Chazal J, Quétier F, Lavorel S, Van Doorn A. 2008. Including multiple differing stakeholder values into vulnerability assessments of socio-ecological systems. Global Environ Change. 18: 508–520.
- Dobhal DP, Gupta AK, Mehta M, Khandelwal DD. 2013. Kedarnath disaster: facts and plausible causes. Curr Sci. 105: 171–174.
- Eakin H, Bojorquez-Tapia LA. 2008. Insights into the composition of household vulnerability from multicriteria decision analysis. Global Environ Change. 18:112–127.
- Eakin H, Luers AL. 2006. Assessing the vulnerability of social-environmental systems. Ann Rev EnvironResour. 31:365.
- Füssel HM. 2007. Vulnerability: a generally applicable conceptual framework for climate change research. Global Environ Change. 17:155–167.
- Gaiha R, Imai K. 2004. Vulnerability, shocks and persistence of poverty: estimates for semi-arid rural South India. Oxford Dev Stud. 32:261–281.
- Gallopín GC. 2006. Linkages between vulnerability, resilience, and adaptive capacity. Global Environ Change. 16:293–303.
- Guha-Sapir D, Santos I, Borde A. 2013. The economic impacts of natural disasters. New York (NY): Oxford University Press.
- Gupta HK. 1989. Patterns preceding major earthquakes in north-east India. Curr Sci. 64:889–893.
- Gupta V, Dobhal DP, Vaideswaran SC. 2013. August 2012 cloudburst and subsequent flash flood in the Asi Ganga, a tributary of the Bhagirathi river, Garhwal Himalaya, India. Curr Sci. 105, 249–253.
- Gupta V, Sah MP. 2008. Impact of the trans-Himalayan landslide lake outburst flood (LLOF) in the Satluj catchment, Himachal Pradesh, India. Nat Hazard. 45:379–390.
- Helmer M, Hilhorst D. 2006. Natural disasters and climate change. Disasters. 30:1–4.
- Hinkel J. 2011. Indicators of vulnerability and adaptive capacity: towards a clarification of the science-policy interface. Global Environ Change. 21:198–208.
- Hu B, Zhou J, Wang J, Chen Z, Wang D, Xu S. 2009. Risk assessment of land subsidence at Tianjin coastal area in China. Environ Earth Sci. 59:269–276.
- [IPCC] Intergovernmental Panel on Climate Change. 2001. Chapter 1, Overview of impacts, adaptation, and vulnerability to climate change. In: McCarthy JJ, Canziani OF, Leary NA, Dokken DJ, White KS, editors. Climate change 2001: impacts, adaptation & vulnerability: contribution of working group II to the third assessment report of the intergovernmental panel on climate change. Cambridge (UK): Cambridge University Press; p. 75–104.
- [IPCC] Intergovernmental Panel on Climate Change. 2007. Chapter 19, Assessing key vulnerabilities and the risk from climate change. In: Parry ML, Canziani OF, Palutikof JP, van der Linden PJ, Hanson CE, editors. Climate change 2007: impacts, adaptation and vulnerability. Contribution of working group II to the fourth assessment report of the intergovernmental panel on climate change. Cambridge (UK): Cambridge University Press; p. 779–810.
- Janssen MA, Schoon ML, Ke W, Börner K. 2006. Scholary networks on resilience, vulnerability and adaptation within the human dimensions of global environmental change. Global Environ Change. 16:240–252.
- Kasperson JX, Kasperson RE, Turner II BL, Schiller A, Hsieh WH. 2003. Vulnerability to global environmental change. In: Diekmann A, Dietz T, Jaeger C, Rosa ES, Editors. The human dimensions of global environmental change. Cambridge (MA): MIT.
- Kates RW, Clark WC, Corell R, Hall JM, Jaeger CC, Lowe I, McCarthy JJ, Schellnhuber HJ, Bolin B, Dickson NM, et al. 2001. Sustainability science. Science 292:641–642.
- Kelkar U, Narula KK, Sharma VP, Chandna U. 2008. Vulnerability and adaptation to climate variability and water stress in Uttarakhand State, India. Global Environ Change. 18: 564–574.
- Kelly PM, Adger WN. 2000. Theory and practice in assessing vulnerability to climate change and facilitating adaptation. Clim. Change. 47:325–352.
- Krishnan MS. 1934. The north Bihar Earthquake of the 15th January, 1934. Curr Sci. 2:323–326.
- Lin Y, Deng X, Jin Q. 2013. Economic effects of drought on agriculture in North China. Int J Disaster Risk Sci. 4:59–67.
- Luers AL, Lobell DB, Sklar LS, Addams CL, Matson PA. 2003. A method for quantifying vulnerability, applied to the agricultural system of the Yaqui Valley, Mexico. Global Environ Change. 13:255–267.
- Maskrey A. 1989. Disaster mitigation: a community based approach. Dev Guidel. 3:1–4.
- Morrow BH. 1999. Identifying and mapping community vulnerability. Disasters. 23:1–18.
- Moss RH, Brenkert AL, Malone EL. 2001. Vulnerability to climate change: a quantitative approach. Prepared for the US Department of Energy, Pacific Northwest National Laboratory (PNNL-SA-33642). Washington (DC): Battelle Institute.
- Naik BS, Panda RK, Jakhar P, Dass A, Madhu M. 2013. Appraisal of the erosion status in the eastern coastal region of India. Indian J Soil Conservation. 41:121–126.
- O’Brien G, O’Keefe P, Rose J, Wisner B. 2006. Climate change and disaster management. Disasters. 30:64–80.
- O’Brien K, Leichenko R, Kelkar U, Venema H, Aandahl G, Tompkins H, Javed A, Bhadwal S, Barg S, Nygaard L, West J. 2004. Mapping vulnerability to multiple stressors: climate change and globalization in India. Global Environ Change. 14:303–313.
- O’Hare G. 2001. Hurricane 07B in the Godavari Delta, Andhra Pradesh, India: vulnerability, mitigation and the spatial impact. Geogr J. 167:23–38.
- Özerdem A, Jacoby T. 2006. Disaster management and civil society: earthquake relief in Japan, Turkey and India. London: IB Tauris.
- Paul GC, Ismail AIM. 2013. Contribution of offshore islands in the prediction of water levels due to tide-surge interaction for the coastal region of Bangladesh. Nat Hazard. 65:13–25.
- Pourghasemi HR, Pradhan B, Gokceoglu C. 2012. Application of fuzzy logic and analytical hierarchy process (AHP) to landslide susceptibility mapping at Haraz watershed, Iran. Nat Hazard. 63:965–996.
- Prasad AK, Singh RP. 2005. Extreme rainfall event of July 25–27, 2005 over Mumbai, West Coast, India. J Indian Soc Remote Sensing. 33:365–370.
- Preston BL, Yuen EJ, Westaway RM. 2011. Putting vulnerability to climate change on the map: a review of approaches, benefits, and risks. Sustainability Sci. 6:177–202.
- Propastin P. 2013. Assessment of climate and human induced disaster risk over shared water resources in the Balkhash Lake drainage basin. In: Climate change and disaster risk management. Springer: Heidelberg; p. 41–54.
- Rahman A. 2008. A GIS based DRASTIC model for assessing groundwater vulnerability in shallow aquifer in Aligarh, India. Appl Geogr. 28:32–53.
- Rahman MR, Shi ZH, Chongfa C. 2009. Soil erosion hazard evaluation – an integrated use of remote sensing, GIS and statistical approaches with biophysical parameters towards management strategies. Ecol Modelling. 220:1724–1734.
- Rajendran K, Rajendran CP, Thakkar M, Tuttle MP. 2001. The 2001 Kutch (Bhuj) earthquake: coseismic surface features and their significance. Curr Sci. 80:1397–1405.
- Ramanathan R. 2001. A note on the use of the analytic hierarchy process for environmental impact assessment. J Environ Manage. 63:27–35.
- Roy M, Venema HD. 2002. Reducing risk and vulnerability to climate change in India: the capabilities approach. Gend Dev. 10:78–83.
- Saaty TL. 1980. The analytic hierarchy process: planning, priority setting, resources allocation. New York (NY): McGraw-Hill.
- Saaty TL. 2008. Decision making with the analytic hierarchy process. Int J Serv Sci. 1:83–98.
- Sanyal J, Lu XX. 2005. Remote sensing and GIS-based flood vulnerability assessment of human settlements: a case study of Gangetic West Bengal, India. Hydrol Process. 19:3699–3716.
- Schipper L, Pelling M. 2006. Disaster risk, climate change and international development: scope for, and challenges to, integration. Disasters. 30:19–38.
- Sharma PK, Chopra R, Verma VK, Thomas A. 1996. Technical note flood management using remote sensing technology: the Punjab (India) experience. Int J Remote Sensing. 17:3511–3521.
- Sharma SVSP, Rao GS, Bhanumurthy V. 2012. Development of village-wise flood risk index map using multi-temporal satellite data: a study of Nagaon district, Assam, India. Curr Sci. 103:705–711.
- Simonovich J, Sharabi M. 2013. Dealing with environmental disaster: the intervention of Community Emergency Teams (CET) in the 2010 Israeli forest fire disaster. J Sustainable Dev. 6:86–93.
- Singh RP, Kumar R, Tare V. 2009. Variability of soil wetness and its relation with floods over the Indian subcontinent. Can J Remote Sensing. 35:85–97.
- Sinha AK. 2003. Development of an integrated disaster management system in India: importance of reliable information. Paper presented at: The International Conference on Total Disaster Risk Management; Kobe. p. 2–4.
- Sinha R, Bapalu GV, Singh LK, Rath B. 2008. Flood risk analysis in the Kosi river basin, north Bihar using multi-parametric approach of analytical hierarchy process (AHP). J Indian Soc Remote Sensing. 36:335–349.
- Smit B, Wandel J. 2006. Adaptation, adaptive capacity and vulnerability. Global Environ Change. 16:282–292.
- Tripati S, Unnikrishnan AS. 2011. Role of cyclones and other factors in the decline of the ports of northern Orissa. Curr Sci. 100:305–312.
- Turner BL, Kasperson RE, Matson PA, McCarthy JJ, Corell RW, Christensen L, Eckley N, Kasperson JX, Luers A, Martello ML, et al. 2003. A framework for vulnerability analysis in sustainability science. Proc Nat Acad Sci. 100:8074–8079.
- Unnikrishnan AS, RameshKumar MR, Sindhu B. 2011. Tropical cyclones in the Bay of Bengal and extreme sea-level projections along the east coast of India in a future climate scenario. Curr Sci. 101:327–331.
- Valdiya KS. 1993. Latur earthquake of 30 September 1993: implications and planning for hazard-preparedness. Curr Sci. 65:515–517.
- Van Aalst MK. 2006. The impacts of climate change on the risk of natural disasters. Disasters. 30:5–18.
- Wang W, Liang T, Huang X, Feng Q, Xie H, Liu X, Chen M, Wang X. 2013. Early warning of snow-caused disasters in pastoral areas on the Tibetan Plateau. Nat Hazard Earth Sys Sci. 13:1411–1425.
- Wisner B, Luce HR. 1993. Disaster vulnerability: scale, power and daily life. GeoJournal. 30:127–140.
- Ying X, Zeng GM, Chen GQ, Tang L, Wang KL, Huang DY. 2007. Combining AHP with GIS in synthetic evaluation of eco-environment quality – a case study of Hunan Province, China. Ecol Modelling. 209:97–109.
- Yoshimatsu H, Abe S. 2006. A review of landslide hazards in Japan and assessment of their susceptibility using an analytical hierarchic process (AHP) method. Landslides. 3:149–158.