
Abstract
Landslide is considered as one of the most devastating and most costly natural hazards in highlands, which is triggered mainly by rainfalls or earthquakes. In comparison with other methods, landslide mapping and monitoring via remote sensing data products are considered as the least expensive method of data collection. The current research attempts to detect landslides which occurred due to a 6.9 magnitude earthquake in Sikkim Himalaya, India, on 18 September 2011 and also to establish the spatial relationship between landslides and the slope of the terrain. To detect the landslides, decision tree method was applied on two Indian remote sensing satellites linear imaging self-scanning sensor (LISS III) images acquired from 2007 and 2011 which were taken before and after the earthquake. As the study area was relatively huge for identifying the landslides, the region was separated into two parts: “tested study area” and “real study area”. The overall accuracy of landslide detection was 76%, and 75% for tested and real study area, respectively. Then, the spatial relationship between the landslides and the slope of the terrain was conducted using the digital elevation model. The results revealed that most of the landslides occurred between the slope of 25° and 45° covering 2.3 km2 and no landslide recorded in the slope of 65°–90° in the real study area. The results obtained in this study may be useful for decision-making and policy support towards reconstruction effort after the landslide occurrence. In addition, the information can be useful for reducing the risk of potential damages to substructures and properties by developing new and efficient strategies.
1. Introduction
Landslide is considered as a major natural hazard, making serious damages to lives and properties in all mountainous areas worldwide (Hervás et al. Citation2003; Althuwaynee et al. 2014a). They comprise widespread and significant type of geological risks, which requires huge amount of money for the damages they leave (Dai & Lee Citation2002; Singhroy & Molch Citation2004; Fourniadis et al. Citation2007; Huang Citation2009). Though the occurrence of landslides is inhibited and caused by a range of geological and geomorphological features, there might be some triggering factors, such as earthquakes and heavy rainfalls, in any area (Srivastava et al. Citation2010; Pourghasemi et al. 2013). Similar to other natural disasters, such as floods, earthquakes and avalanches, it is usually hard to predict the landslides (Tehrany et al. 2014). They are required to be recorded by mapping and other organized description procedures since they have potentially unknown harmful consequences (Pradhan et al. Citation2010; Tien Bui et al. 2012b). In order to have a better understanding of the nature of the terrain, it is required to monitor activities of the landslide and to predict the spatio-temporal slope failures (Van Westen et al. Citation2008; Sato & Harp Citation2009; Althuwaynee et al. 2014b). There are too many contributing factors involved in the formation of landslides such as geology, weather, wave actions, gravity and ground water (Iverson & Major Citation1987). Landslides often occur on the steep slopes; however, they may happen in the low slope areas (DeRose et al. Citation1991). Landslides might happen because of the failure of the river precipice, cut and fill problems that may be the consequence of the excavations of roads and buildings, failure of mine-waste heaps and gradient problems linked with quarries and open-pit mines (Swanson & Dyrness Citation1975). Underwater landslides, which occur under the water generally, happen in the regions with low relief and small gradients in lakes and reservoir areas or offshore maritime surroundings (Watts Citation1998).
In general, landslides happen when multiple numbers of the aforementioned factors occur at the same time. The natural aspects associated with landslides are gravity, geographical elements, heavy rainfalls, waves, jungle fire, volcanoes and earthquakes. Seismic activities are considered as the primary source of the landslides (Broothaerts et al. Citation2012). In addition, ashy waste flows caused by earthquakes may trigger massive soil movement. Furthermore, anthropogenic activities play an important role in initiation of the landslides. The causal mechanisms are complex interactions between seismic factors and morphology-related terrain factors, materials involved in the slope, hydrology, terrain use and geomorphology (Esposito et al. Citation2000; Sato & Harp Citation2009).
The Sikkim and adjacent area are well-known seismically active areas of the Alpine–Himalayan seismic belt in which four enormous earthquakes of scale of 8.0 and above happened in 2011. Earthquakes occurred in this area are generally linked with the pressure accumulation caused by the northward tectonic movement of the Indian Plate and consequent rapid release of it (De & Kayal Citation2003.). The steady resources of devastation of the possessions and detrimental effects on lives are the earthquake-induced landslides. In comparison with the other regions in Himalaya, Sikkim has been fairly an active seismic area in previous era. Some of the responsible factors for loss of life, infrastructures breakdowns and associated financial losses were stone falls, landslides and mudslides. The urgent priority after a landslide catastrophe is to perform relief and rescue procedures that are usually affected by lack of appropriate details about the location, size and the quantity of landslides in mountainous regions which are highly inaccessible (Chan & Huang Citation2012). Hence, rapid detection of landslides is indispensable for quick damage estimation and emergency reactions for the management activities of a catastrophe. Hence, current research aims to perform landslides detection for the part of the Sikkim Himalaya using advanced rule-based decision tree (DT) method.
2. Related work
Some of the main tools for landslide detections are the conventional techniques; for instance, visual analysis and perception of stereoscopic aerial photographs and field survey. However, in these traditional methods, the experience of the interpreter plays an important role. According to Metternicht et al. (Citation2005) and Tralli et al. (Citation2005), remote sensing (RS) technology provides detail information about landslides for policy-makers and emergency managers. Identifying and detecting of landslides by RS technology are based on three main features of the sensors: spatial, spectral and temporal resolutions (Gao Citation1999). The advancement of satellite technology and development of sensors have resulted many cutting edge technologies, such as interferometry (Kimura & Yamaguchi Citation2000; Lauknes et al. Citation2010; Cigna et al. Citation2011; Jebur et al. Citation2013b), differential interferometry (Guzzetti et al. Citation2009), change detection (Nichol & Wong Citation2005; Mondini et al. Citation2011; Al-shalabi et al. 2013; Tehrany et al. Citation2013b), image classification (Chang et al. Citation2007), digital terrain model differencing (Dewitte & Demoulin Citation2005) and object-oriented analysis (Martha et al. Citation2010a, Citation2010b; Stumpf & Kerle Citation2011), for landslide detection (Booth et al. Citation2009; Parker et al. Citation2011).
Generally, the visual analysis of space-borne imagery is appropriate for the detection of ground movements (Owen et al. Citation2008) such as estimation of fractures (Youssef et al. Citation2009) and preparation of landslide inventories. Among several supervised techniques for landslide detection, maximum likelihood classification (MLC) is the most commonly used method. Borghuis et al. (Citation2007) used a supervised MLC method to detect the typhoon-caused landslides in Taiwan. Non-parametric models are the other large category of supervised classifiers; for instance, linear discriminators, support vector machines (SVM), artificial neural networks (ANN) and random forests (Epanechnikov Citation1969). A comparison between MLC and ANN for landslide detection based on advanced space-borne thermal emission and reflection radiometer (ASTER) images showed that ANN outperformed the MLC (Danneels et al. Citation2007).
Generally speaking, for land use/cover (LULC) classification, unsupervised methods are preferable. Dymond et al. (Citation2006) used unsupervised classification for bright regions on gradients steeper than 50 in the Manawatu–Wanganui region of New Zealand. Nevertheless, landslides greater than 10,000 m2 was merely checked and there was no independent data-set for verification. Joyce et al. (Citation2008) tested eight different landslide-mapping methods using Satellite Pour l'Observation de la Terre (SPOT-5) imagery. The results showed that the semi-automated methods, such as spectral angle mapper, supervised classification and normalized difference vegetation index (NDVI) thresholding, were more precise than parallelepiped, principal components, multi-temporal image differencing and minimum distance. According to Joyce et al. (Citation2009), if change detection can be provided by the multi-temporal imagery of a designated area, it will be the most efficient approach for landslide mapping and monitoring. The change detection has been known for a long time for various applications such as LULC change assessment. In another paper, Cheng et al. (Citation2004) performed change-detection method by differencing the ratios of the band of IR and red channel SPOT images for landslide mapping. A threshold for change which was gained from the histogram of difference image was set manually. In order to eliminate the non-related changes to the landslides, a slope mask of 22° was used.
Nichol and Wong (Citation2005) studied a number of change-detection techniques for the detection of landslides, together with the elimination of single bands and ratios of the band and post-classification evaluations by means of neural network classifier and MLC. The results revealed that MLC outperformed other methods. Rau et al. (Citation2007)analysed a sequence of optical satellite imagery with the resolution of 19 days in terms of temporal resolution during 2.5 years. In their research, the CVA and NDVI were combined to detect the changes with experimental thresholding. This method was capable of monitoring three main typhoon-triggered landslides and the seasonal dynamics. The other important study in this field was done by Hervás et al. (Citation2003), in which the image differencing and automated thresholding methods were combined. This combination permitted to distinguish between change and no-change regions. In order to distinguish the landslide-active regions, they implemented a rectangular spot elimination technique on the threshold of difference image. Furthermore, this technique was useful for the long-lasting monitoring of landslides as well, particularly in case of availability of better spatial and temporal resolution data-sets.
Jebur et al. Citation(2013b) detected landslides using InSAR in tropical Malaysia. Although the proposed method decreased the work load and time, some weak points can be seen in the performance of InSAR to detect the landslides in dense vegetated regions. Another drawback of this method is the requirement of at least two pairs of SAR imageries for analysis which is not possible to be prepared in some data scarce areas. Based on the aforementioned literature, many methods exist to recognize the landslide locations, while each method has some drawbacks. Therefore, more accurate method needs to be established in order to detect these locations through more precise automatic or semi-automatic approaches. A DT is a mechanism to discover and describe the data structural patterns in the form of tree structures; it is not required to have a relationship between all the input variables and the goal variables in a DT. The DT can calculate information on various scales, with no prior assumptions needed on the incidence of the non-linear relationship of data distribution (Friedl & Brodley Citation1997; Pal & Mather Citation2003). The procedure of DT depends on training sites and input description which are generally defined by the user to form a set of rules identifying types of LULC derived from the values of description to allocate each pixel to a class (Pradhan Citation2013; Tien Bui et al. Citation2012a). In a recent paper, Pradhan Citation(2013) compared three different methods (i.e. DT, SVM and adaptive neuro-fuzzy inference system (ANFIS)) in prediction performance for landslide susceptibility mapping. By using these approaches, he produced 15 landslide susceptibility maps, which were then validated by landslides locations and the result of his study showed that landslide susceptibility mapping using DT, SVM and ANFIS is viable. The aim of the current research is to perform DT method to set the rules in order to detect the landslide locations through the semi-automated approach.
3. Study area
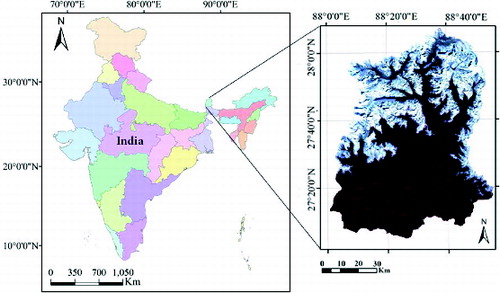
Sikkim is situated in the mountainous area in eastern Himalaya and it is located between 28° 07′48″ and 27°04′46″ north latitudes, and 88°00′58″ and 88°55′25″ east longitudes (. It is surrounded by Tibet from north side, Nepal from west side, Bhutan from the east side and West Bengal to its south side. Sikkim has a rectangular shape with 7,096 km2 of area, with 114 km and 64 km from North to South and from East to West, respectively. Sikkim is a significant state for India from defence strategic point of view.
Figure 1. Study area.
The climate of the region varies from tropical to alpine, as a result of variations in the topography and closeness of the state to tropics. From middle of the June till September, it is summer or monsoon and the rainfall level is between 130 cm and 430 cm at most. The highest and lowest temperature varies between 21ºC and 37ºC and between 13ºC and 23ºC, respectively. The historical earthquake data revealed that the Sikkim and its adjacent areas are affected by modest to immense earthquakes previously. Some of the most important earthquakes which had affected the region are:
Cachar earthquake of 10.01.1869 (M 7.5),
Shillong plateau earthquake of 12.06.1897 (M 8.7),
Dhubri earthquake of 02.07.1930 (M 7.1),
Bihar–Nepal border earthquake of 15.01.1934 (M 8.3),
Arunachal Pradesh–China border earthquake of 15.08.1950 (M 8.5) and
Nepal–India border earthquake of 21.08.1988 (M 6.4).
List of the earthquakes in Sikkim in most recent six years are:
14 February 2006 – Mana, North Sikkim (M 5.3),
18 May 2007 – Nambu, North Sikkim (M 4.6),
20 May 2007 – Singyang, North Sikkim (M 5.0),
18 September 2011 – Sikkim–Nepal border region (M 6.9) and
18 September 2012 – Sikkim (M 4.5).
A 6.9 magnitude earthquake occurred in Sikkim on 18 September 2011 at 12:40: 51 UTC. As stated by USGS, the epicentre of earthquake was positioned at 27.730°N and 88.155°E, close to the India–Nepal border, around 68 km, northwest (NW) of Gangtok and at a depth of 50 km. As a result of the earthquake, numerous landslides happened exactly from the Himalayan foothill area (e.g. Dudhia in Kurseong subdivision, Darjeeling district and West Bengal) to the upper area of the Himalayan region of the Sikkim–Darjeeling Himalayas. It was mentioned that the least number of people killed by earthquake was 111 and the majority of deaths happened in Sikkim.
4. Data used
One of the major factors in the analysis of probabilistic landslide mapping is the accurate detection of the landslides. According to Pradhan et al. (Citation2011), RS techniques, such as satellite imagery, assist to detect landslides in a cost- and time-effective way. The data used in this study for analysis were gathered in two different days. Indian RS satellites (IRS) linear imaging self-scanning sensor (LISS III) images which were taken from 23 December 2007 to 08 November 2011 were used in the current research. The efficiency of IRS LISS III data has been proven by various researches in landslide studies (Dimri et al. Citation2007; Chander et al. Citation2008; Mathew et al. Citation2009; Chauhan et al. Citation2010). Sarkar and Kanungo (Citation2004) have used this data in landslide detection. The other category of data used in this work was digital elevation model (DEM) acquired from ASTER with the spatial resolution of 30m which was taken on 17 November 2011. Furthermore, an image of Earth Observing-1 (EO-1) was taken after the earthquake to detect the exact location of the landslide through the visual interpretation in order to examine the detected landslide acquired from DT.
5. Methodology
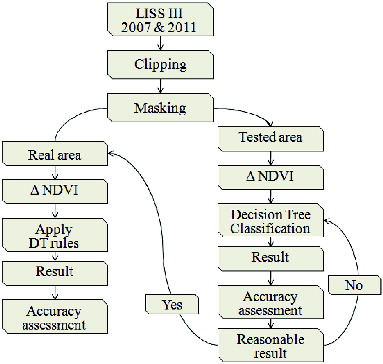
The landslide-detection analysis is one of the important steps in landslide management which is conducted by DT method. The practical and theoretical aspects of landslide mapping in this study involve several steps. The methodology, which was used in this study, is shown in .
Figure 2. Work flow of the methodology of this study.
DT is a strong rule-based method which is broadly used in data classification, predictive modelling and many more (Tien Bui et al. 2012b; Jebur et al. Citation2013a; Tehrany et al. Citation2013c). As it is asserted by Pal and Mather (Citation2003), DT is a substitute classification technique, which is located in the category of non-parametric and hierarchical classification. The tree is made by a root node, a set of internal nodes and a set of terminal nodes. Each node of the tree creates binary decision that separates the classes. This process continues and the tree moves down until the terminal node (Tehrany et al. Citation2013a). There are other important advantages of using this classifier: its ability of using different measurement scale data as well as its independency to former assumptions (Jebur et al. Citation2013a). Moreover, its procedure is much easier and understandable compared to other methods such as ANN. In a recent paper, Pradhan Citation2013 stated that the processing of DT depends on the user-defined input images and training sites to form a set of rules with the intention of determining the LULC category, derived from imagery values towards assigning a pixel to a class.
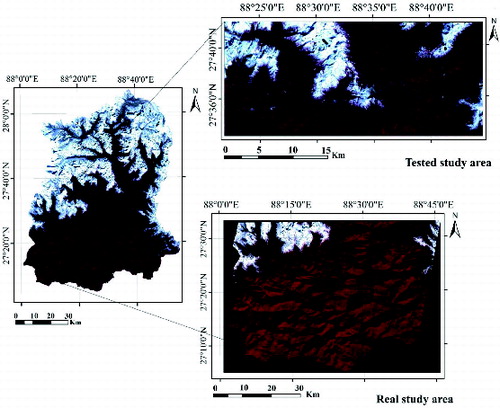
To begin, the study area was divided into two separate parts; the real study area and the tested study area (). The purpose was to generate the rules for the tested study area and transfer them to the real study area in order to examine the efficiency of the developed rules and selected method.
Figure 3. Tested and real study area.
Training sites were digitized in ENVI 4.8 software as small areas within images to be representative of some features in the study area. Within these training sites, each pixel was categorized into the specific classes such as vegetation, soil, etc. Assignment of each pixel to the appropriate class was made based on the analysis of the mentioned training sites, which were extracted from IRS (LISS III) imageries. These training sites were used to extract the spectral signature of each feature type in order to be used in defining the rules for each class. To build the DT rules, first B3 (red band in IRS (LISS III) imagery) was used to separate the snow area from whole study area which produced two branches of snow and non-snow (). The red band equalling to zero represented the class of snow and the remaining area was belonged to the non-snow class.
Figure 4. ΔNDVI for (a) tested study area and (b) real study area.
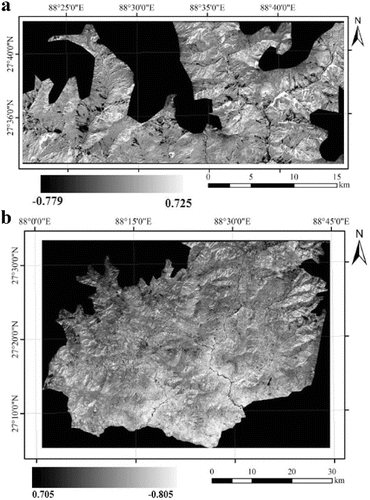
Figure 5. Statistical developed decision tree classification for the detection of landslides.
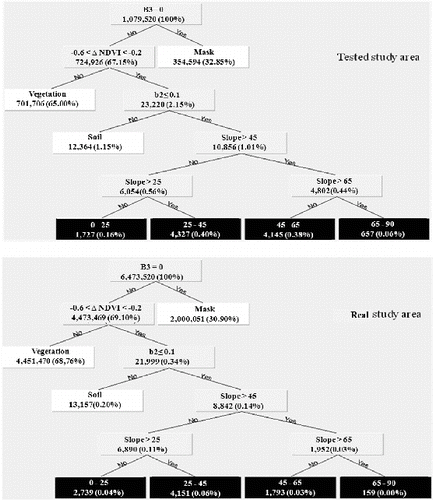
Subsequently, NDVI was calculated for both the images acquired from before and after the earthquake occurrence. NDVI is a specific tool that can separate vegetation from other classes precisely (van Leeuwen et al. Citation2006). The study area is predominantly covered by vegetation; consequently, this index is appropriate for processing of the data (Pettorelli et al. Citation2011). The purpose is to detect the landslide areas by measuring the ΔNDVI. When the landslide takes place in an area, the vegetation coverage will be moved and that area will be replaced by the soil, therefore the NDVI will be decreased. Hence, the difference between the measured NDVI will show the landslide locations. The NDVI can be measured using equation (1).
(1)
This index is considered to be the most used vegetation index (VI) and its values range from −1 to 1. The ΔNDVI was calculated using equation (2) and the results are shown in (Bradley & Mustard Citation2006; Pantaleoni et al. Citation2007).
(2)
Once the ΔNDVI was measured, the area was partitioned into two branches of vegetation and non-vegetation using this index. This non-vegetation area is made up by landslide areas and the class of soil. Therefore, B2 which is near infrared band was used to separate the soil from the landslide locations. The rule for this step was defined using the soil spectral signature which was acquired using the analysis of training sites. The remaining class was represented by the landslide area ().
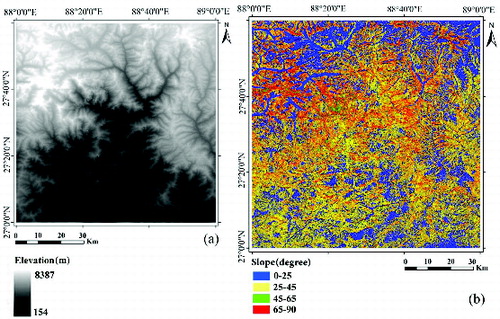
Slope is one of the most influential contributing factors in landslide occurrence, as the slope degree increases, the possibility of the landslide occurrence increases as well. Dai and Lee (Citation2002) stated that slope has a great effect on the landsliding. To realize the relation between landslides and the slope of the terrain, it is essential to consider the distribution of the slope categories using the available DEM. illustrates the DEM and the derived slope contributing factor in the current research.
Figure 6. (a) The elevation map and (b) the slope map of the study area.
Landslide locations were classified based on the various slope ranges; 0°–25°, 25°–45°, 45°–65° and 65°–90°. As it can be seen in the methodology work flow, first, all the processes were applied to the tested study area. The rules were modified until a reasonable accuracy was achieved. When the results for tested study area became acceptable, the same rules were applied to the real study area and subsequently the same process was carried out to obtain the results.
6. Results and discussion
6.1. Tested study area
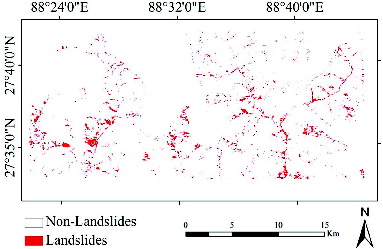
The generated rules were applied on the tested study area and the landslides spatial distribution map was produced by the DT model and is shown in . The three different views of landslide areas are shown in . The first one is representing the spatial distribution map created by DT model. The second view illustrates the captured image from LISS III and the third one shows the EO-1 captured image. Due to the precision of EO-1 imagery, the landside location can be seen clearly.
Figure 7. The spatial distribution of landslides.
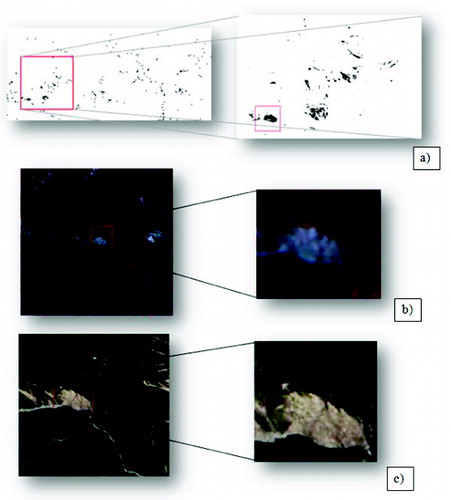
Figure 8. (a) Landslides detected by DT method; (b) the same area in LISS III image and (c) the same area in EO-1.
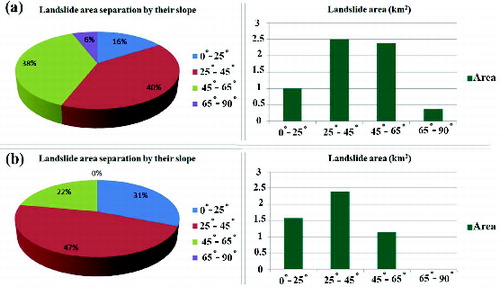
The relation between slope of the terrain and the landslides was determined through the classification of landslide locations based on the mentioned slope ranges. Results showed that about 16% of the landslides occurred in the terrain with slope of 0°–25° (i.e. 1 km2). The surface area of landslides occurred in the slopes of 25°–45° and 45°–65° were 2.5 km2 (40%) and 2.3 km2 (38%), respectively. According to as well as (a), 0.3 km2 of the landslides happened in the slope of terrain between 65° and 90°.
Table 1. The surface area and percentage of landslides by the slope separation in tested and real study area.
Figure 9. The area and percentage of landslides by the slope separation in (a) tested study area, (b) real study area and (c) full study area.
Validation was performed using confusion matrix and the kappa coefficient, overall accuracy, user accuracy and producer accuracy were measured. The numerical form of the results is shown in together with the graphical results in (a). The user and producer accuracy of vegetation were 77.8% and 84.0%, respectively. Moreover, the user and producer accuracy of soil were 75.9% and 62.9%, respectively. The landslide area producer accuracy was 76.6% with the user accuracy of 73.2%. Finally, the overall accuracy and kappa coefficient were 76.1% and 0.7, respectively.
Table 2. User accuracy, producer accuracy, overall accuracy and kappa coefficient for the results derived for tested and real study area.
Figure 10. Graph of the producer and user accuracy: (a) tested study area and (b) real study area.
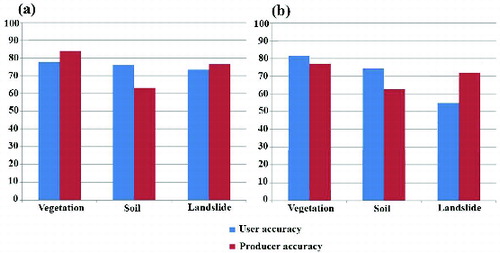
Based on the acquired accuracies, it can be seen that DT method was able to produce the highest accuracies for the class of vegetation, while low producer accuracy was obtained for the class of soil. Furthermore, landslide locations were classified with an acceptable accuracy which was the main goal of the current research.
6.2. Real study area
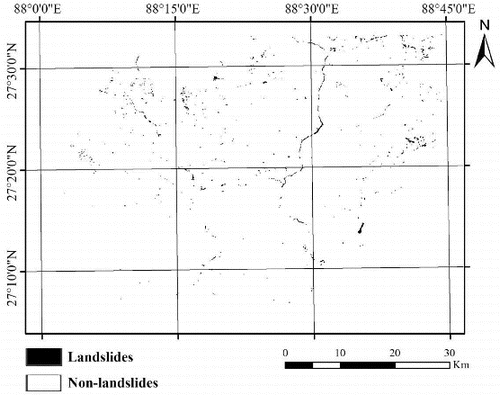
To detect the landslide locations in the real study area, same rules for tested study area were applied. The landslide spatial distribution map produced by DT in real study area is illustrated in . The same process was carried out to find out the relation between landslides and the slope of terrain in real study area and the result is shown in and
Figure 11. The spatial distribution of landslides in real study area.
The user accuracy and producer accuracy for vegetation were 81.4% and 80.2%, respectively. As it has been mentioned in the previous section, DT showed high precision in classifying the vegetation area. User and producer accuracy for soil were 74.6% and 71.3%, respectively. Landslide locations were classified by 68.1% and 72.9% user and producer accuracy, respectively. As shown in and (b), the kappa coefficient was 0.7 and the overall accuracy was 75.0%.
Similar to the tested study area, the relation between slope of the terrain and the landslides was determined. Results revealed that about 31% of the landslides occurred in the terrain with slope of 0°–25° (i.e. 1.5 km2). The surface area of landslides occurred in the slopes of 25°–45° and 45°–65° were 2.3 km2 (46.9%) and 1.1 km2 (22.1%), respectively. None of the landslides occurred in the terrain with slope between 65° and 90°. and (b) represent these relationships.
7. Conclusion
Valuable information can be achieved using landslide inventory maps which are essential requirement for variety of policy and decision-making. Providing the efficient and rapid landslide detection method is the most difficult challenges in such analysis, as the most of the methods are time consuming and costly. The main objective of this paper was to detect earthquake-induced landslides in Sikkim Himalaya, India, in 2011 by means of rule-based DT technique using IRS satellite images. The proposed method is an efficient rule-based method which has a flexible structure with reasonable performance. In order to detect the landslide location, multi-temporal images of IRS (LISS III) captured from 2007 (i.e. before earthquake) and 2011 (i.e. after earthquake) were used.
DT method was based on the defined rules which were acquired using the spectral signature of each feature. The study area was divided into two parts: tested study area and real study area. DT was performed and the rules were derived for the tested study area. The same rules were applied on the real study area in order to examine the efficiency of the DT method and transferability of the rules. It is the main requirement of natural hazard methods to be transferable from one study area to another, as the time has vital role in early warning and prevention actions. Landslide locations were detected in both study areas and the validation has been done using confusion matrix. The overall accuracies which were achieved form DT analysis for tested study area and real study area were 76.1% and 75.0%, respectively. In addition, the kappa coefficient for both tested and real study area was 0.7. Moreover, the results revealed that the area of landslides in tested area was 6.2 km2 and that of real area was 5.1 km2.
Using slope which was derived from DEM, the relationship between the landslide locations and slope was assessed. The rules of this analysis were defined using DT for both tested and real study areas. Results showed that the most (2.5 km2 (40%)) and the least (0.3 km2 (6%)) landslides occurred in the slopes of 25°–45° and 65°–90°, respectively, correspondingly in the tested study area. In comparison with the tested study area, most of the landslides took place in the area of 2.3 km2 (46.9%) between the slope of 25° and 45° and no landslides happened between the slope of 65° and 90° which showed the least occurrence of landslides in the real study area. The proposed method had some advantages such as quick performance with reasonable accuracy. Furthermore, it could establish the relationship between the landslides and the slope of the terrain. It is worth to mention that obtained results of this study could be used to decrease the risk of potential damages to substructures and properties by developing new and well-organized strategies. In addition, they are also helpful for policy supports and decision-making in reconstructions after the occurrence of a disaster.
Acknowledgements
The authors would like to thank the National Remote Sensing Center (NRSC), India for providing LISS 3 satellite data used in this study. They also thank the reviewers for their very useful comments which helped to improve the earlier version of the manuscript.
Related Research Data
References
- Al-shalabi M, Billa L, Pradhan B, Mansor S, Al-Sharif AA. 2013. Modelling urban growth evolution and land-use changes using GIS based cellular automata and SLEUTH models: the case of Sana’a metropolitan city, Yemen. Environ Earth Sci. 70:425–437.
- Althuwaynee OF, Pradhan B, Park HJ, Lee JH. 2014a. A novel ensemble bivariate statistical evidential belief function with knowledge-based analytical hierarchy process and multivariate statistical logistic regression for landslide susceptibility mapping. Catena. 114:21–36.
- Althuwaynee OF, Pradhan B, Park HJ, Lee JH. 2014b. A novel ensemble decision tree-based CHi-squared Automatic Interaction Detection (CHAID) and multivariate logistic regression models in landslide susceptibility mapping. Landslides. 1–16. doi:10.1007/s10346-014-0466-0
- Barlow J, Martin Y, Franklin SE. 2003. Detecting translational landslide scars using segmentation of Landsat ETM+ and DEM data in the northern Cascade Mountains, British Columbia. Can J Remote Sensing. 29:510–517.
- Booth AM, Roering JJ, Perron JT. 2009. Automated landslide mapping using spectral analysis and high-resolution topographic data: Puget Sound lowlands, Washington, and Portland Hills, Oregon. Geomorphology. 109:132–147.
- Borghuis AM, Chang K, Lee HY. 2007. Comparison between automated and manual mapping of typhoon-triggered landslides from SPOT5 imagery. Int J Remote Sens. 28:1843–1856.
- Bradley BA, Mustard JF. 2006. Characterizing the landscape dynamics of an invasive plant and risk of invasion using remote sensing. Ecol Appl. 16:1132–1147.
- Broothaerts N, Kissi E, Poesen J, Van Rompaey A, Getahun K, Van Ranst E, Diels J. 2012. Spatial patterns, causes and consequences of landslides in the Gilgel Gibe catchment, SW Ethiopia. Catena. 97:127–136.
- Chan SE, Huang P. 2012. When disasters are a part of home: the Hakka community's rootedness and resilience to periodic landslides in Shenmu village. Landscape Rev. 14:34–47.
- Chander G, Coan MJ, Scaramuzza PL. 2008. Evaluation and comparison of the IRS-P6 and the Landsat sensors. IEEE Trans Geosci Remote Sens. 46:209–221.
- Chang YL, Liang LS, Han CC, Fang JP, Liang WY, Chen KS. 2007. Multisource data fusion for landslide classification using generalized positive Boolean functions. IEEE Trans Geosci Remote Sens. 45:1697–1708.
- Chauhan S, Sharma M, Arora MK. 2010. Landslide susceptibility zonation of the Chamoli region, Garhwal Himalayas, using logistic regression model. Landslides. 7:411–423.
- Cheng KS, Wei C, Chang SC. 2004. Locating landslides using multi-temporal satellite images. Adv Space Res. 33:296–301.
- Cigna F, Del Ventisette C, Liguori V, Casagli N. 2011. Advanced radar-interpretation of InSAR time series for mapping and characterization of geological processes. Nat Hazards Earth Syst Sci. 11:865–881.
- Dai FC, Lee CF. 2002. Landslide characteristics and slope instability modeling using GIS, Lantau Island, Hong Kong. Geomorphology. 42:213–228.
- Danneels G, Pirard E, Havenith HB. 2007. Automatic landslide detection from remote sensing images using supervised classification methods. Geoscience and Remote Sensing Symposium; Barcelona, Spain. IGI4RSS.
- De R, Kayal JR. 2003. Seismotectonic model of the Sikkim Himalaya: constraint from microearthquake surveys. Bull Seismol Soc Am. 93:1395–1400.
- Derose RC, Trustrum NA, Blaschke PM. 1991. Geomorphic change implied by regolith—slope relationships on steepland hillslopes, Taranaki, New Zealand. Catena. 18:489–514.
- Dewitte O, Demoulin A. 2005. Morphometry and kinematics of landslides inferred from precise DTMs in West Belgium. Nat Hazards Earth Syst Sci. 5:259–265.
- Dimri S, Lakhera RC, Sati S. 2007. Fuzzy-based method for landslide hazard assessment in active seismic zone of Himalaya. Landslides. 4:101–111.
- Dymond JR, Ausseil AG, Shepherd JD, Buettner L. 2006. Validation of a region-wide model of landslide susceptibility in the Manawatu–Wanganui region of New Zealand. Geomorphology. 74:70–79.
- Epanechnikov VA. 1969. Non-parametric estimation of a multivariate probability density. Theory Probab Appl. 14:153–158.
- Esposito E, Porfido S, Simonelli AL, Mastrolorenzo G, Iaccarino G. 2000. Landslides and other surface effects induced by the 1997 Umbria-Marche seismic sequence. Eng Geol. 58:353–376.
- Fourniadis IG, Liu JG, Mason PJ. 2007. Landslide hazard assessment in the Three Gorges area, China, using ASTER imagery: Wushan–Badong. Geomorphology. 84:126–144.
- Friedl MA, Brodley CE. 1997. Decision tree classification of land cover from remotely sensed data. Remote Sens Environ. 61:399–409.
- Gao J. 1999. A comparative study on spatial and spectral resolutions of satellite data in mapping mangrove forests. Int J Remote Sens. 20:2823–2833.
- Guzzetti F, Manunta M, Ardizzone F, Pepe A, Cardinali M, Zeni G, Reichenbach P, Lanari R. 2009. Analysis of ground deformation detected using the SBASS-DInSAR technique in Umbria, Central Italy. Pure Appl Geophysics. 166:1425–1459.
- Hervás J, Barredo JI, Rosin PL, Pasuto A, Mantovani F, Silvano S. 2003. Monitoring landslides from optical remotely sensed imagery: the case history of Tessina landslide, Italy. Geomorphology. 54:63–75.
- Huang RQ. 2009. Some catastrophic landslides since the twentieth century in the southwest of China. Landslides. 6:69–81.
- Iverson RM, Major JJ. 1987. Rainfall, ground-water flow, and seasonal movement at minor creek landslide, northwestern California: physical interpretation of empirical relations. Geol Soc Am Bull. 99:579–594.
- Jebur MN, Pradhan B, Tehrany MS. 2013b. Detection of vertical slope movement in highly vegetated tropical area of Gunung pass landslide, Malaysia, using L-band InSAR technique. Geosci J. 18:61–68.
- Jebur MN, Shafri HZM, Pradhan B, Tehrany MS. 2013a. Per-pixel and object-oriented classification methods for mapping urban land cover extraction using SPOT 5 imagery. Geocarto Int. doi:10.1080/10106049.2013.768300
- Joyce KE, Belliss SE, Samsonov SV, McNeill SJ, Glassey PJ. 2009. A review of the status of satellite remote sensing and image processing techniques for mapping natural hazards and disasters. Prog Phys Geog. 33:183–207.
- Joyce KE, Dellow GD, Glassey PJ. 2008. Assessing image processing techniques for mapping landslides. IEEE International Geoscience and Remote Sensing Symposium; Boston, MA.
- Kimura H, Yamaguchi Y. 2000. Detection of landslide areas using satellite radar interferometry. Photogram Eng Remote Sensing. 66:337–344.
- Lauknes TR, Piyush Shanker A, Dehls JF, Zebker HA, Henderson IHC, Larsen Y. 2010. Detailed rockslide mapping in northern Norway with small baseline and persistent scatterer interferometric SAR time series methods. Remote Sens Environ. 114:2097–2109.
- Martha TR, Kerle N, Jetten V, Van Westen CJ, Kumar KV. 2010a. Characterising spectral, spatial and morphometric properties of landslides for semi-automatic detection using object-oriented methods. Geomorphology. 116:24–36.
- Martha TR, Kerle N, Jetten V, Van Westen CJ, Kumar KV. 2010b. Landslide volumetric analysis using cartosat-1-derived DEMs. IEEE Geosci Remote Sens Lett. 7:582–586.
- Mathew J, Jha VK, Rawat GS. 2009. Landslide susceptibility zonation mapping and its validation in part of Garhwal Lesser Himalaya, India, using binary logistic regression analysis and receiver operating characteristic curve method. Landslides. 6:17–26.
- Metternicht G, Hurni L, Gogu R, 2005. Remote sensing of landslides: an analysis of the potential contribution to geo-spatial systems for hazard assessment in mountainous environments. Remote Sens Environ. 98:284–303.
- Mondini AC, Chang KT, Yin HY. 2011. Combining multiple change detection indices for mapping landslides triggered by typhoons. Geomorphology. 134:440–451.
- Nichol J, Wong MS. 2005. Satellite remote sensing for detailed landslide inventories using change detection and image fusion. Int J Remote Sens. 26:1913–1926.
- Owen LA, Kamp U, Khattak GA, Harp EL, Keefer DK, Bauer MA. 2008. Landslides triggered by the 8 October 2005 Kashmir earthquake. Geomorphology. 94:1–9.
- Pal M, Mather PM. 2003. An assessment of the effectiveness of decision tree methods for land cover classification. Remote Sens Environ. 86:554–565.
- Pantaleoni E, Engel BA, Johannsen CJ. 2007. Identifying agricultural flood damage using Landsat imagery. Precis Agric. 8:27–36.
- Parker RN, Densmore AL, Rosser NJ, De Michele M, Li Y, Huang R, Whadcoat S, Petley DN. 2011. Mass wasting triggered by the 2008 Wenchuan earthquake is greater than orogenic growth. Nat Geosci. 4:449–452.
- Pettorelli N, Ryan S, Mueller T, Bunnefeld N, Jedrzejewska B, Lima M, Kausrud K. 2011. The normalized difference vegetation index (NDVI): unforeseen successes in animal ecology. Clim Res. 46:15–27.
- Pourghasemi H, Pradhan B, Gokceoglu C, Moezzi KD. 2013. A comparative assessment of prediction capabilities of Dempster–Shafer and weights-of-evidence models in landslide susceptibility mapping using GIS. Geomat, Nat Hazards and Risk. 4:93–118.
- Pradhan B, 2013. A comparative study on the predictive ability of the decision tree, support vector machine and neuro-fuzzy models in landslide susceptibility mapping using GIS. Comput Geosci. 51:350–365.
- Pradhan B, Mansor S, Pirasteh S, Buchroithner MF. 2011. Landslide hazard and risk analyses at a landslide prone catchment area using statistical based geospatial model. Int J Remote Sens. 32:4075–4087.
- Pradhan B, Oh HJ, Buchroithner M. 2010. Weights-of-evidence model applied to landslide susceptibility mapping in a tropical hilly area. Geomatics Nat Hazards Risk. 1:199–223.
- Rau JY, Chen LC, Liu JK, Wu TH. 2007. Dynamics monitoring and disaster assessment for watershed management using time-series satellite images. IEEE Trans Geosci Remote Sens. 45:1641–1649.
- Sarkar S, Kanungo DP. 2004. An integrated approach for landslide susceptibility mapping using remote sensing and GIS. Photogramm Eng Remote Sens. 70:617–626.
- Sato HP, Harp EL. 2009. Interpretation of earthquake-induced landslides triggered by the 12 May 2008, M7.9 Wenchuan earthquake in the Beichuan area, Sichuan Province, China using satellite imagery and Google Earth. Landslides. 6:153–159.
- Singhroy V, Molch K. 2004. Characterizing and monitoring rockslides from SAR techniques. Adv Space Res. 33:290–295.
- Srivastava V, Srivastava HB, Lakhera RC. 2010. Fuzzy gamma based geomatic modelling for landslide hazard susceptibility in a part of Tons river valley, northwest Himalaya, India. Geomatics Nat Hazards Risk. 1:225–242.
- Stumpf A, Kerle N. 2011. Object-oriented mapping of landslides using random forest. Remote Sens Environ. 115:2564–2577.
- Swanson FJ, Dyrness CT. 1975. Impact of clear-cutting and road construction on soil erosion by landslides in the western Cascade Range, Oregon. Geology. 3:393–396.
- Tehrany MS, Pradhan B, Jebu MN. 2013a. A comparative assessment between object and pixel-based classification approaches for land use/land cover mapping using SPOT 5 imagery. Geocarto Int. doi:10.1080/10106049.2013.768300
- Tehrany MS, Pradhan B, Jebu MN. 2013b. Remote sensing data reveals eco-environmental changes in urban areas of Klang valley, Malaysia: contribution from object based analysis. J Indian Soc Remote Sens. 41:981–991.
- Tehrany MS, Pradhan B, Jebu MN. 2013c. Spatial prediction of flood susceptible areas using rule based decision tree (DT) and a novel ensemble bivariate and multivariate statistical models in GIS. J Hydrol. 504:69–79.
- Tehrany MS, Pradhan B, Jebur MN. 2014. Flood susceptibility mapping using a novel ensemble weights-of-evidence and support vector machine models in GIS. J Hydrol. Available from: http://dx.doi.org/10.1016/j.jhydrol.2014.03.008.
- Tien Bui D, Pradhan B, Lofman O, Revhaug I, Dick OB. 2012a. Spatial prediction of landslide hazards in Hoa Binh province (Vietnam): a comparative assessment of the efficacy of evidential belief functions and fuzzy logic models. Catena. 96:28–40.
- Tien Bui D, Pradhan B, Lofman O, Revhaug I. 2012b. Landslide susceptibility assessment in vietnam using support vector machines, decision tree, and Naive Bayes Models. Math Probl Eng. 2012:1–26.
- Tralli DM, Blom RG, Zlotnicki V, Donnellan A, Evans DL. 2005. Satellite remote sensing of earthquake, volcano, flood, landslide and coastal inundation hazards. ISPRS J Photogramm Remote Sens. 59:185–198.
- van Leeuwen WJ, Orr BJ, Marsh SE, Herrmann SM. 2006. Multi-sensor NDVI data continuity: uncertainties and implications for vegetation monitoring applications. Remote Sens Environ. 100:67–81.
- Van Westen CJ, Castellanos E, Kuriakose SL. 2008. Spatial data for landslide susceptibility, hazard, and vulnerability assessment: an overview. Eng Geol. 102:112–131.
- Watts P. 1998. Wavemaker curves for tsunamis generated by underwater landslides. J Waterway Port Coastal Ocean Eng. 124:127–137.
- Youssef AM, Maerz NH, Hassan AM. 2009. Remote sensing applications to geological problems in Egypt: case study, slope instability investigation, Sharm El-Sheikh/Ras-Nasrani area, southern Sinai. Landslides. 6:353–360.