
Abstract
In the current study, Penang Island, which is one of the several mountainous areas in Malaysia that is often subjected to landslide hazard, was chosen for further investigation. A multi-criteria Evaluation and the spatial probability weighted approach and model builder was applied to map and analyse landslides in Penang Island. A set of automated algorithms was used to construct new essential geological and morphometric thematic maps from remote sensing data. The maps were ranked using the weighted probability spatial model based on their contribution to the landslide hazard. Results obtained showed that sites at an elevation of 100–300 m, with steep slopes of 10°–37° and slope direction (aspect) in the E and SE directions were areas of very high and high probability for the landslide occurrence; the total areas were 21.393 km2 (11.84%) and 58.690 km2 (32.48%), respectively. The obtained map was verified by comparing variogram models of the mapped and the occurred landslide locations and showed a strong correlation with the locations of occurred landslides, indicating that the proposed method can successfully predict the unpredictable landslide hazard. The method is time and cost effective and can be used as a reference for geological and geotechnical engineers.
1. Introduction
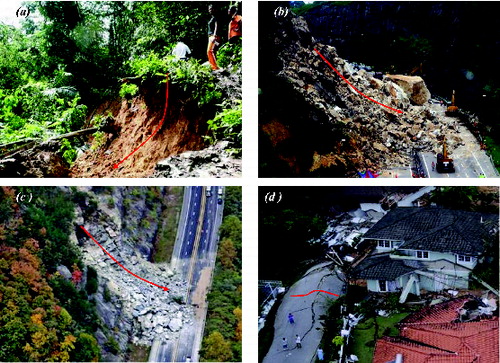
Malaysia is a tropical country with heavy and sometimes with non-stop heavy rainfall. The heavy rainfall creates landslides on steep and cutting slopes in mountainous areas and flash floods at low-lying areas in Penang Island (Jacobson et al. Citation1993). Landslides and flash floods hit various parts of Penang and have caused heavy traffic, while roads and highways have been cut-off for several days (Chan Citation1998) ().
Figure 1. Forms of landslides (a), rock and debris fall (b) and (c) and land creeping (d). These are due to soil saturation by rainfall and wrong slope artificial designs at highly fractured mountainous areas of Malaysia.
The weathering and urban development has led to decrease the vegetation cover and forest area at the mountainous area (Chan Citation1998). These have led to the increase in rock erosion and soil saturation by rainwater and occurrence of landslides. In other words, the urban development in the mountainous areas with heavy rainfall and steep slopes and wrong slope designs were found to be essential factors that cause the occurrence of landslides, while rainwater decelerating at low-lying areas with gentle slopes creates flash floods (Lee & Pradhan Citation2006; Dahal et al. Citation2008).
In such mountainous areas, the use of traditional techniques of mapping landslides is time and economic consuming (Chan Citation1998; Habibah et al. Citation2009). Thus, the integration of remote sensing and Geographic Information System (GIS) has been particularly proven as successful (Samy & Mohamed Citation2013).
The weighted probability spatial model (WSPM) and DEM data, particularly, were proven to be powerful tools in mapping geological and geomorphological features that are closely associated with the occurrence of landslides and rockfall, without direct field observations and measurements in remote and inaccessible locations and the knowledge of scientists in the previous similar works on groundwater potentiality and landslide susceptibility mapping (Vijith & Madhu Citation2007; Ettazarini Citation2007; Samy & Mohamed Citation2012).
These geomorphological and geological parameters are essential in landslide prediction and modelling on a regional scale (Nagarajan et al. Citation1998; Guzzetti et al. Citation1999; Van Westen Citation2000; Saha et al. Citation2005).
Several studies (Guzzetti et al. Citation1999; Akgün & Bulut Citation2007; Dahal et al. Citation2008) have been conducted for landslide susceptibility mapping using GIS and applied probabilistic models. Ohlmacher and Davis (Citation2003) applied the logistic regression model to landslide susceptibility mapping. Shou and Wang (Citation2003) and Zhou et al. (Citation2003) applied geotechnical and safety factor models indicate the landslide hazards. Other techniques (Lee Citation2007; Vijith & Madhu Citation2007) have been applied to landslide mapping and modelling using fuzzy logic, fuzzy algebraic operator and artificial neural network (ANN) and cross applied their weight for landslide susceptibility mapping to achieve reasonable prediction accuracy (81.36%).
Previous works (e.g. Pradhan & Lee Citation2007) conducted in the same study area showed that such landslide mapping was successful and able to accurately highlight the location of landslide occurrence. However, such works were based on a set of subjective model parameters. These parameters were extracted from optical remote sensing using visual interpretation. In addition, these works have been constructed based on geological and geomorphological maps lack to the accuracy and detailed information. Recently, Samy and Mohamed (Citation2012) assessed the natural hazard in Kuala Lumpur, Malaysia using remote sensing and GIS.
The present study considered the accuracy and details of the model parameters using a set of automated and semi-automated algorithms. In particular, the Spectral Angle Mapper (SAM) of Kruse et al. (Citation1993), topographic fabric algorithm of Guth (Citation1999), and the deterministic eight-node (D8) algorithm of Jenson and Domingue (Citation1988) were used to construct a new geospatial database and model parameters based on pixel calculations from different sensors. Then, these parameters were ranked and assessed using weighted spatial probability modelling (WSPM) to predict the occurrence of landslides in Penang Island, Malaysia. Spatial analysis, ranking and weighting, and representation of data are crucial in the natural hazard prediction. This study aimed to map landslide susceptibility and provided a more detailed geotechnical point of view of the major factors of the landslides which would permit better understanding of the natural hazards in Malaysia.
2. Study area
The study area is Penang Island, Malaysia. It is a part of Penang state measuring about 22 km by 14 km (306.842 km2). It stretches from latitude 5° 15″ N to 5° 31″ N and from longitude 100° 8″ E to 100° 21″ E ((a)). It is located on the north-western coast of Peninsular Malaysia and linked with the Penang state with a 13.5-km long bridge. The mountainous areas in the central, southern and northern parts are composed of weathered and fractured granite, while the low-lying areas in the eastern and western parts are covered with alluvial deposits (
Figure 2. RGB 742 LANDSAT TM image (a) and litho-structural map of the study area (b), showing the major rock in Penang is granite, which is covered by forest.
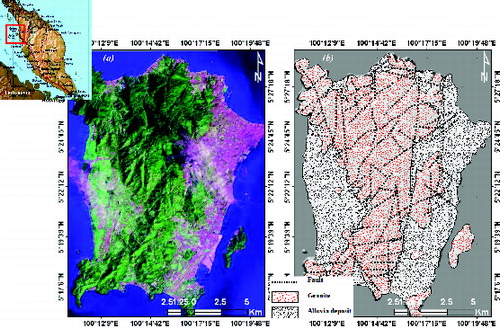
Figure 3. Flowchart of methodology used for landslide susceptibility mapping
A tremendous number of geological structures mark the mountainous areas. These features are tensional and wrench, with some low-lying both because of the regional shear stress that affects the study area and the successive tectonic events that occurred during the Silurian and Cretaceous periods SW. Their orientations are predominantly WNW–ESE, NNE–SSW, NW-SE and NE–SW ((b)) .
These features serve as channels for rainwater and increase the erosion of granite. The erosion of granite forms sand (quartz); clay and silt are accumulated in the fault zones and depressions and create landslides.
The relief ranges from complex in the mountainous area in the northern, central and southern parts to low lying and flat in the eastern and western parts of Penang Island (). The slope ranges from steep slope (>10°) at the mountainous areas to gentle slope (<3°) at low-lying areas (Habibah et al. Citation2009). The rainfall of the study area ranges from 2670 to 6240 mm. In tropical regions, rainfall is the main reason for landslide occurrence. The annual rainfall during two distinct wet events from September to December and from February to May per annum is ranging from 1500 to 3000 mm/year as reported by the Drainage and Irrigation Department of Malaysia.
The highest rainfall value is reported in the middle part (mountainous area) and considered favourable for landslide occurrence. The heavy rain area is located in the elevated areas in the middle part and received rainwater much more than the lowland area in the coastal area (east and west). For example, in the elevated areas rainfall rate reaches 3000 mm on mountainous areas, while it does exceed 1500 mm in the coastal area. At a higher elevation and steep slope, the rainwater accelerates and rock erosion increases, while at lower elevation the rainwater decelerates and sediment accumulation on steep slopes increases. The sediment accumulation on steep slopes increases the probability of landslide occurrence.
3. Data and methods
3.1. Data and preprocessing
The digital elevation mode (DEM) used in this study was resampled and fused with the Shuttle Radar Topographic Mission (SRTM) DEM (http://srtm.csi.cgiar.org/Index.asp) of ∼90 m spatial resolution and an Advanced Spaceborne Thermal Emission and Reflection Radiometer (ASTER) DEM (http://www.gdem.aster.ersdac.or.jp/search.jsp) of 30 m spatial resolution.
To enhance the quality of DEM, four steps were applied. In the first step, the original cell size (0.000834 in decimal degrees) of SRTM DEM should be 0.000278 and the bilinear interpolation had higher accuracy and was quite effective. In the second step, elevation data from topographic map (of scale 1:25,000) were used to provide a correction layer to reduce the height offset of the ASTER and SRTM DEM. In the third step, the artifacts in the DEMs were reduced by applying a 3 × 3 smooth filter (Hengl et al. Citation2003). In the fourth step, the enhanced DEMs were then merged using merge and filter DEMs tool that implemented in ArcGIS v.10 software.
3.2. Methods
3.2.1. GIS database and input layer construction
Prior to the weighted spatial probability modelling, it is important to construct accurate landslides causative parameters. A set of the model parameters and/or factors (that are very closely associated with landslide occurrence) was taken into consideration for the landslide analysis. In the landslide susceptibility mapping, the potential event and its probability of occurrence were combined. These factors were constructed from ancillary and remote sensing data using visual interpretation and automated algorithms (). The SAM algorithm (supervised classifier) was employed to map the urban development on mountainous areas and cutting a slope from 30 m spatial resolution Landsat ((a)). The deterministic eight-node (D8) algorithm of Jenson and Domingue (Citation1988), which is implemented in the ArcGIS v. 9.1 software was used to delineate stream network from DEM ((b)).
Figure 4. Land cover/use map generated from LANDSAT images (a), stream network drains Penang (b), showing the spatial association between the occurred landside locations (the white points) and the granite erosion by forest roots and stream network.
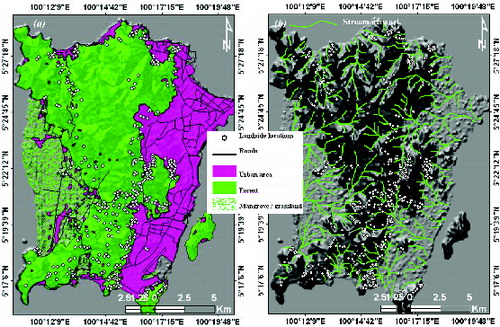
Figure 5. Slope (a), and aspect (b) maps calculated from DEM, showing the positive relationship between the slopes and the occurred landslide locations. Rose diagram shows that the common direction of escarpments and the occurred landslides is in NW–SE direction.
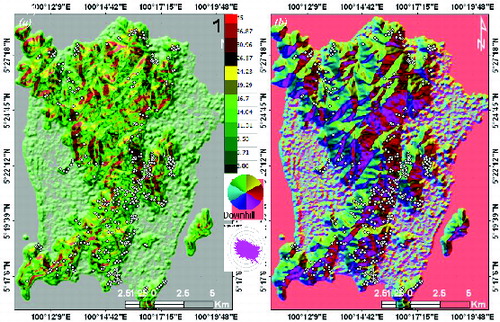
The maps of topographic slope ((a)) and aspect ((b)) were calculated from DEM. The maps of topographic slope, aspect and topographic relief ((a)) were used to extract fractures and fault zones based on the slope breaks and slope directions ((b)). Finally, the topographic relief was calculated from DEM using the ArcGIS v. 9.2 software. All landslide causative factors were converted to raster layers for the weighted spatial probability modelling as seen in the flowchart of the landslides susceptibility mapping ().
Figure 6. Relief map (a), and fault zones extracted from slope and aspect maps based on slope breaks and slope directions (b). The pink colour line highlights the regional fault zones that divide Penang into two parts and controls the direction of landslides. Rose diagram highlights the common directions of fault trends crosscutting the study area. White points highlight the known landslide locations.
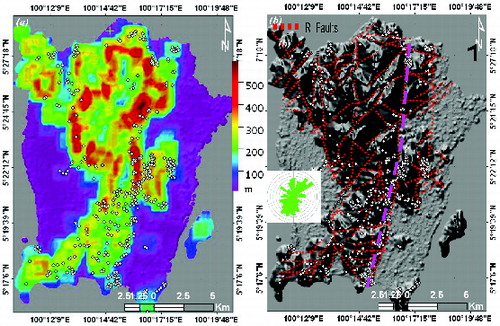
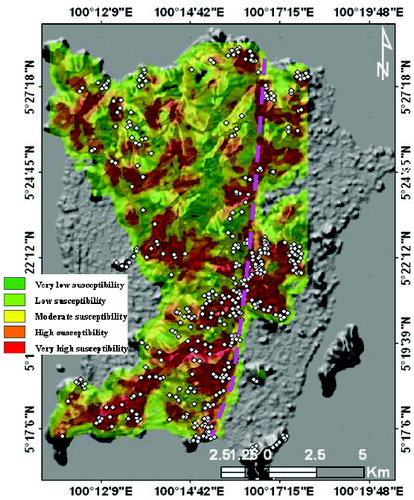
Figure 7. Landslide susceptibility map constructed using weighted spatial probability modelling. The map is draped over DEM. The white points highlight the known landslide locations. Most of the landslides are clustered along the NNE–SSW trending regional fault zone (pink colour).
3.2.2. Weight calculation
Not all landslide-related factors have the same influence on the landslide occurrence. For example, cutting slopes along hilly roads have much more effect than topographic relief and slope. In other talks, locations where landslides have not occurred and slope is flat were assigned a very low value of weight and rate of effectiveness, and locations where landslides have occurred were assigned a very high value for weight and rate of effectiveness (). Thus, each layer was assigned a weight and rate of effectiveness based on its level of contribution in landslide occurrence. Each landslide-related factor was classified into five classes from very high to very low.
Table 1. Ranks and weights for factors and their influencing classes used for landslides susceptibility mapping.
Suppose 100% as a maximum value for the rank; therefore, for the five class ranks will be categorized as 100%–80%, 80%–60%, 60%–40%, 40%–20% and 20%–0%, respectively. The average ranks will be as 90%, 70%, 50%, 30% and 10% in the WSPM. Cutting slopes along hilly roads were given the highest relative weight of 22% (0.22), while topographic slope was given the least weight of 18% (0.18).
To calculate the rate of effectiveness (rt) for each layer, the weight was multiplied by the rank (Wf × Rf). For instance, if the weight of land use and cutting slopes equals to 22%, and this is multiplied by the average rank of 90 (class I), the rate of effectiveness will be
(1)
In the present approach, the landslide susceptibility index was derived as the sum of the rate of effectiveness calculated to the landslide related factors and represented as follows:
(2) where LSI is landslide susceptibility, LCrt, Frt, Drt, Srt and Rrt are the rate of effectiveness of land cover, fracture intersections, drainage pattern, slope and relief, respectively.
The landslide-related factors were imported into the weight sum overlay that implemented in ArcGIS v. 9.2 software to produce a landslide susceptibility map.
4. Landslide susceptibility mapping and spatial analysis
Through WSPM, it was possible to observe that the high probability of the occurrences of landslide is mostly located in the areas where the slope is of wrong design and the density of stream networks and geological fractures intersected is higher. These areas are suited in areas at an elevation of 100–300 m with slope angle of 10°–37° and face mostly to the E and SE directions. Furthermore, most of the reported landslides were clustered along the NNE–SSW and NW–SE trending regional fault zones (valleys) crosscutting the southern part of Penang Island ().
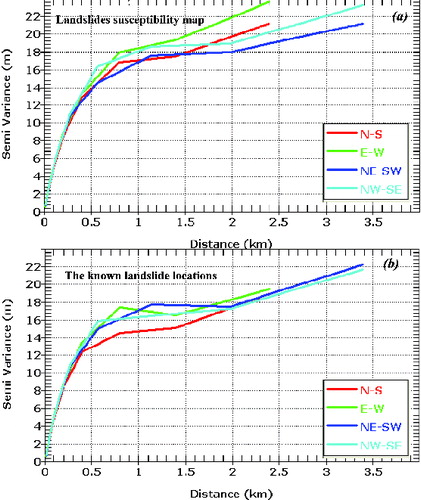
Figure 8. Semivariograms models in N–S, E–W, NE–SW and NW–SE directions. These were generated from the two grids; the first grid constructed from the landslide susceptibility map (a) with the second one of the known (b) landslide locations.
The areas having very high probability of landslide occurrence show an area of 21.393 km2 (11.84%), whereas the areas characterized by low susceptibility for the occurrence of natural hazard are approximately 16.017 km2 (8.86%) of the total Penang Island. However, the high landslides and rockfall susceptibility class occupies 58.690 km2 (32.48%), while the moderate landslides and rockfall susceptibility class occupies 53.57 km2 (29.65%) of the map, indicating the overall high and moderate landslide susceptibility of the Penang Island ( and ).
Table 2. Areas of landslide hazard classes (km2). Total granite area: 180.650 km2.
The zones of very high susceptibility for the occurrence of landslides are marked by the presence of intensive intersected fractures, wrong slope design and saturated bedrocks, while the zones of low susceptibility for the occurrence of landslides are marked by high stability of slope design, massive rocks.
Through the data processing and analysis, it was observed that the landslide occurrences in Penang Island are very strongly controlled by four parameters: (1) geological parameters such as major fault zones and geological fracture intersections, (2) hydrological parameters including intensive rainfall that exceeds 2700 mm, intensity stream network and shape and size of hydrological basins, (3) morphometric parameters including slope, aspect and relief shape, and (4) land use development on mountainous areas with wrong slope design.
The dentritic stream network reflects areas with steep slopes, low precipitation and high rate of rock erosion, while longitudinal streams reflect areas with gentle slopes, high precipitation and accumulation. These stream networks are often connected with fractured zones, which can serve as channels for rainwater downward movement and increase rock saturation. This rock saturation increases granite erosion and probability occurrence of rockfall and landslides, especially when the slope is greater than 10° (Gerasimov & Korzhuev Citation1979; Ollier Citation1981). Out of 407 landslides, 300 occurred within 200 m of the stream network.
On a steep slope, surface water accelerates and rock erosion increases, while on a lower slope surface flow decreases and sediment accumulation increases, and therefore, probability of landslide occurrence increases (Samy et al. Citation2012). The relationship between landslide occurrence and topographic slope and topographic relief shows that the areas with topographic slope above 11° and topographic relief of 400 m have a high frequency of landslide occurrence, indicating a higher probability of landslide occurrence. The spatial correlation also shows that there is an inverse relationship between distance to cutting slopes and farming areas and probability of landslide occurrence.
5. Verification
The landslide susceptibility map was validated using the known landslide locations. The validation was performed by constructing two grids (raster maps) of the known landslide locations and the landslide susceptibility map. The constructed grids were used to generate two semivariogram models (that are the key functions in geostatistics as it used to fit a model of the temporal/spatial correlation of the observed phenomenon). The resultant semivariogram models were used to correlate the landslide map with the occurred landslide locations. The four-directional semivariogram models for the occurred and the constructed landslides map show reasonable consistency (). Furthermore, a sill value, which defines the maximum value of the range, did not differ greatly between locations of the constructed map and the occurred landslides. All directional semivariogram models arise from an original point and continue to change at about 0.5 km with not much variation or dip in the curve with increasing distance. The NE–SW semivariogram rises a little more steeply in the known landslide, while the NW–SE values are comparatively reduced in the constructed landslide susceptibility map (). The variogram models for the constructed landslide map and the occurred landslide locations show positive correlation in the NW–SE, NE–SW and N–S directions with a little more steeply in the known landslides and difference in the E–W direction with root mean square errors (r2) varying from 0.75 to 0.81 (). The little difference between two grids due to the difference in the spatial resolution between aerial photographs that used to map the known landslide locations and the remote sensing data used to map the susceptibility of landslides.
Table 3. Linear fit of constructed known and predicted semivariogram models in the four directions.
6. Discussion
Prior to the result completed in this study, the precise mapping of landslide model parameters and the practical role of terrain parameters (e.g. slope, aspect and relief) on landslides occurrence in Malaysia had not been exercised in detail. Studies beyond the year 2005 (e.g. Pradhan & Lee Citation2007; Habibah et al. Citation2009) relied on the slide susceptibility mapping using parameters extracted visually. However, the influence of terrain parameters on landslides occurrence in these later studies is of limited investigation. The landslides in the Penang occur at highly fractured granite, zones with steep slopes, high relief and weathered granite. Weathering of granite rock by intensive rainwater on the wrong slope design appears to be a significant reason of landslide occurrence. The large amount of debris (sand and clay), creeping from the mountainous areas suggests chemical and mechanical weathering of granite (SiO2Al2O3K2ONa2O) by rainwater in the following reaction:
(3)
The proposed method uses essential geological, hydrological and morphometric maps such as stream network, geological linear structures that can be deduced from digital elevation models. Higher landslide hazard areas can be simulated and detected by studying the magnitude and contribution of essential factors to the landslide hazard.
The results of the study have permitted a better understanding of the spatial relationship between the occurrence of landslides and natural and anthropogenic factors. The analysis presented in the study shows the complexity of the landslides and the role of stream network and wrong slope design and terrain parameters in landslide occurrence in Malaysia for the first time. The produced map was tested against the occurred landslide locations to understand if the latter parameters in terms of topographical and structural control.
The proposed model based on a statistical criterion showed high precision with time and cost effectiveness. The resultant map is of great help for geotechnical engineers and urban planners for selecting suitable locations to employ developmental activities.
Future work will involve field measurement and the application of high resolution of SAR data (e.g. Phased Array L-band Synthetic Aperture Radar [PALSAR]) in order to extract more accurate model parameters. These data may enable the construction of more landslides hazard modelling of Penang Island.
7. Conclusions
In the current study, the integration of remote sensing, GIS and WSPM takes benefits from the computer-assisted computation of morphometric parameters and features (e.g. geological fractures, slope, aspect and stream patterns) to predict areas where landslide occurrences are higher. The landslides were mapped not only on the basis of WSPM but also on the spatial association between landslide hazard and geological, hydrological and morphometric parameters. The landslide susceptibility map is considered significant as it shows that the areas with higher landslide occurrences have strong agreement with the reported landslide locations, proving the ability of the proposed WSPM to predict the higher probability landslide hazard areas in Penang Island, Malaysia.
The study demonstrated that most of the landslide locations are clustered in the south-eastern and eastern parts of Penang Island due to tilting in elevation and slope under the influence of fault zone displacements. The study also demonstrated that the landslide response is controlled by five parameters: (1) geological structures on regional and small scale, (2) morphometric parameters such as slope, aspect and relief, (3) cut slope and land development such as wrong slope designs, (4) hydrological parameters in terms of intensive rainfall and stream networks and shape and size of drainage basins and (5) relief and topography. Sites of highly intensive geological fractures, heavy rainfall and wrong slope designs were very closely associated with landslide occurrences.
Acknowledgements
The authors are grateful to the anonymous reviewers and the Earth Remote Sensing Data Analysis Centre (ERSDAC) Japan, the NASA Land Processes Distributed Active Archive Center, the User Services USGS Earth Resources Observation and Science (EROS), and the Consortium for Spatial Information (CSI) of the Consultative Group for International Agricultural Research (CGIAR) for providing and distributing remotely sensed data.
Related Research Data
References
- Akgün A, Bulut F. 2007. GIS-based landslide susceptibility for Arsin-Yomra (Trabzon, North Turkey) region. Environ Geol. 51:1377–1387.
- Chan NW. 1998. Responding to landslide hazards in rapidly developing Malaysia: a case of economics versus environmental protection. Disaster Prev Manag. 7:14–27.
- Dahal RK, Hasegawa S, Nonomura S, Yamanaka M, Masuda T, Nishino K. 2008. GIS-based weights-of-evidence modelling of rainfall-induced landslides in small catchments for landslide susceptibility mapping. Environ Geol. 54:314–324.
- Elewa HH, Qaddah AA. 2010. Groundwater potentiality mapping in the Sinai Peninsula, Egypt, using remote sensing and GIS-watershed-based modeling. Hydrogeol J. 19:613–628.
- Ettazarini S. 2007. Groundwater potentiality index: a strategically conceived tool for water research in fractured aquifers. Environ Geol. 52:477–487.
- Gerasimov IP, Korzhuev SS, editors. 1979. Morphostructural analysis of the drainage network of the USSR. Moscow: Nauka. Russian.
- Guth PL. 1999. Quantifying topographic fabric: eigenvector analysis using digital elevation models. In: Merisko RJ, editor. 27th Applied Imagery Pattern Recognition (AIPR) Workshop: Advances In Computer-assisted Recognition; 1988 Oct 14–16; Washington (DC); p. 233–243.
- Guzzetti F, Carrarra A, Cardinali M, Reichenbach P. 1999. Landslide hazard evaluation: a review of current techniques and their application in a multi-scale study, Central Italy. Geomorphology. 31:181–216.
- Habibah LK, Younus AK, Fauziah A. 2009. Mechanism of shallow landslide at 3.9 Km Tun Sardon Road of Penang Island. Proceedings of the South China Sea Tsunami Workshop held at Universiti Sains Malaysia; Malaysia.
- Hengl T, David G, Rossiter F. 2003. Supervised landform classification to enhance and replace photo-interpretation in semi-detailed soil survey. Soil Sci Soc Am J. 67:1810–1822.
- Jacobson RB, Mcgeehin JP, Cron ED, Carr CE, Harper JM, Howard AD. 1993. Landslides triggered by the storm of November 3–5, 1985, Willis Mountain anticline, West Virginia and Virginia. US Geol Surv Bull. C1–C33.
- Jenson SK, Domingue JO. 1988. Extracting topographic structure from digital elevation model data for geographic information system analysis. Photogramm Eng Remote Sens. 54:1593–1600.
- Kruse FA, Lefkoff AB, Boardman JB, Heidebrecht KB, Shapiro AT, Barloon PJ, Goetz AFH. 1993. The Spectral Image Processing System (SIPS) - interactive visualization and analysis of imaging spectrometer data. Remote Sensing Environ. 44:145–163.
- Lee S, Pradhan B. 2006. Probabilistic landslide hazards and risk mapping on Penang Island, Malaysia. J Earth Syst Sci. 115:661–672.
- Lee S. 2007. Application and verification of fuzzy algebraic operators to landslide susceptibility mapping. Environ Geol. 52:615–623.
- Nagarajan R, Mukherjee A, Roy A, Khire MV. 1998. Temporal remote sensing data and GIS application in landslide hazard zonation of part of Western Ghat, India. Intern J Remote Sensing. 19:573–585.
- Ohlmacher GC, Davis JC. 2003. Using multiple logistic regression and GIS technology to predict landslide hazard in northeast Kansa, USA. Eng Geol. 69:331–343.
- Ollier C. 1981. Tectonics and landforms. London: Longman.
- Pradhan B, Lee S. 2007. Utilization of optical remote sensing data and GIS tools for regional landslide hazard analysis by using an artificial neural network model at Selangor, Malaysia. Earth Sci Front. 14:143–152.
- Saha AK, Gupta RP, Irene SI, Arora MK, Csaplovics E. 2005. An approach for GIS-based statistical landslide susceptibility zonation with a case study in the Himalayas. Landslides. 2:61–69.
- Shou KJ, Wang CF. 2003. Analysis of the Chiufengershan landslide triggered by the 1999 Chi-Chi earthquake in Taiwan. Eng Geol. 68:237–250.
- Samy IE, Shattri M, Bujang BK, Ahmad RM. 2012. Application of terrain analysis to the mapping and spatial pattern analysis of subsurface geological fractures of Kuala Lumpur Limestone Bedrock, Malaysia. Intern J Remote Sensing. 33:20.
- Samy IE, Mohamed M. 2012. Natural hazards susceptibility mapping in the Kuala Lumpur, Malaysia: an assessment using remote sensing and Geographic Information System (GIS). Geomatics Nat Hazards Risk J. 4:71–91.
- Samy IE, Mohamed M. 2013. Relationship between geological structures and groundwater flow and groundwater salinity in Al Jaww Plain, UAE; mapping and analysis by means of remote sensing and GIS. Arab J Geosci. 7:1249–1259.
- Van Westen CJ. 2000. The modelling of landslide hazards using GIS. Surv Geophys. 21:241–255.
- Vijith H, Madhu G. 2007. Application of Gis and frequency ratio model in mapping the potential surface failure sites in the Poonjar subwatershed of Meenachil river in western ghats of Kerala. J Indian Soc Remote Sensing. 35:275–285.
- Zhou G, Esaki T, Mitani Y, Xie M, Mori J. 2003. Spatial probabilistic modeling of slope failure using an integrated GIS Monte Carlo simulation approach. Eng Geol. 68:373–386.