
Abstract
Remote sensing can play a key role in risk assessment and management, especially when several concurrent factors coexist, such as a predisposition to natural disasters and the urban sprawl, spreading over highly vulnerable areas. In this context, multitemporal analysis can provide decision-makers with tools and information to reduce the impacts of disasters (e.g. flooding) and to encourage a sustainable development.
The present work focuses on the employment of multispectral satellite imagery to produce multitemporal land use/cover maps for the city of Dhaka, which is subject to frequent flooding events. In particular, the evaluation of the urban growth, the analysis of the annual dynamics of flooding and the study of the 2004 catastrophic event were performed.
For the change-detection procedure, Landsat images were used. These images allow the quantification of the very rapid growth of the metropolis, with an increase in built-up areas from 75 to 111 km2. The image of 2009 showed that an ordinary flood affects about 115 km2 (on a studied area of 591 km2). On the other hand, the analysis of the 2004 extreme flooding event, performed on a wider area, showed that the affected lands added up to 750 km2 (on about 3845 km2).
1. Introduction
Due to the increase in world population and the progressive development of national economies from merely agricultural systems, many cities have been undergoing a rapid and often uncontrolled growth. The conversion of arable land into urban areas, the destruction of habitats and the decrease of spontaneous vegetation cover are the main consequences of the urban sprawl. In the last few decades, land use/cover changes, due to human activities, occurred more rapidly in developing countries than in the developed world. Like other developing countries, Bangladesh has been experiencing rapid urbanization and Dhaka, its capital, is expected to grow by 2020 to more than 50 times its size in 1950 (UN-HABITAT Report Citation2006). In fact, in recent decades, a rapid increase in urban population has occurred in Dhaka, 1.4 million people in 1970, 6.6 in 1990 and 15.4 in 2011 (United Nations Citation2012). The rural–urban migration has significantly contributed to this growth; it is estimated that in 2020 Dhaka will have about 20 million inhabitants (UN-HABITAT Report Citation2006). Unfortunately, the absence of an appropriate urban planning has been further contributing to an urban sprawl, resulting in widespread environmental problems throughout the city. In particular, the increase in impervious surfaces, resulting from the rapid urbanization, has been exacerbating the impacts of water flows during the monsoon season, that affects Bangladesh from May to October.
According to the World Risk Report by the UNU-EHS Institute (Citation2011), Bangladesh is one of the 15 countries in the world with the highest natural risk, because of lives and properties losses caused by natural disasters with repeated frequency in short intervals. Almost every year natural disasters occur, such as floods, tropical cyclones, tornadoes, tidal waves, and their impact is compounded by deforestation, soil degradation and erosion. There are some main causes that make this area dangerously subject to flooding: lowlands that serve as detention basin (Bangladesh is located on an alluvial plain, therefore most of the country surface elevation is less than 12 m above sea level), the exposure to heavy monsoon rains mentioned above and the melting snow from the Himalayas.
In this context, the analyses of land use/cover changes by means of remote sensing data are an important tool for understanding the complex relationships between human activities and their environmental impacts. In fact, remote sensing allows the monitoring of ongoing phenomena, which otherwise will be difficult to assess on a large scale, by means of change detection techniques (Singh Citation1989). Indeed, remote sensing data are widely applied to provide land use/cover information such as the degradation level of forests (Hayes & Sader Citation2001) and wetlands, the evaluation of water resources (Frazier & Page Citation2000), the urbanization rate (Maktav et al. Citation2005; Dewan & Yamaguchi Citation2009; Bagan & Yamagata Citation2012), the intensity of agricultural activities and the cropland losses (Akbari et al. Citation2006) and other man-induced changes (Khan Citation2000). Thanks to the long period covered by the archive and the continuous periodical acquisition, the Landsat images are frequently used to map land use/cover and to detect land use/cover changes (Bagan et al. Citation2010; Xu et al. Citation2013). Their medium spatial resolution (pixel size 30 m) makes these images suitable for analyses on regional scale. Suitable imagery is also provided by ASTER (Advanced Spaceborne Thermal Emission and Reflection Radiometer) sensor (pixel size 15 m), on board the Terra satellite (Yüksel et al. Citation2008; Zhang et al. Citation2008). A typical limitation of optical images is the frequent presence of cloud cover, which reduces the number of meaningful scenes.
Among the change detection techniques, a post-classification comparison is a commonly used method for detecting land use/cover changes and it has been employed successfully in various areas (Yuan et al. Citation2005; Kilic et al. Citation2006). The post-classification approach, in fact, has two major advantages: first, it minimizes the impacts of atmospheric, sensor and environmental differences among multitemporal images, and second, it provides a complete matrix of change information (Lu et al. Citation2004). On the other hand, it requires a great amount of time to create the classification products for each date, moreover the final accuracy strictly depends on the quality of the products, closely resembling the product of the accuracies of each individual classification (Coppin et al. Citation2004). However, this technique was successfully used by several authors (e.g. Nirupama & Simonovic Citation2006; Zhang et al. Citation2008) to highlight relationships between land use change and environmental risk and to formulate recommendations, which may help the authorities in forming the conservation policies with respect to land use.
In this perspective, the present paper aims to provide a contribution to the development of risk assessment and mapping procedures, which can support urban planning and decision-making in respect to flooding events. The activity was conducted in collaboration with the non-profit organization ITHACA (Information Technology for Humanitarian Assistance, Cooperation and Action), which cooperates with the World Food Programme of United Nations, to support management and planning of the interventions in case of disasters (Ajmar et al. Citation2008; Boccardo & Tonolo Citation2008), and which provided data and contextualization for this study.
In particular, three different aspects have been investigated by means of classification and change detection analyses on multispectral Landsat and ASTER images:
the land use/cover changes from 2000 to 2009 with particular emphasis on the urban growth of the city of Dhaka;
the characterization of routinely flooded areas during an ordinary monsoon season;
the identification of those areas potentially affected by an extreme flooding event, like the one occurred in 2004.
2. The study areas
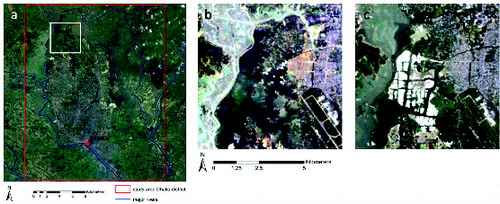
The study area, for the analysis of Dhaka urban growth and for the detection of ordinary flooded areas, is located in the centre of Bangladesh between 23°54′7″N, 90°18′28″E and 23°39′38″N, 90°31′32″E. It covers about 591 km2 (see ). This area is severely exposed to flooding risk, because of the already mentioned urban sprawl and its particular geomorphological setting. In fact, Dhaka is situated on an alluvial terrace, called Modhupur, and it is surrounded by the Tongi Canal to the north, the Buriganga River to the south, the Balu River to the east and the Turag River to the west. A marked monsoon season affects Dhaka from May to October. The surface elevation of this area ranges from 0.5 to 12 m; these low lands, which serve as detention basin, make the zone dangerously subject to flooding during monsoon rain events (Del Ninno et al. Citation2001; Dewan et al. Citation2005).
Figure 1. Location of the study area. Dhaka district (red polygon) and July 2004 flood study area (yellow polygon).
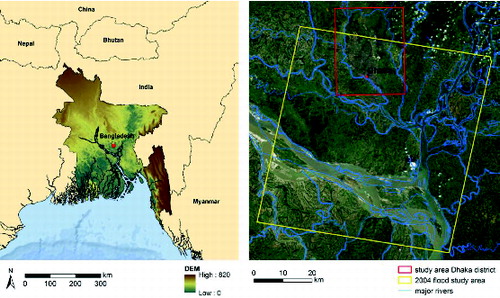
The analysis of the 2004 flood (Bangladesh Disaster & Emergency Response (DER) Sub-Group Citation2004) was conducted on a larger area, about 3845 km2, between 23°51′4″N, 90°12′6″E and 23°12′45″N, 90°39′41″E. This second study area extends between Dhaka and the confluence of the main branch of the Ganga River (called Padma in Bangladesh) and the Meghna River (see ).
3. Data and methodology
3.1. Data collection
The study is organized in three parts and it was conducted collecting three Landsat 5 L1T, four Landsat 7 L1T images and a ASTER L1A image (see ). In particular:
Table 1. List of the collected satellite images and their specific employment in the present work.
Table 2. Description of the informative classes adopted for land use/cover maps and training sites used for each classification.
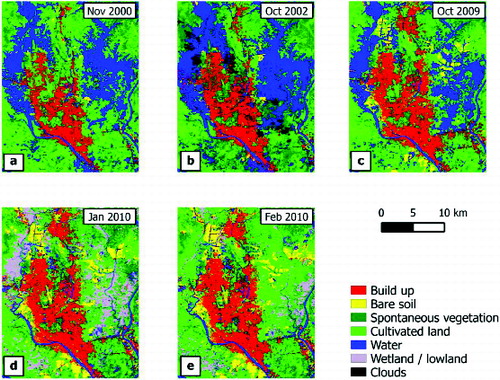
Three Landsat images of 2000, 2002 and 2009 were processed, in order to evaluate urban growth in Dhaka and resulting land use/cover changes. The study area is characterized by strong seasonality, therefore, among all the available scenes of Dhaka, those acquired in the same season (i.e. between October and November) were selected. The choice of this specific period was due to the availability of a time series with limited cloud cover.
The Landsat image of October 2009 was processed, in order to identify routinely flooded areas during the monsoon season; it was compared with two images of 2010, respectively of January and February, that show the territory three/four months after flooding.
The Landsat image acquired on 24 March 2003 and the ASTER image of October 2004 were processed, for the analysis of extreme July 2004 flooding event; the Landsat image was classified to provide a pre-event setting of water bodies and the ASTER image was processed to map the post-event situation after three months.
In addition, geospatial information provided by ITHACA was used; they include land use map, administrative subdivisions (Thana) and major rivers. These data, referred to the local geodetic system Everest_Adj_1937, were projected in the UTM-WGS 84 to allow the comparison with satellite images.
3.2. Image processing
The Landsat L1T products consist of geometrically corrected images, which are coherent each other, being orthorectified by the same data-set (GLS2000). The size of a Landsat scene is 170 km × 185 km, therefore all the images used for studying the urban growth in Dhaka and the routinely flooded areas were cropped.
The water extraction in the ASTER image was performed using the three visible and near infra-red (VNIR) bands and the five thermal infra-red (TIR) bands, which were subjected to radiometric calibration and normalization, respectively. The eight bands were orthorectified by the ENVI software using the ASTER global digital elevation map of Bangladesh and were resampled to 30 m by a bilinear interpolation. As long as reliable ground control points of sufficient accuracy were not available, an image-to-image registration was performed to ensure consistency with the Landsat data. For this purpose, 13 tie points were defined, reaching the root mean square error by 0.5 pixels, therefore an affine transformation was applied.
All the images were processed independently of each other using a maximum likelihood classification without any threshold, in order to produce land use/cover maps (see and 10). All the change-detection analyses were then performed in post-classification. It is widely recognized in literature that this approach has the advantage of minimizing the problem of radiometric calibration between dates (Coppin et al. Citation2004; Lu et al. Citation2004; Almutairi & Warner Citation2010). Moreover, as long as the training samples are derived only from the classified image itself, atmospheric correction is unnecessary (Song et al. Citation2001; Jianya et al. Citation2008). Therefore, for the Landsat images the classifier was applied directly to the 8-bit digital number. In addition, the thermal band of Landsat imagery was included in the classification process (cf. Akbari et al. Citation2006), because it was able to improve the separability of the classes in the investigated area, as demonstrated by the region of interest (ROI) separability indexes showed in and .
Table 3. Example of ROI separability indexes for the classification of Landsat image acquired on October 2009. For each class-row in the table, the first line reports the separability indexes using only the six TM multispectral bands, whereas the second line shows the same indexes computed on the six multispectral bands plus the thermal band 6.
Table 4. Land use/cover change matrix (km2) between the 2000 and 2009 TM image classifications.
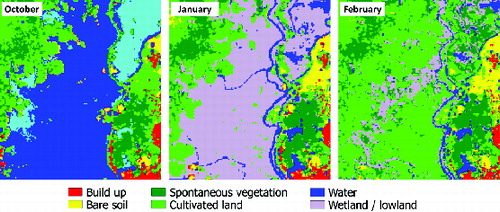
Figure 2. Multitemporal land use/cover maps of Dhaka: a, b, c maps were compared to quantify the urban growth; c, d, e maps were used to study the ordinary flood.
For the ASTER image, instead, before the classification the 8-bit VNIR bands were calibrated to top of atmosphere reflectance, while the 12-bit TIR bands were normalized in respect to the maximum value. Even if the physical meaning is not coherent, this pre-processing results in an 8-band stack, with digital numbers ranging between 0 and 1, and it improves the numerical stability of the classification algorithm.
Six basic informative classes were identified (see ) by photointerpretation, Build-up, Bare soil, Vegetation, Cultivated land, Water, Wetland/lowland. For each class in each image some training sites were selected, after a careful examination of spectral profiles and high-resolution images, to minimize the problem of mixed pixels. In the Landsat ETM+ image of October 2002, affected by cloud cover, the classes Cloud and Shadow Cloud were added. The cloud cover affects particularly the urban area, so the built-up areas were identified by classification an image of February 2002. The loss of information caused by clouds persists in the other cover types; anyway, this classification was used only for the urban sprawl analysis.
3.3. Accuracy assessment: map validation
Ground truth data were not available for the study area; therefore, a rigorous validation was not possible. However, for a first assessment of the classification accuracy, a number of checkpoints was identified on the Landsat images and their land cover class was verified by photointerpretation of high-resolution colour images (see ). In particular, for each class, about 100 ground truth points were selected and the confusion matrixes were compiled.
Figure 3. Ground truth points in January 2010 Landsat image; on the right, three examples extracted from the high-resolution images.
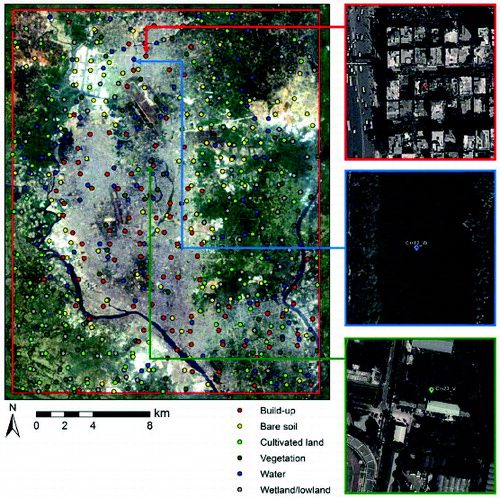
The high-resolution images have been available since 2001 and they have covered the entire study area only since 2004. Therefore, the validation has been possible only for the maps of October 2009, January 2010 and February 2010. For all these three classification an accuracy higher than 90% was achieved ( shows graphically the distribution of omission and commission errors for each class and for every classification).
Figure 4. Omission and commission errors for each class for the three validated classifications.
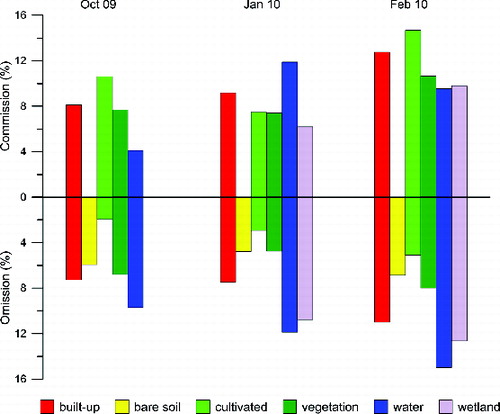
From the confusion matrix, some observations about the errors affecting the classification come out. Relevant commission errors were outlined between Vegetation and Cultivated land classes and they are probably due to a similar spectral pattern of trees or plants and certain plantations. A similar situation occurs in the 2010 maps for Water and Wetland/lowland classes. Isolated houses in dense vegetated areas or small canals that run through built-up areas or extensive cultivated land were not detected, because of the spatial resolution of Landsat images.
A significant issue for the present study is represented by the commission error which affects the Bare soil class; in particular, in correspondence of sandy or clayey material saturated with water (river banks or filling material in contact with water), the classifier incorrectly detects urban areas. This can be explained considering that the aggregate on the river banks and mixtures of sand, clay and water are used to produce bricks or as construction material in the slum shacks. Therefore, the error resulting from the confusion between Bare soil and Build-up classes depends on the impossibility to distinguish between very similar materials that have almost coincident spectral characteristics. The same problem occurs for Water and Wetland/lowland classes at low water levels with a sandy bottom.
4. Results and discussion
The maps of Dhaka district, obtained from the classification of the Landsat images, were compared through change-detection analyses to quantify land use/cover changes and systematically flooded areas. The areas pertaining to the water classes, extracted from Landsat and ASTER images, were evaluated to analyse the 2004 extreme flooding event.
4.1. Land use/cover change and urban growth dynamics
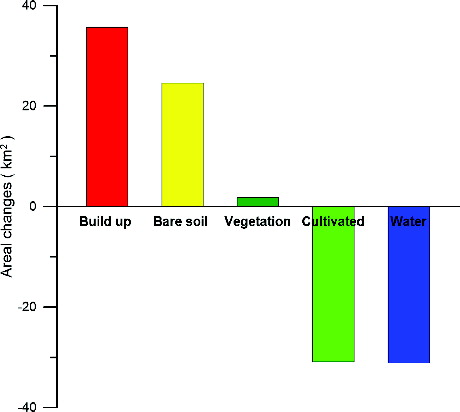
From the comparison between 2000 and 2009 maps (see and ), the pronounced increase of built-up areas and areas taken up by bare soil it has been observed. In particular, Build-up class increased approximately by 47%, from 75.4 to 111.1 km2, and Bare soil class grew more than double, from 14.4 to 38.9 km2; vegetated areas remained almost unchanged, whereas water areas and cultivated lands experienced a reduction. The total loss of Water and Cultivated land classes was 31.1 and 30.9 km2, respectively.
Table 5. October 2009–February 2010 land use/cover changes matrix (km2).
Figure 5. Difference of areal extension (km2) between 2009 and 2000 classifications.
The urban growth is the main cause of the reduction of cultivated areas; in fact, as can be seen from the land use/cover changes matrix, Build-up class increased by 35.7 km2 and the 92% (32.8 km2) of them were composed by cultivated fields in 2000. The increase of bare soil was due mainly to the presence, in 2009 map, of many artificial islands (Kamal & Midorikawa Citation2004); these were made with aggregate extracted from river banks in order to create new areas for building construction. In particular, these expansions invaded the systematically flooded areas and the cultivated fields (see ). Bare soil class increased to 24.5 km2, of which the 60% (14.7 km2) and the 29% (7.2 km2), respectively, came from Water and Cultivated land classes.
Figure 6. Development of artificial islands between 2000 (b) and 2009 (c).
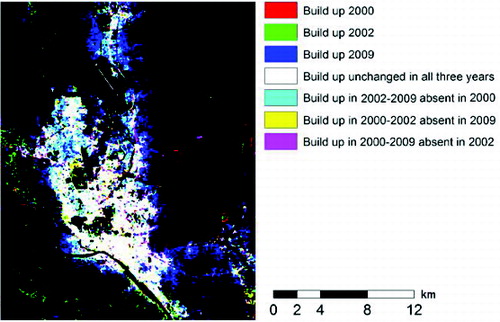
In the 2000, 2002 and 2009 maps, Build-up classes were extracted and they were assembled in an RGB representation, showed in , to highlight the urban expansion of Dhaka city. The white pixels represent built-up areas which remained unchanged in all three years, urban growth between 2002 and 2009 appears in cyan colour and the city perimeter in 2009 is displayed in blue. Overall, it can be deducted that the urban area grew mainly in the North and in the South East of the study area. Zones classified as urban in the image of 2000 and no longer existing in the map of 2009 are shown in red, and they correspond to areas where the confusion between Build-up and Bare soil classes has been observed during the classification of the 2000 image. The green areas represent the urban class in 2002 that no longer exists in 2009. Only a part of these areas correspond to classification errors between Build-up and Bare soil classes, but the majority is located in correspondence of storing areas belonging to brick factories, where the produced bricks are temporarily piled. This fact has been confirmed by using high-resolution satellite images. Yellow pixels represent built-up areas between 2000 and 2002 but absent in 2009. Using high-resolution images, it can be verified that they partly correspond to the demolition of some buildings and squatter settlements in the urban environment. The areas coloured in magenta represent pixel classified as Build-up in 2000 and in 2009 but not in 2002. This effect is due to the commission errors between Build-up and Bare soil in the classification of 2000 and in some cases of 2009. However, this problem affects only the 0.9% of the pixels.
Figure 7. Urban growth map (2000–2002–2009).
4.2. Flood-prone areas in Dhaka district (2009 floods)
Comparing post-monsoon map of October 2009 with January and February 2010 maps, the water bodies which are permanently present in the area and the areas routinely flooded during the monsoon season were identified and quantified.
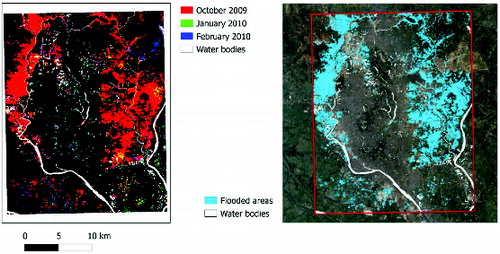
In the three classified maps, pixels belonging to Water class were isolated and coloured respectively in red, green and blue in a new combined representation (see ). In the generated image, permanent water bodies appear in white colour because the corresponding pixels are classified as water in all the three maps. The flooded areas were identified by subtracting the permanent water bodies from the Water class of October 2009 in GIS environment. To verify the correctness of the procedure, the obtained data related to water bodies were compared with the vector map of the major rivers described in Section 3.1. In particular, the water bodies always present in the territory occupy 27.2 km2, whereas the flooding affects 115.2 km2.
Figure 8. On the left, overlapping of the Water class pixels in the three Landsat images (October 2009, January 2010 and February 2010) combined in a RGB composition, in which permanent water bodies appear in white colour. On the right, the resulting permanent water bodies and flooded areas (Dhaka district).
Through the comparison between the 2009 map and the two subsequent maps of 2010, the evolution of flooding was also investigated. In October, Water class (water bodies and flooding) covers about 142 km2 of the studied area. Between October and January, Water class is reduced by 89.4 km2, leaving space mainly to cultivated fields (17.1 km2) and large wetlands (65.3 km2). Between October and February (see ), the Water class is reduced to 96 km2. Even in this case, the space occupied by the flooding is replaced by wetlands and fields but in different proportions. Compared to October–January period, the cultivated fields increased (46.7 km2) and wetland decreased (33.3 km2). Therefore, after four months, the flooded areas in October appear as areas of intense agricultural activity; they are extensive cultivations of boro rice, identified combining the land use data provided by ITHACA (see ). In fact, the exploitation of naturally flooded areas for rice cultivation is a common practice in Bangladesh.
Figure 9. A portion of the Dhaka district classifications showing widespread flooding in October 2009, becoming wetland in January and cultivated land in February 2010.
4.3. July 2004 extreme flooding event
The extreme flooding event of July 2004 was analysed collecting a Landsat image of March 2003 and an ASTER image of October 2004. In the maps obtained from their classification, water classes were extracted and exported in a GIS environment as vector layers: the water class in the 2003 map indicates water bodies in the pre-event condition; the water class resulting from the 2004 map includes permanent water bodies and flooding. Using an operation of overlay intersection, the vector layer of the water present in both maps that represents the permanent water bodies, was obtained. Using the symmetrical difference between the layer mentioned above and the water class in the 2004 map, the flooding was identified. The permanent water bodies cover about 473.3 km2 and the floods affect almost 844 km2 (see (c)).
Figure 10. Analysis of 2004 extreme event: (a) pre-event setting of water bodies by Landsat 24 March 2003; (b) post-event setting of water bodies by ASTER 20 October 2004; (c) overlay of the two classifications to distinguish between permanent water bodies and flooded areas.
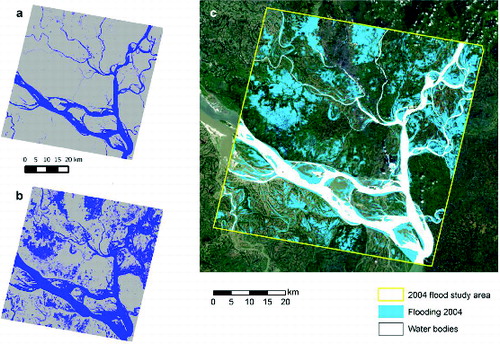
Figure 11. Flooded area for each district (km2) in 2004.
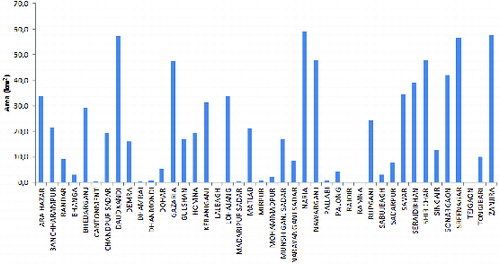
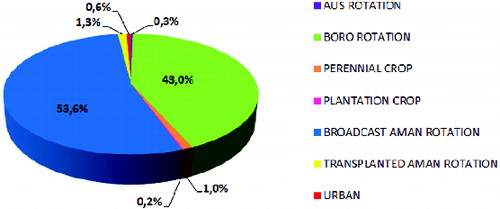
The flooded areas were thereafter associated with the administrative divisions. Therefore, for each district in the study area, the flooded area was quantified (see ). The flooding areas were associated also with the land use data of Bangladesh provided by ITHACA and the vulnerability of the type of land use/cover was highlighted (see ). The lands intended for rice cultivation are the most damaged by the flood (Bangladesh DER Report Citation2004). In particular, 321.8 km2 (43%) and 401.5 km2 (53.6%) of total flooded area, equal to 750 km2, correspond to boro and aman crops, respectively. This sum is not equal to the estimate mentioned before because in the vector layer the river beds have a different shape compared with the permanent water bodies derived from the remote sensing images. The incongruity may be due to the time lag and the different data source.
Figure 12. Land use/cover type affected by the extreme 2004 flooding event (%).
5. Conclusion
In this paper, the urban growth and the consequent land use/cover changes in Dhaka district were assessed. In the same area, the routinely flooded zones during monsoon season were also detected. Furthermore, in a wider area, the 2004 extreme flood event was analysed. The study was performed by processing eight Landsat and one ASTER multispectral images. To quantify the urban expansion and to investigate the flooding evolution, a procedure of post-classification comparison was adopted.
The results of the presented experiments highlight the potential of remote sensing techniques to support some vulnerability analyses, which appear to be essential for developing countries like Bangladesh, whose fragile economy mainly depends on agricultural practices that have a strong linkage with seasonal weather systems.
The adopted image processing proved to be effective for the identification of the basic types of land cover and the monitoring of the major changes and trends affecting a territory; in fact, accuracy values exceeding 90% were obtained for October 2009, January 2010 and February 2010 maps, after a validation performed through visual interpretation of high-resolution imagery. Even though the process suffers from the lack of reference data in form of ground truth points collected on the field, the methodology appears appropriate to support this kind of study.
The performed multitemporal analysis and the produced land use/cover maps may then contribute to expand the database available for the study area, characterized by highly dynamic phenomena related both to anthropogenic aspects and natural events; thus, the presented results may be useful for controlled and sustainable urban development planning, for the mitigation of flood risk, for relief management during floods and for monitoring the recovery stages.
Obviously, the proposed methodology may be applied in other regions, affected by similar risks and characterized by a marked seasonality, if a long time series of multispectral images (coupled with historical records and a certain number of high-resolution images for training purposes), which constitute a relevant source of information for environmental analysis, is available.
Acknowledgements
The authors want to acknowledge ITHACA (Information Technology for Humanitarian Assistance, Cooperation and Action) and, in particular, Piero Boccardo and Fabio Giulio Tonolo for providing the main database and for the fruitful discussions.
References
- Ajmar A, Boccardo P, Disabato F, Tonolo FG, Perez F, Sartori G. 2008. Early impact procedures for flood events. February 2007 Mozambique flood. Italian J Remote Sensing. 40:65–77.
- Akbari M, Mamanpoush AR, Gieske A, Miranzadeh M, Torabi M, Salemi HR. 2006. Crop and land cover classification in Iran using Landsat 7 imagery. Int J Remote Sensing. 27:4117–4135.
- Almutairi A, Warner TA. 2010. Change detection accuracy and image properties: a study using simulated data. Remote Sensing. 2:1508–1529.
- Bagan H, Takeuchi W, Kinoshita T, Bao Y, Yamagata Y. 2010. Land cover classification and change analysis in the Horqin sandy land from 1975 to 2007. IEEE J Selected Top Appl Earth Observations Remote Sensing. 3:168–177.
- Bagan H, Yamagata Y. 2012. Landsat analysis of urban growth: how Tokyo became the world's largest megacity during the last 40 years. Remote Sensing Environ. 127:210–222.
- Bangladesh Disaster & Emergency Response (DER) Sub-Group (BD). 2004. Monsoon floods 2004 – post-flood needs assessment. Dhaka, Bangladesh.
- Boccardo P, Tonolo FG. 2008. Advances in photogrammetry, remote sensing and spatial information sciences: 2008 ISPRS congress book. In: Li Z, Chen J, Baltsavias E, editors. Natural disaster management activities in support of the UN system. London: Taylor & Francis Group; Chapter 28, p. 385–396.
- Coppin P, Jonckheere I, Nackaerts K, Muys B. 2004. Digital change detection methods in ecosystem monitoring: a review. Int J Remote Sensing. 25:1565–1596.
- Del Ninno C, Dorosh PA, Smith LC, Roy DK. 2001. The 1998 floods in Bangladesh: disaster impacts, household coping strategies, and responses. Washington (DC): International Food Policy Research Institute.
- Dewan AM, Alam M, Nishigaki M. 2005. Remote sensing of 1998 and 2000 floods in Greater Dhaka, Bangladesh: experiences from catastrophic and normal events. J Fac Environ Sci Technol. 10:57–65.
- Dewan AM, Yamaguchi Y. 2009. Land use and land cover change in Greater Dhaka, Bangladesh: using remote sensing to promote sustainable urbanization. Appl Geogr. 29:390–401.
- Frazier PS, Page KJ. 2000. Water body detection and delineation with Landsat TM data. Photogramm Eng Remote Sensing. 66:1461–1468.
- Hayes DJ, Sader SA. 2001. Comparison of change-detection techniques for monitoring tropical forest clearing and vegetation regrowth in a time series. Photogrammetry Eng Remote Sensing. 67:1067–1075.
- Jianya G, Haigang S, Guorui M, Qiming Z. 2008. A review of multi-temporal remote sensing data change detection algorithms. Int Arch Photogrammetry Remote Sensing Spatial Inf Sci. XXXVII:757–762.
- Kamal M, Midorikawa S. 2004. GIS-based geomorphological mapping using remote sensing data and supplementary geoinformation: a case study of the Dhaka city area, Bangladesh. Int J Appl Earth Observation. 6:111–125.
- Khan I. 2000. Temporal mapping and spatial analysis of land transformation due to urbanization and its impact on surface water system: a case from Dhaka metropolitan area, Bangladesh. Int Arch Photogrammetry Remote Sensing. XXXIII:598–605.
- Kilic S, Evrendilek F, Berberoglu S, Demirkesen AC. 2006. Environmental monitoring of land-use and land-cover changes in a Mediterranean region of Turkey. Environ Monit Assess. 114:157–168.
- Lu D, Mausel P, Brondízio E, Moran E. 2004. Change detection techniques. Int J Remote Sens. 25:2365–2407.
- Maktav D, Erbek FS, Jürgens C. 2005. Remote sensing of urban areas. Int J Remote Sensing. 26:655–659.
- Nirupama N, Simonovic SP. 2006. Increase of flood risk due to urbanisation: a Canadian example. Nat Hazards. 40:25–41.
- Singh A. 1989. Review article digital change detection techniques using remotely-sensed data. Int J Remote Sensing. 10:989–1003.
- Song C, Woodcock CE, Seto KC, Lenney MP, Macomber SA. 2001. Classification and change detection using Landsat TM data: when and how to correct atmospheric effects? Remote Sensing Environ. 75:230–244.
- United Nations, Department of Economic and Social Affairs, Population Division (US). 2012. World Urbanization Prospects – the 2011 Revision: Highlights. New York (NY).
- United Nations Human Settlements Programme - UN-HABITAT (UK and US). 2006. The state of the world's cities report 2006/2007. Oxford (UK): Earthscan.
- United Nations University, Institute of Environment and Human Security - UNU-EHS (NL). 2011. World Risk Report 2011. Berlin: Bündnis Entwicklung Hilft (Alliance Development Works).
- Xu H, Huang S, Zhang T. 2013. Built-up land mapping capabilities of the ASTER and Landsat ETM+ sensors in coastal areas of southeastern China. Adv Space Res. 52:1437–1449.
- Yuan F, Sawaya KE, Loeffelholz BC, Bauer ME. 2005. Land cover classification and change analysis of the Twin Cities (Minnesota) Metropolitan Area by multitemporal Landsat remote sensing. Remote Sensing Environ. 98:317–328.
- Yüksel A, Akay AE, Gundogan R. 2008. Using ASTER imagery in land use/cover classification of eastern Mediterranean landscapes according to CORINE land cover project. Sensors. 8:1237–1251.
- Zhang H, Ma W, Wang X. 2008. Rapid urbanization and implications for flood risk management in Hinterland of the Pearl River Delta, China: the Foshan study. Sensors. 8:2223–2239.