
Abstract
Chamlang South Tsho has been identified as one of the six high-priority glacial lakes in terms of glacial lake outburst flood (GLOF) danger in Nepal Himalaya, despite the fact that no detailed investigations of the lake had been hitherto undertaken. We conducted detailed mapping of the lake and its surroundings along with field surveys in October 2009 to determine the developmental history of Chamlang South Tsho and to assess its potential for GLOF. The lake expanded rapidly between 1964 (0.04 km2) and 2000 (0.86 km2) and has been stable ever since. Future lake expansion is improbable as its sides are confined by relatively stable landforms. The lake is 87-m deep with a water volume of approximately 34.9–35.6 × 10⁶ m3. Hanging glaciers on the steep surrounding mountain slopes and prominent seepage water in the terminal moraine dam could be potential triggers for a future outburst flood. Additionally, the debris-covered dead-ice dam, which is higher than the lake water level, is narrow and low; therefore, it could be overtopped easily by surge waves. Furthermore, the pronounced difference in elevation between the lake and the base of the terminal moraine dam makes the lake susceptible for a large flood.
1. Introduction
As a result of glacial retreat, numerous new glacial lakes have formed in past decades, and existing lakes have grown in many glacierized mountainous regions of the world, such as in the Himalayas (Bajracharya & Mool Citation2009; Gardelle et al. Citation2011), Central Asia (Bolch et al. Citation2011; Mergili et al. Citation2013; Wang et al. Citation2013), the Canadian Cordillera (Clague & Evans Citation2000), the Andes (Carey Citation2005), and the European Alps (Huggel et al. Citation2003), probably in response to recent climate warming. Supraglacial ponds, a precursor of larger glacial lakes, are likely to form, in particular, at the termini of debris-covered glaciers with gentle surface gradients (Reynolds Citation2000), stagnated or low-velocity ice (Quincey et al. Citation2007), and high rates of ablation (Sakai & Fujita Citation2010). In the eastern Himalayas (Nepal, Bhutan, and Tibet), debris-covered glaciers are ubiquitous and recession of many of these has led to the formation of supraglacial ponds (lakes) and eventually to the development of larger moraine-dammed glacial lakes (Watanabe et al. Citation1994, Citation2009; Richardson & Reynolds Citation2000a; Bolch et al. Citation2008a; Komori Citation2008; Fujita et al. Citation2009). Most often, these glacial lakes are located between the ice-front and unconsolidated moraine dams (Benn et al. Citation2000; Komori Citation2008; Watanabe et al. Citation2009; Nuimura et al. Citation2012).
The moraine dams are composed of loose and friable debris. As a result, they are susceptible to dam breaching when some triggering event such as an ice avalanche or rock fall into the lake produces surge waves. From the perspective of disaster risk management, better understanding of glacial lakes is required as these lakes sometimes produce destructive glacial lake outburst floods (GLOFs) (Ives Citation1986; Clague & Evans Citation2000; Richardson & Reynolds Citation2000b; Bolch et al. Citation2008b; Ives et al. Citation2010). Floods from glacial lake outbursts can travel downstream for tens of kilometres from the drained lake causing widespread damage to lives and property (Vuichard & Zimmermann Citation1987; Dwivedi et al. Citation2000; Narama et al. Citation2010). More than a score of GLOF events have been recorded in the Himalayas, and several have had catastrophic impacts (Richardson & Reynolds Citation2000a; Ives et al. Citation2010). At least 13 GLOFs have occurred in Nepal Himalaya since the 1960s. The Dig Tsho GLOF in 1985 claimed several lives and destroyed the Namche small hydropower plant and trails, bridges, and farmland over a distance of more than 60 km downstream (Vuichard & Zimmermann Citation1987; ICIMOD Citation2011), and this outburst in particular has been regarded as a pivotal event for the initiation of study on GLOF hazards in Nepal Himalaya. Similar catastrophic events have also occurred in the different regions of the world, including Central Asia (Mergili & Schneider Citation2011; Narama et al. Citation2010), the Canadian Cordillera (Clague & Evans Citation2000), the Andes (Emmer & Cochachin Citation2013), and the European Alps (Huggel et al. Citation2003). During the past decade, GLOFs have emerged as an urgent contemporary threat because of the risk presented to mountain communities (Ives Citation1986; Yamada Citation1998; Richardson & Reynolds Citation2000a; Clague & Evans Citation2000; Mergili & Schneider Citation2011; Emmer & Cochachin Citation2013).
Recently, remote sensing (RS) techniques, such as the interpretation of satellite imagery, have been increasingly used for the study of glaciers and glacial lakes, largely because of their widespread availability and the high cost of traditional, field-based methods. A number of useful parameters of glacial lakes and their surroundings (e.g., surface area, slope gradient) can be extracted with the modern geographic information system (GIS) and RS technology (Huggel et al. Citation2003). However, other parameters must still be obtained from ground surveys and observations (e.g., water volume, lake depth, presence of ice in a terminal moraine, presence of seepage, etc.). Moreover, field investigations are required to confirm data gathered through RS techniques in order to minimize the uncertainty associated with RS-based analyses and interpretations, particularly those pertaining to a lake's GLOF potential (Iwata et al. Citation2002; Fujita et al. Citation2008; Byers et al. Citation2013).
Twenty-one glacial lakes among 1466 lakes in Nepal Himalaya have been identified as being potentially dangerous (ICIMOD Citation2011), primarily by using remotely sensed data. Chamlang South Tsho (the word ‘tsho’ means glacial lake or lake) and six other lakes located in the remote Hongu valley in the Dudh Koshi basin were included in the list (Byers et al. Citation2013; Sawagaki et al. Citation2012). Chamlang South Tsho () has been ranked as one of the six high-priority glacial lakes in terms of GLOF danger in Nepal Himalaya (ICIMOD Citation2011). This paper builds on the findings of Sawagaki et al. (Citation2012) and Byers et al. (Citation2013) in order to expand our understanding of the potential degree of danger posed by Chamlang South Tsho through the integration of field survey and RS data and methods, including photogrammetric analyses of stereo images.
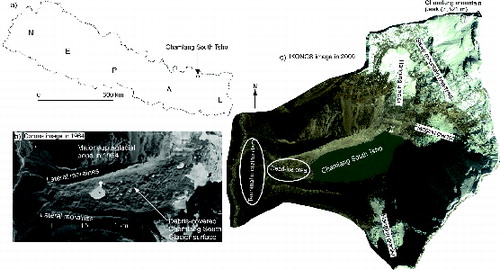
Figure 1. (a) Location of Chamlang South Glacier Lake in the map of Nepal, (b) closer views of the lake and its surroundings in a Corona image taken in 1964, and (c) IKONOS image taken in 2000. Note the substantial morphological change that occurred on the debris-covered glacier from 1964 to 2000.
2. Data and methods
Ground-based surveys, observational data, field photographs, and RS data were used in this study. Specifications of the RS data are summarized in .
Table 1. Remote sensing and supplementary data utilized in the study.
2.1. Image processing to delineate glacial lakes
The study area is located in a high mountain region with extremely pronounced relief, such that uncorrected RS imagery will contain distortions. Elevation data are an essential tool for removing geometric distortions associated with relief. An ASTER digital elevation models (DEMs) was used as a source of elevation data to orthorectify all data-sets. Stereo Corona KH-4A (1964) and ALOS (Advanced Land Observing Satellite) PRISM (2006) data were orthorectified with the Leica Photogrammetric Suite (LPS). The remaining images were orthorectified with the image geometric correction module of ERDAS IMAGINE. To obtain better alignment among the data-sets, we performed image-to-image co-registration. The operation was carried out with the AutoSync, an add-on of ERDAS IMAGINE. The AutoSync generates a large number of tie points on the overlap portion of an input image and a reference image, thereby producing a mathematical model to tie the images together. An ALOS AVNIR-2 (2008) image, which was mostly free from cloud and seasonal snow, was set as the reference image with which remaining images were co-registered. Then, manual delineation of the glacial lakes was conducted.
2.2. Stereo-data processing to produce three-dimensional (3D) topographic maps and DEMs
Because of coarser resolutions, global DEMs such as SRTM (90 m) and ASTER (30 m) are problematic for detecting small landforms and local altitudinal variation typical on glacier surfaces and their moraines (Fujita et al. Citation2009). Optical photogrammetry can be a useful technique for producing finer-resolution topographic maps and DEMs with stereo-imagery data (Altmaier & Kany Citation2002), such as Corona KH and ALOS PRISM data (Lamsal et al. Citation2011; Sawagaki et al. Citation2012). We used declassified stereo Corona KH-4A (acquired in 1964) and ALOS PRISM with a rational polynomial coefficient (RPC) file (acquired in 2006). Corona KH-4A and ALOS PRISM imageries have spatial resolutions of 2.7 and 2.5 m, respectively. ALOS PRISM data with an RPC file contains all the necessary interior and exterior orientation information to process the stereo data to produce stereo models and DEMs. Furthermore, input of a few ground control points (GCPs) together with the RPC file enhances the accuracy of the stereo imagery processed by photogrammetric techniques when compared with image processing in which only RPC data are used. A hybrid-type map (containing both images of surface features and topographic information) produced by the National Geographic Society (NGS), Washington D.C., in 1988 was used to collect four GCPs to process ALOS PRISM stereo data with an RPC file. ALOS PRISM images were triangulated (root-mean-square error [RMSE] ∼0.40 pixel) to create an ALOS stereo model and were subsequently used to produce topographic maps and DEMs. Unfortunately, Corona KH-4A data do not contain an RPC file and orientation information. As a result, Corona data require a larger number of GCPs for their processing. For Corona KH-4A stereo images, 20 GCPs were collected from the ALOS PRISM stereo model (described above), and an aerial triangulation was subsequently performed (RMSE ∼1.25 pixel) to create topographic maps and DEM with the Corona stereo data, similar to those of the ALOS PRISM data mentioned previously. These data were processed with the aid of a Leica Photogrammetric Suite (LPS) workstation. Topographic maps (2-m contour interval) and DEMs (5 m × 5 m) were produced after rigorous editing of digital terrain models (DTMs) in a Leica Terrain Format to minimize errors pertaining to irregular micro-landforms, high relief, low contrast, and shadows on the images based on procedures recommended by Lamsal et al. (Citation2011) and Sawagaki et al. (Citation2012). Fine-resolution topographic maps and DEMs are crucial in the investigation of GLOF hazards and debris-covered glaciers. The image processing tasks of ALOS and Corona stereo data, including generation of DTMs and their editing were well explained by Lamsal et al. (Citation2011) and Sawagaki et al. (Citation2012). The relative accuracy of the topographic maps and DEMs from the Corona KH-4A and the ALOS PRISM stereo images in this study is believed to be ∼±10 m, similar to that obtained by Sawagaki et al. (Citation2012).
2.3. Lake bathymetry
The depth of the lake was measured using a sonar-sounding machine (Eagle Fish Elite 500c) ((a)) with an accuracy of ±1 m. To calibrate accuracy, a depth measurement test was performed beforehand in a shallow supraglacial pond ((b)) on the same glacier (about 500 m down-glacier from the main lake) with both the machine and fishing line. It was found that the depth measurements from the two methods were nearly identical. The sonar and global positioning system (GPS) were mounted on the raft, and three longitudinal and nine traverse transects were conducted ((a)). Depth measurement points were simultaneously recorded with the GPS.
Figure 2. (a) Boating on Chamlang South Glacier Lake to measure lake bathymetry and (b) test site on a supraglacial pond about 500-m downstream of the lake.
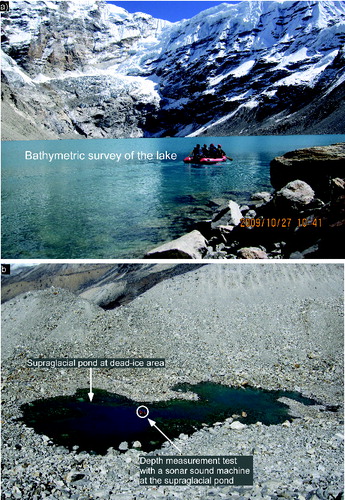
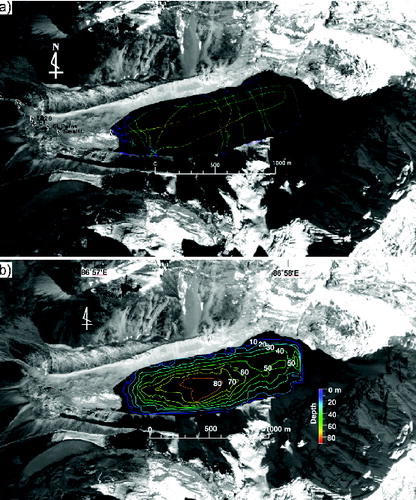
Figure 3. (a) Three longitudinal and nine transects routes and (b) bathymetric map of the lake with 10-m contour intervals. The base map is orthorectified ALOS PRISM imagery acquired in 2006.
3. Development of Chamlang South Tsho
(b) shows the bathymetric map of the lake with 10-m contour intervals. In October 2009, the lake was found to be 87 ± 1 m deep (i.e., deepest point), approximately 550-m wide (north–south), and approximately 1650-m long (east–west). The elevations of the lake water surface and bottom (deepest site) were 4940 and 4853 m, respectively, and the mean depth of the lake was calculated to be 40.2 ± 1 m (derived from a produced bathymetric DEM). The volume of water contained in the lake was determined to be between ∼34.9 and 35.6 × 10⁶ m3. The first value was calculated directly from the bathymetric DEM using a surface volume algorithm (volume below the 4940-m surface) of the 3D analyst extension of ArcGIS. The second value was obtained by summing the areas of the polygons between successive contours multiplied by their corresponding depths.
Lake surface areas and their expansion are weak indicators of GLOF hazard (Watanabe et al. Citation2009). In addition, larger glacial lakes do not necessarily produce larger flood volume during a GLOF event, as evidenced by the volumes experienced during actual GLOFs (cf. and Fujita et al. Citation2013). However, an understanding of a lake's potential for flooding requires an understanding of the characteristics of the glacier (e.g., down-glacier or up-glacier growth) and future growth prospects of the glacial lake because these affect water volume and alter dam stability. For example, down-glacier lake expansion obviously weakens the moraine dam by creating a narrower structure (Watanabe et al. Citation2009). Moreover, the downward shift of the lake shore can modify slope angles of moraine dam topography in relation to the lake surface, leading to larger potential flood volumes (PFVs) as witnessed at Nagma Pokhari, Nepal (Fujita et al. Citation2013). Consequently, it might result in an increased level of GLOF hazard and the risk associated with it.
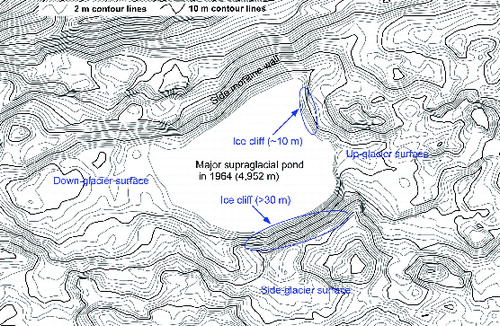
Topographic maps produced in 1964 ((a)) and 2006 ((b)) and the lake bathymetry data obtained in 2009 ((b)) enabled us to demonstrate that substantial changes in the morphology and the elevation of the debris-covered glacier surface have occurred since 1964 and that evolution of supraglacial ponds into a formidable-size glacial lake has resulted. There were several supraglacial ponds on the glacier surface in 1964, the largest of which was located at an elevation of 4952 m ((a)). The glacial surface upward from the pond had a relatively steep gradient, while the gradient down-glacier from the supraglacial pond was gentle ((a)). Glacial surface lowering (or glacial melting) around the supra-glacial pond was smaller, while it was progressively higher in the up-glacier area (). The longitudinal profile (L–L′) of the glacier () clearly shows a gentle glacier slope and surface at the lower part of the glacier. Such a condition favours the formation of supraglacial ponds on debris-covered glaciers (Reynolds Citation2000). The presence of a steeper up-glacier surface ((a)) and ice cliffs on the southern and eastern sides of the supraglacial pond in 1964 ( and ) suggests ice-calving into the pond that resulted in faster up-glacial-lake expansion during the years after 1964. Ice-calving into the lake could have been the key mechanism for the faster lake growth in the up-glacial area after 1964; otherwise, downward lake expansion of Chamlang South Tsho would also have been large.
Figure 4. Detailed topographic maps around Chamlang South Glacier/Lake in (a) 1964 and (b) 2006. Contour intervals: 1 m (faint lines), 10 m (lighter bold lines), and 20 m (bold lines). The dotted line and rectangle in (a) represent the sites of the profile shown in and the area of , respectively.
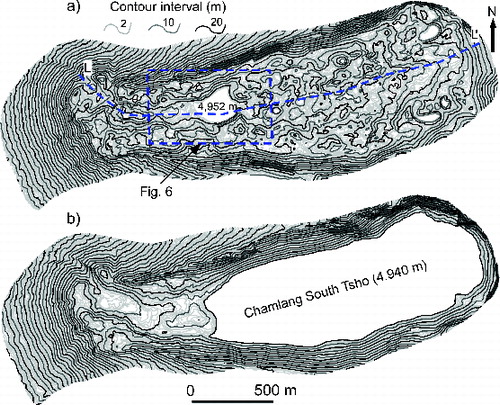
Figure 5. Longitudinal profile along L–L′ showing glacier surface topographies in 1964 and 2006 and the lake bathymetry in 2009. For location, see (a).
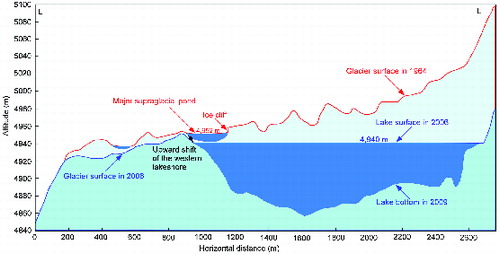
Figure 6. Detailed view of the major supraglacial pond and its surrounding topography in 1964. Note the prominent ice cliffs on the left side and up-shore of the pond and the gentle and ice-cliff free down-glacier area. The location is indicated by the dotted rectangular box in (a).
The surface areas of Chamlang South Tsho in six different years between 1964 and 2010 were 0.04, 0.13, 0.64, 0.86, 0.87, and 0.87 km2 in 1964, 1976, 1992, 2000, 2006, and 2010, respectively (). The lake expanded at a relatively slow rate from 1964 to 1976, i.e., by 0.007 km2/year (0.085 km2 in 12 years). However, the lake grew rapidly from 1976 to 2000 at 0.031 km2/year (0.74 km2 in 24 years), even faster than the growth of Imja Tsho (by 0.51 km2 during the same period in 24-year period), a rapidly expanding glacial lake in Nepal Himalaya (Yamada Citation1998; Watanabe et al. Citation2009). Lake growth virtually stopped sometime between 1992 and 2000 (). The reason for the steady state of Chamlang South Tsho in the up-glacial area is that the feeder glaciers had already retreated to the higher mountain slopes. Similarly, the lake has been confined on its two sides by lateral moraines. As a result, Chamlang South Tsho has no possibility of further upward or lateral expansion. Downward lake expansion was examined by using overlays of the lake outlines from 1964 to 2010, and no downward expansion was found (). Instead, tens of metres of upward shift of the western lakeshore were noticed ( and ), and this shift may have occurred as a result of lake water surface lowering along the inclined lakebed sloping eastwards (see ).
Figure 7. Growth of surface area of the lake from 1964 to 2010. The lake expanded rapidly to 2000 but subsequently became stagnant. The background image is a Corona KH-4A taken in 1964.
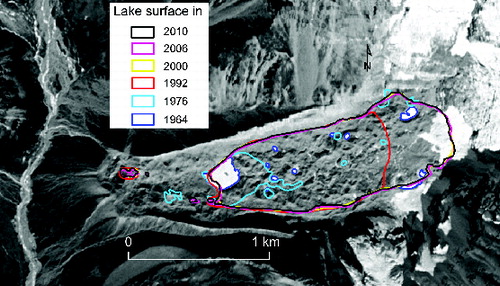
A small lake area discrepancy during the years from 2000 to 2010 is believed to have occurred by delineation errors resulting from the diverse spatial resolution of the RS data (see ). For instance, we did not find significant differences in surface areas of the lake over the years; however, the lake boundaries did not exactly overlap at a few locations (). Obviously, lake boundaries derived from finer resolution satellite data (e.g., ALOS PRISM, 2.5 m) can illustrate small landform features, such as sharp notches, that coarser images cannot.
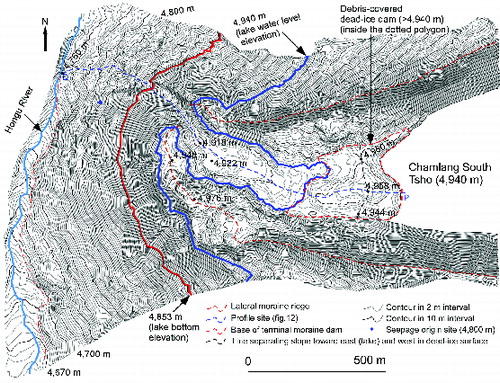
A spillway channel does not exist on the dead-ice surface to drain water from Chamlang South Tsho. There is a slightly raised, narrow dead-ice area (maximum height of 4–18 m and approximately 200-m wide) covered by thick debris, which effectively dams the lake water. The area between the western lakeshore and the thick blue line (same elevation as lake water level 4940 m) passing through the dead-ice surface in represents the dead-ice dam. The dead-ice surface, including a large portion of the lake dam, slopes downward (). As a result, meltwater in most of the dead-ice area flows out readily and does not contribute to lake expansion. Even if dead-ice melting does not occur and the lake water level rises, the water level cannot rise more than 4 m from the present level. This suggests that the surface area and the water volume of the lake will not grow significantly in the future.
Figure 8. Detailed topographic map of the dead-ice area, lateral moraines, and terminal moraine complex. An orange bold contour line of 4940 m passing through the dead-ice area separates the areas higher (i.e., debris-covered dead-ice dam) and lower than the lake water surface. A red line with elevation of 4853 m passing through the terminal moraines represents the same elevation as the bottom of the lake. Note the altitudinal distributions and their differences among the various land features, such as the lake, lateral moraines, and the base of the terminal moraine dam along the Hongu River. The dotted line PQ represents the site of the profile shown in . The relative height difference between the lake water surface and the dead-ice dam is only about 4–18 m.
4. Susceptibility of GLOF hazard from Chamlang South Tsho
Among the recorded GLOF events in the Himalayas, the North American Cordillera, and the Andes, slope movements such as ice avalanches, rockfalls, and landslides have been found to be the most frequent GLOF triggers (Clague & Evans Citation2000; Richardson & Reynolds Citation2000a; Emmer & Cochachin Citation2013). In the Himalayas, in particular, eight out of 14 known GLOF triggers were reported to have been ice avalanches (Richardson & Reynolds Citation2000a), including those of the two most recent outbursts (Dig Tsho and Tam Pokhari in 1985 and 1998, respectively) that occurred in the Everest area of Nepal. Therefore, ice avalanches from hanging glaciers constitute one of the most important outburst triggering factors in the Himalayas. In consideration of this fact, hanging glaciers above glacial lakes need to be considered as a potential source of outburst triggers when evaluating GLOF hazards.
There are some prominent hanging glaciers above Chamlang South Tsho ((a) and (a)), which were readily observed during the 2009 field expedition and with fine-resolution IKONOS images. These hanging glaciers could dislodge and cascade into the lake producing surge waves. Three hanging glaciers from the eastern, north-eastern, and south-eastern mountain slopes ((a) and ) are potential sites for ice avalanches, whereas the north-western slopes are potential sites for rockfalls or landslides into the lake. Well-developed crevasses and bergschrunds exist on these hanging glaciers ((a)), which further increase the possibility of ice detachment. The termini of the glaciers are >150 m above the lake, and there is no space in between to alleviate the impact of possible ice avalanches. Hanging glaciers reportedly triggered the 1998 Tam Pokhari GLOF in the adjoining Hinku valley and the 1985 Dig Tsho GLOF in the Bhote Koshi valley, both located in the Everest region of Nepal (Vuichard and Zimmermann Citation1987; Dwivedi et al. Citation2000; ICIMOD Citation2011). Generally, the glaciers in this region are retreating (Bajracharya & Mool Citation2009). Chamlang South Tsho has also been receding rapidly upslope, and its surface gradients are becoming increasingly steep (). Consequently, an increase in the relative height between the lake and the hanging glaciers, concurrent with the change in the glacier's surface steepness, could increase both the possibility for and potential impact of an ice avalanche into the lake.
Figure 9. (a) Hanging glaciers with crevasses and cracks and (b) high, steep, and unconsolidated terminal moraine dam.
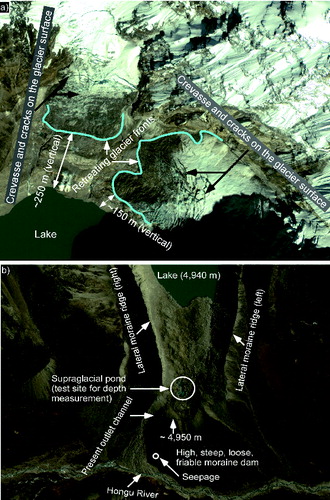
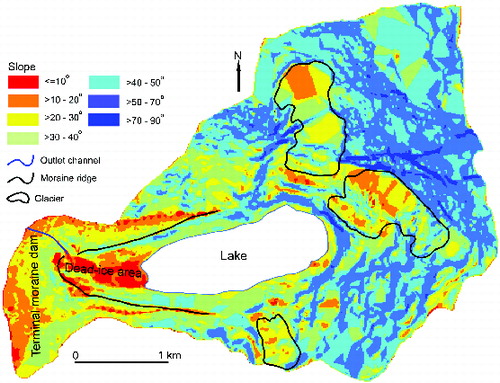
Figure 10. Slope angle of terrain surrounding of the lake. The steepness of hanging glaciers ranges from 20º to more than 50º, while the steepness of the terminal moraine dam is up to 50º.
In addition, large surge waves, if generated, could easily overtop the debris-covered dead-ice dam in contact with the west lakeshore because it is only ∼4–18 m higher than the lake water surface at 4940 m. The dimensions of the dead-ice dam are ∼250-m wide and ∼180–325-m long compared to the ∼1650-m long and 500-m wide lake (). The dead-ice surface farther downward becomes increasingly lower than the lake water level. However, the existence of an approximately 750-m long by 250-m wide dead-ice area, surface roughness, a wide size range of debris from pebbles to large boulders, and uneven surface morphology ((b)), west of the lake might alleviate potential surge waves of relatively small magnitude. A wide dam area is likely to act as a buffer against surge waves from various triggering mechanisms (Byers et al. Citation2013).
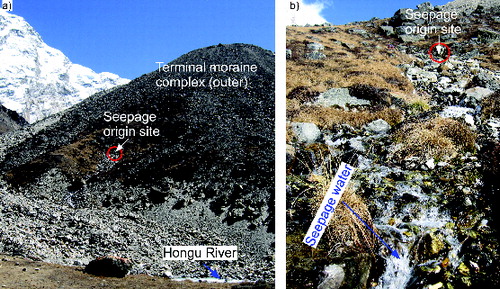
In particular, the terminal moraine topography of Chamlang South Tsho's outer slope is steep () and composed of unconsolidated moraine materials ( and (a)). Such a moraine dam is susceptible to dam failure when triggering events occur (Clague & Evans Citation2000; Richardson & Reynolds Citation2000b). In addition, a prominent seepage outlet (27° 45′ 20.65″ N, 86° 56′ 20.78″ E) exists in the lower belt of the terminal moraine dam well above the Hongu River, which flows at the base and far from the drainage channel of the lake (, (b), and (a) and (b)). It is unclear whether the conduit of this seepage is connected to the main lake or whether it begins from the dead-ice complex. In either case, the existence of such a seepage is regarded as a potential GLOF trigger (Clague & Evans Citation2000; Iwata et al. Citation2002) because the seepages weaken the ice-cored moraine dams, which may eventually collapse catastrophically (Richardson & Reynolds Citation2000b).
Figure 11. (a) Seepage site and outer slope of the terminal moraine dam and (b) close view of the seepage. Note the loose and unconsolidated moraine dam (a) and the amount of seepage water (b).
and clearly show the surface topography from the western lakeshore to the base of the terminal moraines. There exists in this area a dead-ice surface substantially lower than the lateral and terminal moraine, as well as a well-developed drainage course through the terminal moraines. A drainage course through the dead-ice surface (here we call it a ‘spillway channel’) does not exist until a small supraglacial pond at 4918 m, as evidenced by our field observations and high-resolution RS data and maps (see and ). A drainage course outside the dead-ice area (here we call it an ‘outlet channel’) begins from a small supraglacial pond at 4922 m; however, the meltwater flows hidden beneath the debris surface for >100 m in the upper section () and then re-emerges downstream. The outlet channel is noticeably incised compared to its side debris in the terminal moraine dam. Therefore, the outlet channel below the small supraglacial pond at 4918 m represents the lowest surface (indicated by the blue dotted line in ) along which prospective surge waves would travel before reaching the Hongu River at the base if an outburst of Chamlang South Tsho were to occur.
Figure 12. Graphical representation of the altitudinal distributions among various topographical and geomorphological units of the lake and its surroundings. See for location of the profile.
The base level of the terminal moraine at the confluence of the Hongu River and the mouth of the present outlet channel (∼4760 m) is located at a much lower elevation than the lake water level (4940 m) ( and ). The base of the terminal moraine dam along the Hongu River downstream lies at an increasingly lower elevation (see ). The lake has a maximum depth of 87 m, which means that the lake bottom has an elevation of 4853 m. It should be noted that the relative height between the lake water level and base level of the terminal moraine dam at Chamlang South Tsho (minimum ∼180 m) is much larger than that at Tam Pokhari (∼100 m) before its outburst in 1998 and that at widely known Imja Tsho (∼20 m), which is regarded as one of the potentially dangerous glacial lakes in Nepal Himalaya (ICIMOD Citation2011). The outer slope of the terminal moraine attains a steepness of 50°, with the average being >25º, (), which is still steeper than that of Tam Pokhari, with an average of ∼25º. The average slope of the drainage channel in the terminal moraine complex of Chamlang South Tsho is also >20º ( and ).
Recently, Fujita et al. (Citation2013) proposed an approach of steep lookdown area (SLA) determined by a 10º depression angle against a lake water level to its outer flank of terminal moraine to estimate the PFV of glacial lakes. Interestingly, several glacial lakes that have been considered potentially dangerous by previous studies (e.g., Mool et al. Citation2001; ICIMOD Citation2011) are found to contain insignificant PFVs (Fujita et al. Citation2013). Based on this 10º threshold, Fujita et al. (Citation2013) estimated the PFV of West Chamlang to be 4.8 × 10⁶ m3. Unfortunately, Chamlang South Tsho is not contiguous to the terminal moraine because of the dead-ice body, which restricts the application of this method to Chamlang South Tsho. Moreover, we did not find distinguishable SLA on the terminal moraine topography of Chamlang South Tsho. At Tam Pokhari, where the topography of the terminal moraine dam before the outburst was comparable with that at Chamlang South Tsho, Osti and Egashira (Citation2009) reported that the lake lowered by 50 m against an ∼100-m high dam. At Chamlang South Tsho, the high altitudinal differences (minimum of ∼180 m along the outlet channel) between the base of the loose and unconsolidated moraine dam and the glacial lake might suggest a larger flood volume from the lake in the event of dam breach because the moraine base is lower than even the lake bottom ( and ).
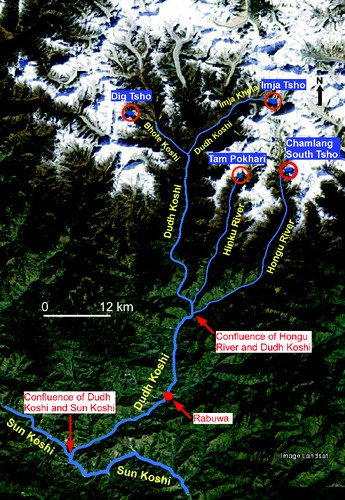
It should be noted that smaller outburst floods do not necessarily correspond to lower risk, nor larger outburst floods necessarily pose higher risk. For instance, if downstream areas contain densely populated settlements and costly infrastructures, high fatalities and damage could be inflicted by even small outburst floods. Pertinent examples include the outburst floods of Dig Tsho in 1985 (∼5.1 × 10⁶ m3) and Tam Pokhari in 1998 (∼18.0 × 10⁶ m3), of which the former caused more devastation than latter. One reason why Dig Tsho swept away the nearly completed Namche hydroplant (costing approximately $3 million) is that it was located only about 12 km downstream from the lake. Vulnerability and risk assessments associated with Chamlang South Tsho that require detailed field surveying for tens of kilometres downstream have not yet been carried out and were also largely beyond the scope of this paper. As a result, detailed information on vulnerable people and properties in the downstream areas of Chamlang South Tsho and thus the actual risk associated with this lake, in particular, are not known well. Risk assessments associated with Imja Tsho were conducted by Khanal et al. (Citation2009) along the neighbouring Dudh Koshi basin from Imja Tsho to the confluence of Dudh Koshi and Sun Koshi for about 120 km (). Of this region, about 50 km of lower river valley (from the Hongu River-Dudh Koshi confluence to the Dudh Koshi-Sun Koshi confluence) is common to both the Hongu River and Dudh Koshi basins (). The downstream areas for about 45 km along the Hongu River from Chamlang South Tsho to the confluence of the Hongu River and Dudh Koshi are almost uninhabited; however, many people from farther downstream commute and also install temporary huts along the river valleys during the pre- and post-monsoon seasons for grazing their sheep and goats. According to Khanal et al. (Citation2009), there are several settlements, including Barkhubesi, Demiltar, Tuintar, Khatrigaon, Rabuwa, Tirpurabesi, Mahadevbesi, Khokselibesi, and Jayaramtar, along the river valley from the Hongu River-Dudh Koshi confluence to the Dudh Koshi-Sun Koshi confluence (). According to the study, a few hundred households and thousands of people, their property, livestock, crops, and agricultural land, along with several hotels, teashops, bridges, irrigation canals, and a feasibility-studied 300-MW hydropower plant (near Rabuwa) are located in flood-prone areas.
Figure 13. View from Chamlang South Tsho to areas about 100 km downstream, including Rabuwa, a settlement where a feasibility study for a 300-MW hydropower plant has been carried out. Two GLOF-occurred lakes (Dig Tsho and Tam Pokhari) and Imja Tsho, a repeatedly cited potentially dangerous glacial lake, along with river systems in the area are shown.
As mentioned earlier in the Introduction, this study expands on findings of Sawagaki et al. (Citation2012) and Byers et al. (Citation2013). Although Sawagaki et al. (Citation2012) did not discuss GLOF hazards, the authors did investigate the surface lowering of Chamlang South Glacier and the development of a glacial lake on it over four decades and found substantial ice melting as high as 2.2 m/year that facilitated growth of the large lake. Byers et al. (Citation2013) briefly discussed the GLOF hazard of the lake and inferred that the lake was ‘not particularly dangerous’ based primarily on the wide area between west lakeshore and the terminal moraine dam that might absorb displacement waves. This study integrated field surveys and a high-resolution photogrammetric data-set to present a more comprehensive analysis of the hazard from the lake by incorporating detailed topographical and geomorphological information around the lake (e.g., dead-ice dam, terminal moraine dam, and hanging glaciers) in relation to lake bathymetry, which had not been achieved previously. As discussed above, the existence of steep hanging glaciers above the lake, which could trigger an outburst, a huge volume of water in the lake, an easy-to-overtop dead-ice dam (low and narrow), an inclined dead-ice surface farther westward that would allow water to reach the terminal moraine area more quickly, and an unconsolidated terminal moraine dam (easy to erode), combined with a pronounced elevation difference between the lake (water surface and lake bottom) and base of the terminal moraine dam make the lake susceptible to an outburst flood. Based on our data-set, we suggest that the lake is potentially dangerous, and it should be monitored regularly.
In this study, we presented two pieces of crucial information essentially needed to assess GLOF hazards, a lake bathymetry, and a detailed topography around the lake (including the moraine dam). Despite this effort, our analysis of the GLOF hazard from Chamlang South Tsho is largely qualitative to semi-quantitative and does not adequately include a risk assessment. To address these issues further, we recommend future research for calculations pertaining to the volume of ice that may detach from the hanging glaciers (e.g., estimation of volume of rock avalanche as did by Hubbard et al. Citation2005), the size of potential displacement waves, estimation of the potential volume of water that may overtop the dam in the face of the wide dead-ice area, simulation of resulting floods or GLOF modelling (Byers et al. Citation2013, Bajracharya et al. Citation2007), and a detailed field survey to assess risk in the downstream areas, which should significantly improve understanding of both GLOF hazards and risk.
5. Conclusions
We carried out detailed surface area, bathymetric, and topographic mappings around Chamlang South Tsho to determine the lake's development processes and assess the prospect of GLOF from the lake. The volume of water contained in the lake in 2009 was determined to be ∼34.9–35.6 × 10⁶ m3. Surface areas of the lake in 1964, 1976, 1992, 2000, 2006, and 2010 were 0.04, 0.12, 0.64, 0.86, 0.87, and 0.87 km2, respectively. Thus, the lake grew quickly from the 1960s to 2000 but has not been expanding since. Furthermore, the lake has little possibility of future expansion due to the confinement of its sides by either bedrock or lateral moraines and the relatively stable moraine dam. Hanging glaciers on the steep mountain slopes and prominent seepage water in the terminal moraine dam are considered potential triggers for an outburst flood. The existence of a low and narrow debris-covered dead-ice dam means that surge waves could overtop the dam and erode the terminal moraine dam, which is steep and unconsolidated along the present outlet channel. Furthermore, the lake can be considered potentially dangerous because of the pronounced height difference between the lake (water surface and bottom) and the base of the terminal moraine dam. Regular monitoring of Chamlang South Tsho is recommended.
Acknowledgements
We would like to thank Dr Martin Mergili and an anonymous reviewer for their valuable comments on the manuscript.
Additional information
Funding
Related Research Data
References
- Altmaier A, Kany C. 2002. Digital surface model generation from CORONA satellite images. ISPRS J Photogramm Remote Sens. 56:221–235.
- Bajracharya SR, Mool P. 2009. Glaciers, glacial lakes and glacial lake outburst floods in the Mount Everest region, Nepal. Ann Glaciol. 50:81–86.
- Bajracharya B, Shrestha AB, Rajbhandari L. 2007. Glacial lake outburst floods in the Sagarmatha region. Mt Res Dev. 27:336–344.
- Benn DI, Wiseman S, Warren CR. 2000. Rapid growth of a supraglacial lake, Zgozumpa glacier, Khumbu Himal, Nepal. Paper presented at: Symposium at Seattle 2000 on Debris-covered Glaciers. IAHS Publication No. 264, p. 177–185; Seattle, WA.
- Bolch T, Buchroithner M, Pieczonka T, Kunert A. 2008a. Planimetric and volumetric glacier changes in the Khumbu Himal, Nepal, since 1962 using Corona, Landsat TM and ASTER data. J Glaciol. 54:592–600.
- Bolch T, Buchroithner MF, Peters J, Baessler M, Bajracharya SR. 2008b. Identification of glacier motion and potentially dangerous glacier lakes at Mt. Everest area/Nepal using spaceborne imagery. Nat Hazards Earth Syst Sci. 8:1329–1340.
- Bolch T, Peters J, Yegorov A, Pradhan B, Buchroithner M, Blagoveshchensky V. 2011. Identification of potentially dangerous glacial lakes in the northern Tien Shan. Nat Hazards. 59:1691–1714.
- Byers AC, Mckinney DC, Somos-Valenzuela M, Watanabe T, Lamsal D. 2013. Glacial lakes of the Hinku and Hongu valleys, Makalu Barun National Park and Buffer Zone, Nepal. Nat Hazards. 69:115–139.
- Carey M. 2005. Living and dying with glaciers: people's historical vulnerability to avalanches and outburst floods in Peru. Glob Planet Change. 47:122–134.
- Clague JJ, Evans SG. 2000. A review of catastrophic drainage of moraine-dammed lakes in British Columbia. Quat Sci Rev. 19(17–18):1763–1783.
- Dwivedi SK, Acharya MD, Simard R. 2000. The Tam Pokhari Glacier Lake outburst flood of 3 September 1998. J Nepal Geol Soc. 22:539–546.
- Emmer A, Cochachin A. 2013. The causes and mechanisms of moraine-dammed lake failures in the Cordillera Blanca, North American Cordillera, and Himalayas. AUC Geogr. 48(2):5–15.
- Fujita K, Sakai A, Nuimura T, Yamaguchi S, Sharma RR. 2009. Recent changes in Imja Glacial Lake and its damming moraine in the Nepal Himalaya revealed by in-situ surveys and multi-temporal ASTER imagery. Environ Res Lett. 4:045205.
- Fujita K, Sakai A, Takenaka S, Nuimura T, Surazakov AB, Sawagaki T, Yamanokuchi T. 2013. Potential flood volume of Himalayan glacial lakes. Nat Hazards Earth Syst Sci. 13:1827–1839.
- Fujita K, Suzuki R, Nuimura T, Sakai A. 2008. Performance of ASTER and SRTM DEMs, and their potential for assessing glacier lakes in the Lunana region, Bhutan Himalaya. J Glaciol. 54:220–228.
- Gardelle J, Arnaud Y, Berthier E. 2011. Contrasted evolution of glacial lakes along the Hindu Kush Himalaya mountain range between 1990 and 2009. Glob Planet Change. 75:47–55.
- Hubbard B, Heald A, Reynolds JM, Quincey D, Richardson SD, Luyo MZ, Portilla NS, Hambrey MJ. 2005. Impact of a rock avalanche on a moraine-dammed proglacial lake: Laguna Safuna Alta, Cordillera Blanca, Peru. Earth Surf Process Landforms. 30:1251–1264.
- Huggel C, Kääb A, Haeberli W, Krummenacher B. 2003. Regional-scale GIS-models for assessment of hazards from glacier lake outbursts: evaluation and application in the Swiss Alps. Nat Hazards Earth Syst Sci. 3:647–662.
- [ICIMOD] International Center for Integrated Mountain Development. 2011. Glacial lakes and glacial lake outburst floods in Nepal. Kathmandu: ICIMOD.
- Ives JD. 1986. Glacial outburst floods and risk engineering in the Himalaya. ICIMOD Occasional Paper 5. Kathmandu: ICIMOD.
- Ives JD, Shrestha RB, Mool PK. 2010. Formation of glacial lakes in the Hindu Kush-Himalayas and GLOF risk assessment. Kathmandu: ICIMOD.
- Iwata S, Ageta Y, Naito N, Sakai A, Narama C, Karma. 2002. Glacial lakes and their outburst flood assessment in the Bhutan Himalaya. Glob Environ Res. 6:3–17.
- Khanal NR, Koirala HL, Nepal P, Rai D, Khanal B, Sigdel S, Sharma AR. 2009. GLOF risk assessment of the Imja, Tsho Rolpa and Thulagi glacial lakes in Nepal. Report submitted to International Centre for Integrated Mountain Development (ICIMOD) (unpublished report).
- Komori J. 2008. Recent expansions of glacial lakes in the Bhutan Himalayas. Quat Int. 184:177–186.
- Lamsal D, Sawagaki T, Watanabe T. 2011. Digital terrain modelling using Corona and ALOS PRISM data to investigate the distal part of Imja Glacier, Khumbu Himal, Nepal. J Mt Sci. 8:390–402.
- Mergili M, Müller JP, Schneider JF. 2013. Spatio-temporal development of high-mountain lakes in the headwaters of the Amu Darya River (Central Asia). Glob Planet Change. 107:13–24.
- Mergili M, Schneider JF. 2011. Regional-scale analysis of lake outburst hazards in the southwestern Pamir, Tajikistan, based on remote sensing and GIS. Nat Hazards Earth Syst Sci. 11:1447–1462.
- Mool PK, Bajracharya SR, Joshi SP. 2001. Inventory of glaciers, glacial lakes and glacial lakes outburst floods. Kathmandu: ICIMOD.
- Narama C, Duishonakunov M, Kääb A, Daiyrov M, Abdrakhmatov K. 2010. The 24 July 2008 outburst flood at the western Zyndan glacier lake and recent regional changes in glacier lakes of the Teskey Ala-Too range, Tien Shan, Kyrgyzstan. Nat Hazards Earth Syst Sci. 10:647–659.
- Nuimura T, Fujita K, Yamaguchi S, Sharma RR. 2012. Elevation changes of glaciers revealed by multitemporal digital elevation models calibrated by GPS survey in the Khumbu region, Nepal Himalaya, 1992–2008. J Glaciol. 58:648–656.
- Osti R, Egashira S. 2009. Hydrodynamic characteristics of the Tam Pokhari Glacial Lake outburst flood in the Mt. Everest region, Nepal. Hydrol Process. 23:2943–2955.
- Quincey DJ, Richardson SD, Luckman A, Lucas RM, Reynolds JM, Hambrey MJ, Glasser NF. 2007. Early recognition of glacial lake hazards in the Himalaya using remote sensing datasets. Glob Planet Change. 56:137–152.
- Reynolds MJ. 2000. On the formation of supraglacial lakes on debris-covered glaciers. Paper presented at: Symposium at Seattle 2000 on Debris-covered Glaciers. IAHS Publication No. 264, p. 153–161; Seattle, WA.
- Richardson SD, Reynolds JM. 2000a. An overview of glacial hazards in the Himalayas. Quat Int. 65/66:31–47.
- Richardson SD, Reynolds JM. 2000b. Degradation of ice-cored moraine dams: implications for hazard development. Paper presented at: Symposium at Seattle 2000 on Debris-covered Glaciers. IAHS Publication No. 264, p. 187–197; Seattle, WA.
- Sakai A, Fujita K. 2010. Formation conditions of supra-glacial lakes on debris-covered glaciers in the Himalaya. J Glaciol. 56:177–181.
- Sawagaki T, Lamsal D, Byers AC, Watanabe T. 2012. Changes in surface morphology and glacial lake development of Chamlang South Glacier, eastern Nepal Himalaya, since 1964. Glob Environ Res. 16:83–94.
- Vuichard D, Zimmermann M. 1987. The 1985 catastrophic drainage of a moraine dammed lake, Khumbu Himal, Nepal: cause and consequences. Mt Res Dev. 7:91–110.
- Wang X, Ding Y, Liu S, Jiang L, Wu K, Jiang Z, Guo W. 2013. Changes of glacial lakes and implications in Tian Shan, central Asia, based on remote sensing data from 1990 to 2010. Environ Res Lett. 8: 044052.
- Watanabe T, Ives JD, Hammond JE. 1994. Rapid growth of a glacial lake in Khumbu Himal, Himalaya: prospects for a catastrophic flood. Mt Res Dev. 14:329–340.
- Watanabe T, Lamsal D, Ives JD. 2009. Evaluating the growth characteristics of a glacial lake and its degree of danger of outburst flooding: Imja Glacier, Khumbu Himal, Nepal. Nor Geogr Tidsskr. 63:255–267.
- Yamada T. 1998. Glacier lakes and its outburst flood in the Nepal Himalaya. Monograph No. 1, Data Center for Glacier Research. Tokyo: Japanese Society of Snow and Ice.