
Abstract
Water reservoirs are facing universal sedimentation problems worldwide. Land covers, whether natural or manmade, eventually change, and the vegetation cover and rainfall have a great effect on the sediment load. Traditional techniques for analysing this problem are time-consuming and spatially limited. Remote sensing (RS) provides a convenient way to observe land cover changes, and geographic information system (GIS) provides tools for geographic analysis. This study demonstrates a GIS-based methodology for calculating the impact of vegetation and rainfall on the sediment load using remotely sensed data. Moderate resolution imaging spectroradiometer data were used to observe temporal changes in the vegetation-cover area of the watershed surface. The total drainage area for the reservoir was calculated from shuttle radar topographic mission data. The annual rainfall amount was used to compute the annual available rainwater for the watershed, and the impact of the annual available rainwater on the vegetation-covered area was determined. In addition, areas that were adding sedimentation to the reservoir were identified. An inverse relationship between the rainfall and vegetation cover was observed, clearly showing the triggering of erosion.
1. Introduction
Water is an important resource for any country, especially for agricultural countries, such as Pakistan. It is a resource that cannot be generated but can be preserved. Water resources are affected by many natural hazards, such as sedimentation, earthquakes and floods. Anthropogenic activities such as land clearance and dam construction have led to an increase in sedimentation (Walling Citation2008). The study revealed that the accelerating pace of human impact in various regions of the world indicated the changes in the sediment loads of its rivers likely to be intensifying. The world's 13 largest rivers carry 5.8 billion tons of sediment into reservoirs every year (Nasir et al. Citation2000; Islam, Jameel, & Jumaat Citation2012).
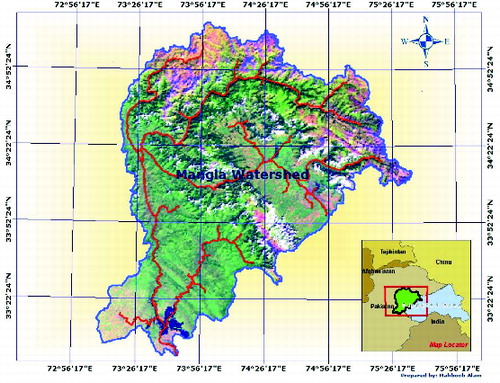
This study was performed in the Mangla domestic watershed (Mangla dam Citation2010), shown in . The Mangla dam (Mangla dam Citation2010) was constructed in 1967 across the Jhelum River and is situated 60 km south-east of Islamabad, Pakistan. The storage capacity of the Mangla dam was 725,004 million cubic metres (mcm) when it was constructed, but now the capacity is only 585,675 mcm. The sedimentation rate is so high that the reservoir has lost 19.2% of its capacity since 1967. The precious Mangla and Tarbela reservoirs are becoming filled with silt at a rate of 51,806,238 and 51,806,238 cubic metre per annum, respectively, because of poor practices in the catchment areas (Khan Citation1985).
Figure 1. Study area/Mangla watershed.
Erosion around the catchment area of the reservoir contributes a sediment load that reduces the capacity of the dam. Recently, several studies have been performed to uncover the causes of sedimentation (Tanaka & Yagisawa Citation2010; Day et al. Citation2011; Fritz et al. Citation2012; Islam, Jameel, Jumaat, Shirazi, & Salman Citation2012; Noe Citation2013). The vegetation parameter for modelling soil erosion has been estimated using a linear spectral mixture analysis of Landsat Enhanced Thematic Mapper (ETM) data in some studies (de Asis & Omasa Citation2007; Islam, Hussain, et al. Citation2013; Islam, Jameel, et al. Citation2013). In several studies, the landscape vegetation and rainfall influence have been explored. Nouri et al. (Citation2012) have reviewed evapotranspiration measurement techniques for estimating the water requirements of urban landscape vegetation. Sandoval et al. (Citation2013) evaluated rainfall influence over water quality effluent of an urban catchment incorporating a data-driven approach. Bookhagen (Citation2010) presented the appearance of extreme monsoonal rainfall events and their impact on erosion in the Himalayas.
The remote sensing (RS) as well as geographic information system (GIS) based assessment has been carried out in a few studies. Koehn et al. (Citation2011) dealt with quantification of storm water runoff using a combined GIS and curve number approach as a case study for an urban watershed in the Ozark Highlands, USA. Goldshleger et al. (Citation2012) reported generalizing urban runoff and street network density relationship with hydrological and remote-sensing case study in Israel. Dahal et al. (Citation2012) reported the replication of landslide hazard mapping at catchment scale. Pourghasemi et al. (Citation2012) performed a comparative assessment of prediction capabilities of Dempster–Shafer and Weights-of-evidence models in landslide susceptibility mapping using GIS. Khosrokhani and Pradhan (Citation2013) carried out spatio-temporal assessment of soil erosion at Kuala Lumpur metropolitan city using remote sensing data and GIS.
Most previous work has been accomplished via traditional methods, such as physical surveying and sampling. The Revised Universal Soil Loss Equation (RUSLE) has been used for three decades in combination with physical sampling and is known to work well in erosion management (Tiwari et al. Citation2000). However, the traditional methods of land management are time-consuming and spatially limited. The factors causing sedimentation have only been analysed on a small scale and on an experimental basis. A large-scale analysis and implementation of recommendations are required. This problem of sedimentation prompted the initiation of the Mangla Watershed Management Project at an early stage of the dam project, and biological and engineering measures were introduced to prevent erosion and to reduce sedimentation in the reservoirs (Haq & Ahmad Citation2004). Jat et al. (Citation2009) conducted remote sensing and GIS-based assessment of urbanization and degradation of watershed health. Differently to the antecedent studies, the present case promotes the use of the geographic information system (GIS) and has reduced the effort involved in performing surveys and sampling and also increases the scale of analysis and requires less time than traditional methods.
Therefore, the aim of the study is to use simple GIS-based and remote sensing-based methodologies to identify the effects of vegetation and rainfall on reservoir capacity throughout the entire area providing water to the Mangla dam (the watershed). The annual rainfall is spatially interpolated in the GIS environment to compute the annual available rainwater. Remote sensing technology is well suited to assessing the land cover and to acquiring topographic information. For geo-visualization, shuttle radar topographic mission (SRTM) elevation data were used. Moderate resolution imaging spectroradiometer (MODIS) sensor data were used to determine changes in the vegetation cover area of the watershed. The effect of both vegetation and rainfall parameters on the sediment load was observed, and erosion-prone areas were identified in this research.
2. Materials and methods
The study considers the collection of data through different approach and categories. Four types of data were acquired which are stated as follows. These have been used for the detail estimation of essential parameters.
Satellite data.
SRTM data.
Annual rainfall data.
Sediment load data.
MODIS images were used to classify the land cover features in the study area, and temporal MODIS images were used to detect changes. Six images acquired at one-year intervals from 2000 to 2005 were selected for this study. The SRTM data were used to generate the watershed area of the Mangla dam. Eight tiles of SRTM data were used to generate the watershed. The total annual rainfall data from 2000 to 2005 were used in this study to compute the available water for the watershed and to identify areas of heavy rains. Fourteen meteorological observatories were selected to acquire rainfall data. The sediment load data for the Mangla dam (Mangla dam Citation2008) were used to observe the effect of vegetation and rainfall on the sediment load. illustrates the general methodology of this research.
Figure 2. Methodology.
2.1. Watershed area
The SRTM data were taken in height files that contain topographic information about the region. To generate a digital elevation model (DEM), the SRTM data require processing. Using the Landserf software, the height tiles are first converted into Landserf format (“.srf”), and then voids in the data (due to sensor defects) are removed with the help of the software. The eight Landserf files are then converted to text files.
These text files contain latitude, longitude and elevation information for each pixel. A triangular unregulated network is generated from the text files in ArcGIS 9.1. Triangulated irregular network raster files are converted to DEM raster files and then converted into a single DEM file using the Mosaic tool.
ESRI's ArcHydro tool is used to extract the watershed area from the DEM. The first step in this process is to fill sinks, sudden changes in pixel height values in the DEM. Using hydrological modelling, the flow direction raster is generated from the DEM. The flow direction raster shows the actual direction of water flow. Each pixel in the flow direction raster is assigned a slope value.
The next process is the flow accumulation step. The flow accumulation is computed from the flow direction raster and contains the accumulated number of cells upstream of a particular cell.
By using this flow accumulation raster, the stream definition raster is generated. The stream definition function takes a flow accumulation raster as the input and creates a stream raster for a user-defined threshold. This threshold is defined either as a number of cells (default: 1%) or as a drainage area in square kilometres. In this study, the 1% default is selected.
To obtain a stream network for the study area, the stream segmentation raster is generated from the stream definition raster. This function links the stream definition raster to create stream networks for the area.
The catchments delineation raster is computed from the stream segmentation. The catchments raster delineation function creates a raster in which each cell carries a value that indicates which cells belong to the catchments. This value corresponds to the value carried by the stream segment that drains a particular area, as defined in the stream segment link raster.
To extract a polygon shape file of the catchments, the catchments polygon processing step is performed on the catchments delineation raster. Adjacent cells in the raster with the same raster code are combined into a single area, whose boundary is then vectorized. Single-cell polygons and “orphan” polygons generated as artefacts of the vectorization process are automatically dissolved; thus, at the end of the process, there is only one polygon per catchment.
The drainage lines are generated from the stream definition raster and the flow accumulation raster using the Archydro tool drainage line processing. The drainage line processing function converts the input stream link raster into a drainage line feature class. Each line in the feature class carries an identifier of the catchment in which it resides.
Finally, the watershed extraction is performed by the adjoint catchment processing function. The adjoint catchment processing function generates the aggregated upstream catchments from the “Catchment” feature class. For each catchment that is not a head catchment, a polygon representing the entire upstream area draining to its inlet point (reservoir) is constructed and stored in a feature class with an “Adjoint Catchment,” which represents the watershed of the Mangla dam (Indus Basin Citation2008; Mangla dam Citation2008). The Mangla watershed and its stream network are shown in .
2.2. Available rainwater
The annual available rainwater for the watershed was calculated from the annual rainfall data. Total rainfall data from 14 stations for 2000 to 2005 were acquired. Six raster files for each year from 2000 to 2005 were generated from the annual rainfall data with a projected coordinate system, “WGS 84 North UTM zone 43.”
To calculate the available rainwater, the watershed area was separated from the rainfall-interpolated raster files. Therefore, the rainwater was calculated using the “Area and Volume” function from the rainfall raster files. The available rainwater for the watershed for each year from 2000 to 2005 in million cubic meters is given in .
Table 1. Computed annual available rainwater.
2.3. Land cover classification
The land cover classification used to monitor the vegetative cover in the watershed area was performed using MODIS data. Seven MODIS images were used to classify the land cover.
To observe the land cover changes over the six-year study period, a supervised classification technique was adopted. Six images, as discussed previously, were used for classification. The band combination used for the interpretation was 7, 5, 3 of the MODIS data. All of the images were classified using the supervised classification technique. In this classification, the user must select the training area to specify a land cover feature; then, four classes are addressed, i.e., vegetation, snow, water body and bare land. All six MODIS images were classified according to these four classes. In the first step, spectral signatures were created for each image by selecting 10–15 training areas for each land cover feature, and then, using these signatures, the images were classified using ERDAS Imagine 8.7. The classification results of the vegetation cover area composed by the four land cover classes in square kilometres (km2) for all six images are given in .
Table 2. Land cover grades.
3. Results and discussion
The relationship between rainfall and vegetation has immense impact on soil erosion (de Asis & Omasa Citation2007). The exposed surface behaves differently than covered land by the rain drops and this behaviour rate of the surface is very much dependent on the intensity of rain. This study is performed on a mountainous watershed where the amount of rainfall also effects the vegetation, especially if mountains have light vegetation like grass and bushes.
3.1. Influence of rainfall on vegetation
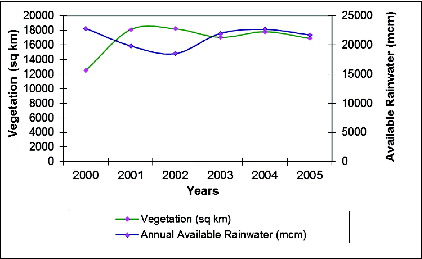
The vegetation trend is observed inversely proportional to rainfall water. The impact of rainfall on vegetation is shown in . It is observed that the vegetation-covered area in 2000 was 12,543 km2, and the annual available rainwater for the same year was 22,853 mcm. The amount of rain fall water available in the watershed in 2001 was 19,850 mcm, and the vegetation-covered area was 18,125 km2 which is greater than that of year 2000. In 2002, the vegetation trend remained the same as in previous years, with a decrease in the available rainwater to 18,533 mcm. Furthermore, there was an increase in the vegetation area to 18,228 km2. Again in 2003, the available rainwater increased to 21,983 mcm, and the vegetation decreased to 17,062 km2. The vegetation trend got changed slightly in 2004, with an increase in the amount of rainwater from 21,983 to 22,697 mcm. An upturn in vegetation was observed from 17,062 km2 for 2003 to 17,828 km2 for 2004. Besides, in 2005, the vegetation and rainwater both decreased, to 21,742 mcm (rainwater) and 16,915 km2 (vegetation).
Figure 3. Impact of rainfall on vegetation.
3.2. Influence of rainfall and vegetation on reservoir capacity
The comparison between sediment loads is performed differently because the data for sediment load is recorded as total load for two to three years gap rather than for single year gap by the Water and Power Development Authority (WAPDA). The relationship is made here by averaging the recorded sediments load data.
The sediment load for 2000 was 35 mcm with 12,543 km2 of vegetation-covered area, and the rainwater was 22,853 mcm. The sediment load, vegetation-covered area and rainfall are given in . The average vegetation-covered area for the years 2001 and 2002 was 18,177 km2, and the average rainwater for the same two years was 19,192 mcm, with total a sediment amount of 116 mcm. The average rainwater available from 2003 to 2005 was 22,141 mcm, and the average vegetation-covered area was 17,268 km2, while the total sediment load was 74 mcm. The sediment load has been observed greater with less in rainwater and with larger area covered by vegetation. Sediment load 116 mcm for year 2001–2002 is higher than other years with having maximum average vegetation covered area and minimum average rainwater available for watershed. The sediment loads that were calculated in the last three years (2003–2005) are almost same which was seen around 25 mcm each.
Table 3. Rain water and vegetation impact of sediment load.
Therefore, the results of the study assist to build an important relationship as follows:
During high rainfall in a low vegetation covered area, high soil erosion rates were registered due to the high surface runoff. Such imperative mechanisms of soil erosion ensure indicative messages for the prediction of sediments landing.
3.3. Identification of erosion-prone regions
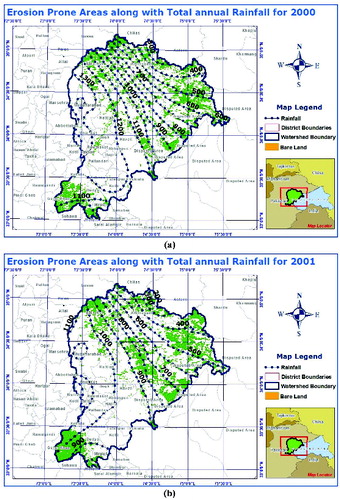
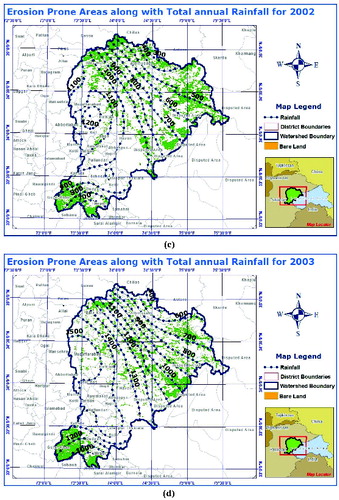
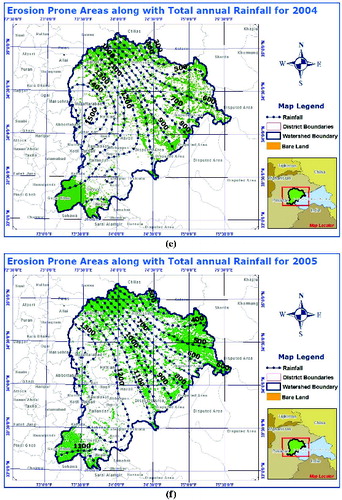
The erosion-prone areas had been identified individually for each year from 2000 to 2005. shows the erosion-prone areas and rainfall distribution maps. Six sub-figures included in the legend sequentially illustrate total yearly rainfall over and above the identified erosion-prone regions.
Figure 4. (a) Map of erosion-prone areas in 2000. (b) Map of erosion-prone areas in 2001. (c) Map of erosion-prone areas in 2002. (d) Map of erosion-prone areas in 2003. (e) Map of erosion-prone areas in 2004. (f) Map of erosion-prone areas in 2005.
4. Conclusions
Resource conservation has always been a critical issue for efficient preservation and utilization. Through this study, the effects of different sedimentation-related parameters in a local water reservoir have been shown. The incorporation of rainfall interpolation procedures has revealed the complex relationship between vegetation and available rainwater, demonstrating that a decrease in vegetation-covered area, added to high rainfall rates, can trigger the erosion process. Furthermore, usually, areas of high rainfall intensities always have a large surface of vegetation. The surface terrain presents dramatic changes in the research zone. The catchment area is covered by scattered vegetation cover (bushes and grass), which cannot stop runoff flow living out high levels of soil loss rates due to high anthropogenic impact.
With an increase in rainfall, the vegetation-covered area decreases dramatically, causing high runoff events and soil loss rates. Some of the main soil-producing areas were also identified along with the rainfall patterns. In the future, this work will be useful in term of decision-making in land management of new reservoirs, with similar conditions and constraints, applying the appropriate land preservation against the different forms of soil erosion in water shed.
Acknowledgements
The authors gratefully acknowledge the support by King Saud University, Deanship of Scientific Research, College of Engineering Research Center.
References
- Bookhagen B. 2010. Appearance of extreme monsoonal rainfall events and their impact on erosion in the Himalaya. Geomatics Nat Hazards Risk. 1:37–50.
- Dahal RK, Hasegawa S, Bhandary NP, Poudel PP, Nonomura A, Yatabe R. 2012. A replication of landslide hazard mapping at catchment scale. Geomatics Nat Hazards Risk. 3:161–192.
- Day JW, Kemp GP, Reed DJ, Cahoon DR, Boumans RM, Suhayda JM, Gambrell R. 2011. Vegetation death and rapid loss of surface elevation in two contrasting Mississippi delta salt marshes: the role of sedimentation, autocompaction and sea-level rise. Ecol Eng. 37:229–240.
- de Asis AM, Omasa K. 2007. Estimation of vegetation parameter for modeling soil erosion using linear Spectral Mixture Analysis of Landsat ETM data. ISPRS J Photogramm Remote Sens. 62:309–324.
- Fritz M, Herzschuh U, Wetterich S, Lantuit H, De Pascale GP, Pollard WH, Schirrmeister L. 2012. Late glacial and Holocene sedimentation, vegetation, and climate history from easternmost Beringia (northern Yukon territory, Canada). Quat Res. 78:549–560.
- Goldshleger N, Karnibad L, Shoshany M, Asaf, L. 2012. Generalising urban runoff and street network density relationship: a hydrological and remote-sensing case study in Israel. Urban Water J. 9:189–197.
- Haq IU, Ahmad F. 2004. Experience of the Mangla Dam watershed management project in Pakistan. In: Barker DH, Watson AJ, Sombatpanit S, Northcutt B, Maglinao AR, editors. Ground and water bioengineering for control and slope stabilization. Enfield, USA: Science Publishers, Inc.; p. 253–262.
- Indus Basin. 2008. Pakistan water and power development authority. [cited March 15]. Available from: http://www.waterinfo.net.pk/sites/default/files/knowledge/Indus%20Basin.PDF
- Islam ABMS, Hussain RR, Jumaat MZ, Rahman MA. 2013. Nonlinear dynamically automated excursions for rubber-steel bearing isolation in multi-storey construction. Autom Constr. 30:265–275.
- Islam ABMS, Jameel M, Jumaat MZ. 2012. Oil and gas energy potential at Malaysian seabed and Spar platform for deepwater installation. Int J Green Energy. 9:111–120.
- Islam ABMS, Jameel M, Jumaat MZ, Rahman MM. 2013. Optimization in structural altitude for seismic base isolation at medium risk earthquake disaster region. Disaster Adv. 6:23–34.
- Islam ABMS, Jameel M, Jumaat MZ, Shirazi SM, Salman FA. 2012. Review of offshore energy in Malaysia and floating Spar platform for sustainable exploration. Renew Sustain Energy Rev. 16:6268–6284.
- Jat MK, Khare D, Garg PK, Shankar V. 2009. Remote sensing and GIS-based assessment of urbanisation and degradation of watershed health. Urban Water J. 6:251–263.
- Khan SM. 1985. Management of river and reservoir sedimentation in Pakistan. Water Int. 10:18–21.
- Khosrokhani M, Pradhan B. 2013. Spatio-temporal assessment of soil erosion at Kuala Lumpur metropolitan city using remote sensing data and GIS. Geomatics Nat Hazards Risk. 5:252–270.
- Koehn K, Brye KR, Scarlat C. 2011. Quantification of stormwater runoff using a combined GIS and curve number approach: a case study for an urban watershed in the Ozark Highlands, USA. Urban Water J. 8:255–265.
- Mangla dam. 2008. Pakistan Water and Power Development Authority. [cited February 10]. Available from: http://www.waterinfo.net.pk/sites/default/files/knowledge/Mangla%20Dam.pdf
- Mangla dam. 2010. Pakistan water and power development authority, Tarbela, Pakistan [cited January 10]. Available from: http://en.wikipedia.org/wiki/Mangla_Dam
- Nasir A, Uchida K, Ashraf M. 2000. Estimation of soil erosion by using RUSLE and GIS for small mountainous watershed in Pakistan. Pak J Water Resour. 10:11–21.
- Noe GB. 2013. 12.21 Interactions among hydrogeomorphology, vegetation, and nutrient biogeochemistry in floodplain ecosystems. In: Shroder JF, editor. Treatise on geomorphology. San Diego (CA): Academic Press; p. 307–321.
- Nouri H, Beecham S, Kazemi F, Hassanli AM. 2012. A review of ET measurement techniques for estimating the water requirements of urban landscape vegetation. Urban Water J. 10:247–259.
- Pourghasemi H, Pradhan B, Gokceoglu C, Moezzi KD. 2012. A comparative assessment of prediction capabilities of Dempster–Shafer and weights-of-evidence models in landslide susceptibility mapping using GIS. Geomatics Nat Hazards Risk. 4:93–118.
- Sandoval S, Torres, A, Duarte M, Velasco A. 2013. Assessment of rainfall influence over water quality effluent of an urban catchment: a data driven approach. Urban Water J. 11:116–126.
- Tanaka N, Yagisawa J. 2010. Flow structures and sedimentation characteristics around clump-type vegetation. J Hydro-environ Res. 4:15–25.
- Tiwari AK, Risse LM, Nearing MA. 2000. Evaluation of WEPP and its comparison with USLE and RUSLE. Trans ASAE 2000 Am Soc Agric Eng. 45:1129–1135.
- Walling DE. 2008. The changing sediment loads of the world's rivers. Land Reclamation. 39:3–20.