
Abstract
The west coast of India is affected by tsunamigenic earthquake along the Makran subduction zone. On 28 November 1945 at 21:56 coordinated universal time (UTC), a massive Makran earthquake (M8.0) generated a destructive tsunami that propagated across the Northern Arabian Sea and the Indian Ocean. This tsunamigenic earthquake was responsible for the loss of life and great destruction along the coasts of India, Pakistan, Iran and Oman. Modelling of tsunami stages has been made for the coasts of Pakistan, Iran, India and Oman using NAMI-DANCE computer code. The fault parameters of the earthquakes for the generation of tsunami are epicentre (25.15° N, 63.48° E), fault area (200 km length and 100 km width), angle of strike, dip and rake (246°, 7° and 90°), focal depth (15 km), slip magnitude (7 m). The bathymetry data are taken from General Bathymetric Chart of the Oceans (GEBCO) and land topography data were collected using Shuttle Radar Topography Mission (SRTM). The present simulation is carried out for a duration of 360 min. It is observed that the maximum calculated tsunami run-ups were about 0.7–1.1 m along the coast of Oman, 0.5 m near Muscat, 0.1 m near Sur, 0.7–1.35 m along the western coast of India, 0.5–2.3 m along the southern coast of Iran and 1.2–5.8 m along the southern coast of Pakistan. After the tsunamigenic earthquake, the tsunami wave reached the Gulf of Kachchh in about 240 min, Okha in about 185 min, Dwarka in about 150 min, Porbandar in about 155 min, Mumbai in about 300 min and Goa in about 210 min. The calculated 2-hr tsunami travel time to the Indian coast is in good agreement with the available reports and published data. If the tsunami strikes during high tide, we should expect more serious hazards which would impact local coastal communities. The results obtained in this study are converted to be compatible with the geographic information system based applications for display and spatial analysis of modelling results. The paper also presents classification of tsunami risk zones based on elevation vulnerability. We expect that the results presented here will be supportive to the tsunami emergency response system and useful in planning the protection measures due to tsunami.
1. Introduction
Tsunami is a phenomenon of gravity waves produced in consequence of movement of the ocean floor. The giant tsunami in the Indian Ocean on 26 December 2004, claiming more than 225,000 lives (Titov et al. Citation2005; Geist et al. Citation2006; Okal & Synolakis Citation2008, Singh et al. Citation2012), has emphasized the urgent need for tsunami emergency response systems for various vulnerable coastlines around the world, especially for those neighbouring the Indian Ocean. The second deadliest tsunami prior to 2004 in South Asia occurred on 28 November 1945 (Heck Citation1947; Dominey-Howes et al. Citation2007; Heidarzadeh et al. Citation2007; Jaiswal et al. Citation2009; Hoffmann et al. Citation2013). It originated off the southern coast of Pakistan and was destructive in the Northern Arabian Sea and caused fatalities as far away as Mumbai (Berninghausen Citation1966; Quittmeyer & Jacob Citation1979; Ambraseys & Melville Citation1982; Heidarzadeh et al. Citation2008; Jaiswal et al. Citation2009). More than 4000 people were killed by both the earthquake and the tsunami (Ambraseys & Melville Citation1982). Several researchers have different estimates about the location of the earthquake epicentre. Heck (Citation1947) reported the epicentre at 25.00° N and 61.50° E. According to Pendse (Citation1948), the epicentre was at 24.20° N and 62.60° E, about 120 km away from Pasni. Ambraseys and Melville (Citation1982) reported the epicentre at 25.02° N and 63.47° E. By recalculating the seismic parameters of the 1945 earthquake, Byrne et al. (Citation1992) suggested that the epicentre was at 25.15° N and 63.48° E, which is used in the present study. The earthquake mainly affected the region between Karachi and the Persian border. In Karachi, ground motions lasted approximately 30 sec, stopping the clock in the Karachi Municipality Building and interrupting the communication cable link between Karachi and Muscat (Oman). According to Pendse (Citation1948), the tsunami that was generated reached a height of 12–15 m in Pasni and Ormara on the Makran coast and caused great damage to the entire coastal region of Pakistan. However, several researchers have estimated the tsunami height of about 5–7 m near Pasni (Page et al. Citation1979; Ambraseys & Melville Citation1982; Heidarzadeh et al. Citation2008b). The tsunami wave was observed at 8:15 am on Salsette Island, i.e. Mumbai, and reached a height of 2 m (Jaiswal et al. Citation2009; Newspaper archives, Mumbai).
Furthermore, tsunami waves reached a height of about 11–11.5 m in the Gulf of (Kutch) Kachchh, Gujarat (Pararas-Carayannis Citation2006; Jaiswal et al. Citation2009). The tsunami reached as far south as Mumbai, Bombay Harbour, Versova (Andheri), Haji Ali (Mahalaxmi), Juhu (Ville Parle) and Danda (Khar). There was no report on damage at Bombay Harbour. Five people died at Versova (Andheri, Mumbai), and six more at Haji Ali (Mahalaxmi, Mumbai); several fishing boats were torn off their moorings at Danda and Juhu.
Pendse (Citation1948) has reports that the first wave reached Pasni on the Makran coast about half an hour after the earthquake, but greater damage was caused by a wave that came 3.25 h after the first. Ambraseys and Melville (Citation1982) also state that the first wave did not cause much damage. They report that two destructive waves arrived 90–120 min after the first at Pasni and Ormara. Further, they report that high waves persisted for a long duration at Karachi. Pendse (Citation1948) concurs and notes the times of a series of high waves that struck there for a period of ∼3 h after the arrival of the initial wave. On the other hand, only one high wave was reported (Pendse Citation1948; Ambraseys & Melville Citation1982) from Mumbai.
The oldest known tsunami in the region may have been generated by a large-magnitude earthquake, which occurred in the Indus delta/Kachchh region in 326 BC. Alexandra's fleet was washed away by the oldest tsunami of the Arabian Sea. Destructive earthquakes and tsunami have occurred in the North Arabian Sea throughout geologic history and in recent times. Many of these events have not been adequately documented. On the western side of India, the earthquakes of 1524 and 1819 in the Kachchh region probably generated destructive tsunamis (Jaiswal et al. Citation2009). Many researchers (Rastogi & Jaiswal Citation2006; Benjamin Citation2008; Heidarzadeh et al. Citation2008a) have studied historical tsunamis in the Arabian Sea that affected the western coast of India ().
Table 1. Historical tsunami that affected the western coast of India.
Although large earthquakes along the Makran subduction zone (MSZ) are infrequent, the potential for the generation of destructive tsunamis in the northern Arabian Sea cannot be ruled out. It is quite possible that historical tsunamis in this region have not been properly reported or documented. Such past tsunamis very likely affected southern Pakistan, India, Iran, Oman, and possibly other areas as well (Hoffmann et al. Citation2013). Smith et al. (Citation2013) argued that the MSZ has the potential to generate earthquakes similar in magnitude to the 2004 Andaman–Sumatra subduction zone. Furthermore, tsunami hazard assessment studies along the MSZ revealed that the southern coast of Iran and Pakistan, as well as Muscat and Oman are the most vulnerable areas (Heidarzadeh et al. Citation2008b, Citation2009; Heidarzadeh & Kijko Citation2011). The seismotectonics of the MSZ, historical earthquakes in the region and the recent earthquake of 24 September 2013 are indicative of the active tectonic collision process that is taking place along the entire southern and south-eastern boundary of the Eurasian plate as it collides with the Indian plate and the adjacent microplates. In view of this, an attempt is made to generate tsunami risk zone maps for the Gujarat state, which hosts the longest coastline of about 1600 km in India. These maps will be useful to the tsunami emergency response system and in planning the protection measures due to tsunami.
2. Demand for tsunami risk 3D visualizations
Gujarat state has the longest coastline in India, and has massive capital and infrastructure investments in its coastal regions (Singh et al. Citation2008). With rapid developmental activities along the coastline of Gujarat, there is a need for preparing tsunami risk three-dimensional (3D) visualization database using geoinformation technology. The coast of Gujarat has experienced many disasters in the past (e.g. Singh et al. Citation2008). Some of the most devastating disasters that have struck the state in the last few decades include the Morbi floods of 1978; the Kandla (port) cyclone of 1998; the killer earthquake in Kutch, 26 January 2001; and the flash floods in South Gujarat in 2005 and Surat in 2006. The coast of Gujarat was also affected by tsunami in the past (Singh et al. Citation2008; Jaiswal et al. Citation2009; Patel et al. Citation2010, Citation2013). Visualization is the graphical presentation of information, with the goal of improving the viewer's understanding of the information contents. Comprehension of 3D visualized models is easier and more effective than 2D models. 3D visualization models are important tools to simulate disasters from different angles that help users to comprehend the situation in more detail and help decision-makers plan for appropriate rescue operations. 3D visualizations are tools for rescue operations during disasters, e.g., cyclone, tsunami, earthquake, flooding, fire, etc. (Patel et al. Citation2013).
Thus, 3D graphical representations significantly reduce the amount of cognitive effort and improve the effectiveness of the communication tool (Raper Citation1989; Zlatanova et al. Citation2005; Zlatanova Citation2006; Marincioni Citation2007; Kolbe et al. Citation2008). For example, city and building models created by CAD software and scanned into a -computer from real-world objects; convey information that is useful to the decision-making process in natural disaster risk assessment and management.
3. Methodology
3.1. Numerical modelling
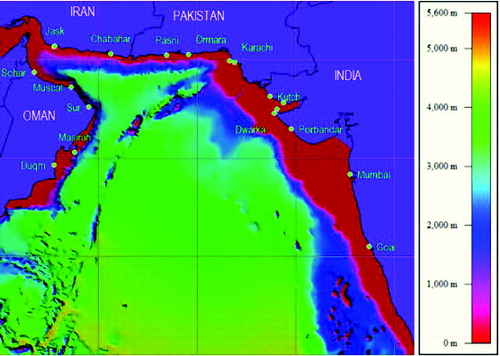
In the present study, 17 tsunami forecast stations were selected for output of tsunami simulation along the coast of India, Pakistan, Oman and Iran. Most of the tsunami forecast stations were selected in such a way that sea depth is less than 10.0 m to better examine the tsunami effect (Onat & Yalciner Citation2012). The location of tsunami forecast points along the west coast of India including Pakistan, Iran and Oman is illustrated in and given in . Bathymetry and elevation data are the principal data-sets required for the model to capture the generation, propagation and inundation of the tsunami wave from the source to the land. The bathymetry database taken from General Bathymetric Chart of the Oceans (GEBCO) 30 sec is used for tsunami modelling and the topography data taken from SRTM 90 m resolution is used for preparation of the inundation map. The bounding coordinates selected are 55°–76° E longitudes and 10°–30° N latitudes. The rupture parameters are taken from Byrne et al. (Citation1992), which were used to model the source of the 1945 earthquake in this study (). The initial wave amplitude (elevation and depression) for the source is computed using Okada (Citation1985) method. The water elevation in the source is about 3 m, and the depression is about 1 m.
Table 2. Locations and depth of forecast points.
Table 3. The rupture parameter of 1945 Makran earthquake provided by Byrne et al. (Citation1992).
Figure 1. Tsunami forecast points indicated by circles, where the time series for tsunami run-up were calculated and presented in .
Furthermore, tsunami simulation basically aims to calculate the tsunami heights and its arrival times in space and time. The tsunami is assumed as a shallow water wave, where wavelength is much larger than the depth of the sea floor. The governing equations in tsunami numerical modelling are non-linear forms of shallow water equations with a friction term. The formulas are solved in Cartesian coordinate system (Imamura et al. Citation2006). Based upon these approximations and neglecting the vertical acceleration, the equations of mass conservation and momentum in the 3D problem are given as follows:
Continuity equation:(1)
Momentum equation:(2)
(3)
(4)
(5) where x and y are the horizontal axes; z is the vertical axis; t is the time; h is the still water depth; η is the vertical displacement of water surface above the still water surface; u, v and w are the water particle velocities in x, y and z directions, respectively; g is the gravitational acceleration and g is the gravitational acceleration and D is the total water depth given by h + η.
In this study, the NAMI DANCE was used for simulation and efficient visualization of tsunamis, and understanding and investigation of tsunami generation and propagation mechanisms. This code is developed by Profs. Andrey Zaytsev, Ahmet Yalciner, Anton Chernov, Efim Pelinovsky and Andrey Kurkin in collaboration with Ocean Engineering Research Center, Middle East Technical University, Turkey and Institute of Applied Physics, Russian Academy of Science, Russia, especially for tsunami modelling (Yalciner et al. Citation2006b). It has advantages to simulate, animate, and visualize the generation, propagation, coastal amplification and inundation of tsunami in a given arbitrary shaped bathymetry under the input wave and current conditions (Yalciner et al. Citation2006a).
3.2. GIS/CAD-based 3D modelling
3.2.1. Raster layer operation
The first step of raster layer operation is geo-referencing of satellite images. Satellite images collected from Google Earth orthophotos were used for geo-referencing. Nine pairs of images (RGB, jpeg format) from Google Earth cover the study area. There was an average of 12 ground control points (GCPs) collected for each image registration. The World Geodetic System 84 (WGS84) geographic projection was selected for image-to-image registration with Digital Globe image. After creating the geo-referenced images, all images are mosaicked to generate a whole geo-referenced image. The next step of raster layer operation is the digital elevation model (DEM) generation. A DEM is defined as a file or a database containing points over contiguous areas (Manual of photogrammetry Citation2004). The needed field height data for DEM generation can be obtained from point, line or polygonal vector height maps or stereo satellite/vector images. The SRTM data were used to create DEM. The geo-referenced image and DEM results constitute the basis of vector layer operations. This study uses SRTM data to generate the tsunami risk zone map.
3.2.3. Vector layer operation
The purpose of 3D GIS/CAD modelling was the thematic visualization of the disaster vulnerability of Okha generated from a 3D model. The geo-referenced image of the Okha coast was used for 2D building footprint in AutoCAD Map 3D. AutoCAD Map 3D provides access to geographic information system (GIS) and mapping data to support planning, design and data management. The building footprint layer was generated according to height value governed by the number of floors to create 3D building shapes.
4. Results and discussion
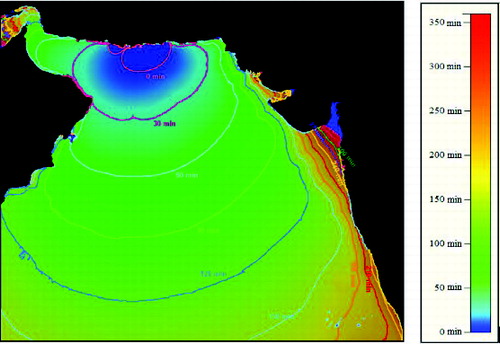
Tsunami snapshots show that the 1945 Makran event affected all the neighbouring countries including Iran, Oman, Pakistan and India (). The results of initial tsunami generation based on the fault parameters given by Byrne et al. (Citation1992) are shown in (a). Tsunami snapshots ((b)–(f)) show the estimated wave propagation at t = 30, 60, 90, 120 and 150 min after the tsunamigenic earthquake, respectively. Along the southern coast of Pakistan, the tsunami wave reaches Pasni in about 5–15 min, Ormara in about 60 min and Karachi in about 110 min. While along the southern coast of Iran, the tsunami wave reaches Chabahar in about 30–35 min and Jask in about 70–75 min. After the earthquake, the tsunami wave reaches the coast of Oman, namely at Muscat, in about 40 min, Sur in about 30–40 min, Masirah in about 60–70 min, Sohar in about 80 min and Duqm in about 130 min. Furthermore, the tsunami wave reaches the western coast of India along the Gulf of Kachchh in about 240 min, Okha in about 185 min, Dwarka in about 150 min, Porbandar in about 155 min, Mumbai in about 300 min and Goa in about 215 min. It is also observed that the distance from epicentre to Mumbai is less than Goa, but the arrival time of the first tsunami wave at the Mumbai is more than Goa. It could be due to the fact that Mumbai offshore is shallower that Goa and also due to the directivity of tsunami wave propagation. It is well known that most of the tsunami's energy travels perpendicular to the strike of the fault which is due to directivity (Ben-Menahem & Rosenman Citation1972; Singh et al. Citation2012). Due to this effect, most of the tsunami energy propagates in the direction shown in . The tsunami travel time map is shown in . It is clear from the map that closely spaced contours along the western part of India may be due to shallower bathymetry features or any natural barrier. It is also noticed from that the ocean depth suddenly changes from deeper (>2000 m) to shallower depth (<225 m) along the western part of India. Several researchers reported that the delay in the tsunami arrival from MSZ was probably due to a submarine landslide generated by the earthquake (Bilham et al. Citation2007; Neetu Citation2011).
Figure 2. Results of the tsunami generation (a) and propagation modelling (b)–(f).
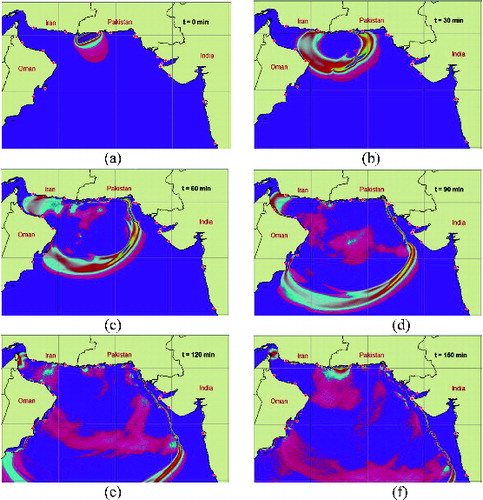
Figure 3. Direction of tsunami's energy propagation.
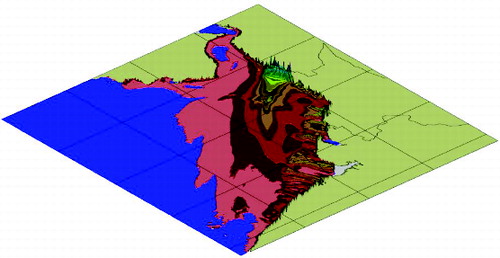
Figure 4. Tsunami travel time contour map.
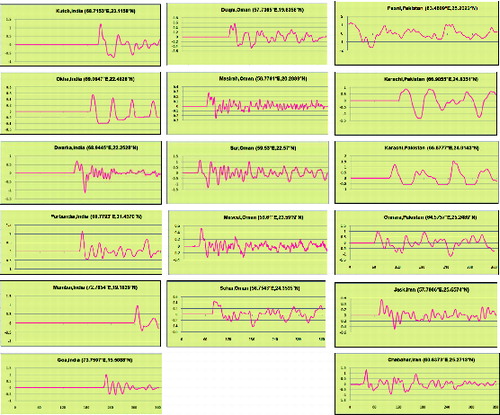
shows the maximum calculated tsunami run-ups along the neighbouring countries including Iran, Oman, Pakistan and India for a tsunami simulation of 360 min. The simulated results show that the maximum tsunami height is about 5–6 m near the southern coast of Pakistan ( (d)), which is corroborated with the previous researchers in the same region (Page et al. Citation1979; Ambraseys & Melville Citation1982; Heidarzadeh et al. Citation2008b). The maximum calculated tsunami run-ups were about 0.7–1.1 m along the coast of Oman, 0.7–1.35 m along the western coast of India, 0.5–2.3 m along the southern coast of Iran and 1.2–5.8 m along the southern coast of Pakistan, as shown in (a)–(d), respectively. The tsunami run-up along the southern coast of Pakistan is far larger than that along the other coasts and may be due to the directivity of the tsunami. The time series for tsunami forecast points along Pakistan, India, Iran and Oman are presented in . The tsunami run-up and its arrival time at various tide gauge stations are listed in .
Table 4. The maximum tsunami run-up and its arrival time at various forecast points.
Figure 5. Bathymetry map in and around the study region.

Figure 6. Maximum calculated tsunami run-up for a tsunami simulation of 360 min.
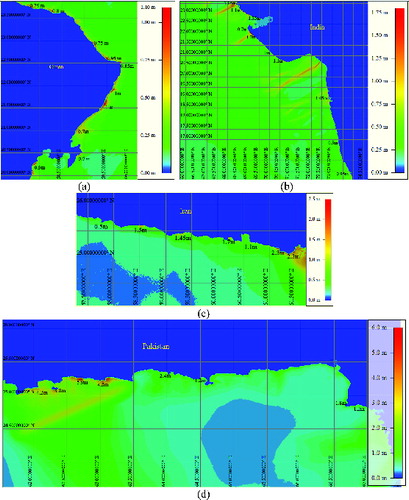
Figure 7. Time series of the calculated tsunami run-up at several locations along the coast of Iran, Oman, Pakistan and India.
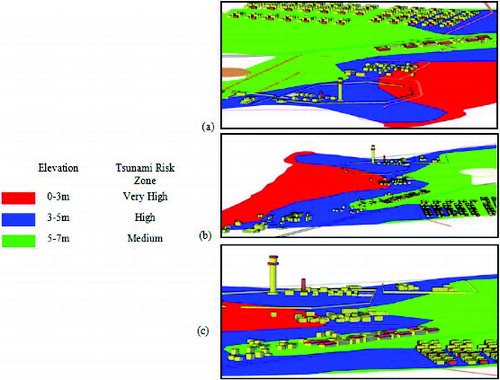
It is believed that the digital topographical data are very important in detecting tsunami-prone area. The SRTM data are used to provide digital elevation information. Based on the processed SRTM data in GIS/CAD, all low-lying coastal areas potentially at risk of tsunami flooding have been identified and are shown in . The classification of tsunami risk zone is based on elevation vulnerability followed by Sinaga et al. (Citation2011). However, for high-resolution mapping of tsunami risk zone along the coastal region, very-high-resolution topographical data and satellite images are needed. In this study, we developed the methodology for creation of 3D infrastructure located in tsunami risk zones using easily available and low-cost Google earth images and SRTM data in AutoCAD Map 3D software. The 3D tsunami risk model of Okha at different viewing angles is presented in (a)–(c). A red, blue or green colour scheme was used to indicate the respective susceptibility to tsunami risk as shown in . It shows structures that are classified as very high risk, high risk and medium risk based on tsunami run-up height.
Figure 8. Classification of tsunami risk zone.
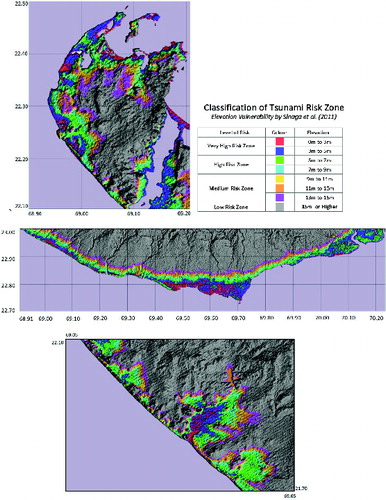
Figure 9. Visualization of 3D tsunami risk model of Okha with different viewing angles. To view this figure in colour, please see the online version of the journal.
5. Conclusions
The 1945 Makran tsunamigenic earthquake is modelled using rupture parameters suggested by Byrne et al. (Citation1992). In most cases, the coastal regions which are far from the source have smaller tsunami height and longer tsunami travel times compared with the coastal regions near the source that have higher tsunami heights and shorter tsunami travel times. As a part of a tsunami emergency response system, the 3D coastal maps should be produced for countries in the vicinity of the MSZ, namely Pakistan, India, Iran and Oman. The lessons learnt from the December 2004 tsunami could be used for future planning. Ports, jetties, estuarine areas, river deltas and population in and around the coast of Pakistan, India, Iran and Oman could be protected with proper methods of mitigation and disaster management. In the future, scientists/researchers need to focus on 3D visualization and animation of tsunami risk. The study was performed to show the advantages of 3D GIS/CAD models and satellite images in tsunami risk assessment of the Okha coast, Gujarat. The main aim of the 3D Okha model is to visualize each building's tsunami risk level which improves decision-maker's understanding of the disaster level. Merging of SRTM elevation data with satellite images is suitable for tsunami risk zone classification. Combining the advanced computer-aided modelling, GIS-based modelling, marine parameter measurements by ocean bottom seismometers and satellite, installations of tide gauges and tsunami detection systems and also using conventional and traditional knowledge, it is possible to develop a suitable tsunami disaster management plan.
Acknowledgements
The authors thank Profs Andrey Zaytsev, Ahmet Yalciner, Anton Chernov, Efim Pelinovsky and Andrey Kurkin for providing NAMI-DANCE software and for their valuable assistance in tsunami numerical modelling of this study. Profs Nobuo Shuto, Costas Synolakis, Emile Okal and Fumihiko Imamura are acknowledged for invaluable endless collaboration. The VMP is grateful to Dr B. K. Rastogi, Director General, Institute of Seismological Research (ISR), for permission to use ISR library and other resource materials. A. P. Singh is thankful to Director General, ISR, for permission and encouragement to conduct such studies for the benefit of science and society.
References
- Ambraseys NN, Melville CP. 1982. A history of Persian earthquakes. Cambridge (NY): Cambridge University Press; p. 219.
- Benjamin J. 2008. Tsunamis of the Arabian Peninsula: a guide of historic events. Sci Tsunami Hazard. 27(1):31–46.
- Ben-Menahem A, Rosenman M. 1972, Amplitude patterns of tsunami waves from submarine earthquakes. J Geophys Res. 77:3097–3128.
- Berninghausen WH. 1966. Tsunamis and seismic seiches reported from regions adjacent to the Indian Ocean. Bull Seismol Soc Am. 56:69–74.
- Bilham R. 1999. Slip parameters for the Rann of Kachchh, India, 16 June 1819 earthquake quantified from contemporary accounts. In: Stewart IS, Vita-Finzi C, editors. Coastal tectonics. London (UK): Geological Society (Special Publication); p. 295–318.
- Bilham R, Lodi S, Hough S, Bukhary S, Khan AM, Rafeeqi SFA. 2007. Seismic hazard in Karachi, Pakistan: uncertain past, uncertain future. Seismol Res Lett. 78:601–613.
- Byrne DE, Sykes LR, Davis DM. 1992. Great thrust earthquakes and a seismic slip along the plate boundary of the Makran subduction zone. J Geophys Res. 97: 449–478.
- Dominey-Howes D, Cummins P, Burbidge D. 2007. Historic records of teletsunami in the Indian Ocean and insights from numerical modelling. Nat Hazard. 42:1–17.
- Geist E, Titov V, Synolakis C. 2006. Tsunami: wave of change. Sci Am. 294:56–63.
- Heck NH. 1947. List of seismic sea wave. B Seismol Soc Am. 37:269–284.
- Heidarzadeh M, Kijko A. 2011. A probabilistic tsunami hazard assessment for the Makran subduction zone at the northwestern Indian Ocean. Nat Hazard. 56:577–593.
- Heidarzadeh M, Pirooz MD, Zaker N, Mokhtari M. 2007. Evaluating the potential for tsunami generation in southern Iran. Int J Civil Eng. 5:312–329.
- Heidarzadeh M, Pirooz MD, Zaker NH, Yalciner AC, Mokhtari M, Esmaeily A. 2008a. Historical tsunami in the Makran subduction zone off the southern coasts of Iran and Pakistan and results of numerical modeling. Ocean Eng. 35:774–786.
- Heidarzadeh M, Pirooz M, Zaker NH, Synolakis C. 2008b. Evaluating tsunami hazard in the northwestern Indian Ocean. Pure Appl Geophys. 165:2045–2058.
- Heidarzadeh M, Pirooz M, Zaker NH, Yalciner AC. 2009. Preliminary estimation of the tsunami hazards associated with the Makran subduction zone at the northwestern Indian Ocean. Nat Hazard. 48:229–243.
- HoffmannG, RupprechterM, Al Balushi N, Grützner C, Reicherter K. 2013. The impact of the 1945 Makran tsunami along the coastlines of the Arabian Sea (northern Indian Ocean) – a review. Z Geomorphol. 57:257–277.
- Imamura F, Yalciner AC, Ozyurt G. 2006. Tsunami modeling manual. Manual (TUNAMI-N2 model), April. p. 58.
- Jaiswal RK, Rastogi BK, Singh AP. 2008. Past tsunamis in the Arabian Sea and future possibilities. Indian Miner. 61–62:75–82.
- Jaiswal RK, Singh AP, Rastogi BK. 2009. Simulation of the Arabian Sea tsunami propagation generated due to 1945 Makran earthquake and its effect on western parts of Gujarat (India). Nat Hazard. 48:245–258.
- Jaiswal RK, Singh AP, Rastogi BK, Murty TS. 2011. Aftershock sequences of two great Sumatran earthquakes of 2004 and 2005 and simulation of the minor tsunami generated on September 12, 2007 in the Indian Ocean and its effect. Nat Hazard. 57(1):7–26.
- Kolbe TH, Gröger G, Plümer L. 2008. CityGM - 3D city models and their potential for emergency response. In: Zlatanova S, Li J, editiors. Geospatial information technology for emergency response. London: Taylor & Francis; p. 257–274.
- Manual of Photogrammetry. 5th ed. 2004. American Society for Photogrammetry and Remote Sensing ASPRS, Falls Church, Virginia; p. xvi + 1151.
- Marincioni F. 2007. Information technologies and the sharing of disaster knowledge: the critical role of professional culture, disasters. Disasters. USA: Blackwell Publishing; p. 459–476.
- Murty TS, Bapat A, Prasad V. 1999. Tsunamis on the coastlines of India. Sci Tsunami Hazard. 17:167–172.
- Murty T, Rafiq M. 1991. A tentative list of tsunamis in the marginal seas of the north Indian Ocean. Nat Hazard. 4:81—83.
- Neetu S, Suresh I, Shankar R, Nagarajan B, Sharma R, Shenoi SSC, Unnikrishnan AS, Sundar D. 2011. Trapped waves of the 27 November 1945 Makran tsunami: observations and numerical modeling. Nat Hazard. 59:1609–1618.
- Okada Y. 1985. Surface deformation due to shear and tensile faults in a half-space. Bull Seismol Soc Am. 5:1135–1154.
- Okal EA, Fritz HM, Raad PE, Synolakis C, Al-Sheibli Y, Al-Saifi M. 2006. Oman field survey after the December 2004 Indian Ocean Tsunami. Earthquake Spectra. 22:S203–S218.
- Okal EA, Synolakis CE. 2008. Far-field tsunami hazard from mega-thrust earthquakes in the Indian Ocean. Geophys J Int. 172:995–1015.
- Onat Y, Yalciner AC. 2012. Tsunami analysis for southern Aegean Sea. In: Proceedings of twenty-second (2012) international offshore and polar engineering conference; 2012 June 17–22; Rhodes (Greece). p. 236–241.
- Page WD, Alt JN, Cluff LS, Plafker G. 1979. Evidence for the recurrence of large magnitude earthquakes along the Makran Coast of Iran and Pakistan. Tectonophysics. 52:533–547.
- Pararas-Carayannis G. 2006. The potential of tsunami generation along the Makran subduction zone in the northern Arabian Sea – case study: the earthquake of November 28, 1945. Sci Tsunami Hazard. 24:358–384.
- Patel VM, Dholakia MB, Singh AP. 2013. Tsunami risk 3D visualizations of Okha coast, Gujarat (India). Int J Eng Sci Innov Technol. 2:130–138.
- Patel VM, Patel HS, Singh AP. 2010. Tsunami propagation in Arabian Sea and its effect on Dwarka city of Gujarat, India. Int J Adv Struct Eng. 2:163–174.
- Pendse CG. 1946. The Mekran earthquake of the 28th November 1945. India Meteorol Depart Sci Notes. 10(125):141–145.
- Pendse CG. 1948. The Mekran earthquake of the 28th November 1945. Scientific Notes Indian Met. Deptt. 10:141–145.
- Pendse CG. 1948. The Mekran earthquake of the 28th November 1945. Sci Notes. X.
- Quittmeyer RC, Jacob KH. 1979. Historical and modem seismicity of Pakistan, Afghanistan, northwestern India, and southeastern Iran. Bull Seismol Soc Am. 69:773–823.
- Raper JF. 1989. The 3D geoscientific mapping and modeling system: a conceptual design, In: Raper JF, editor. Three-dimensional applications in geographical information systems. London: Taylor and Francis; p. 11–20.
- Rastogi BK, Jaiswal R. 2006. A catalog of tsunamis in the Indian Ocean. Sci Tsunami Hazard. 25:128–143.
- Sinaga TPT, Nugroho A, Lee Y-W, Suh Y. 2011. GIS mapping of tsunami vulnerability: case study of the Jembrana Regency in Bali, Indonesia. KSCE J Civil Eng. 15:537–543.
- Singh AP, Bhonde U, Rastogi BK, Jaiswal RK. 2008. Possible inundation map of coastal areas of Gujarat with a tsunamigenic earthquake. Indian Minerals. 61(3–4) & 62(1–4), p. 59–64.
- Singh AP, Murty TS, Rastogi BK, Yadav RBS. 2012. Earthquake generated tsunami in the Indian Ocean and probable vulnerability assessment for the east coast of India. Mar Geod. 35:49–65.
- Smith GL, McNeill LC, Wang K, He J, Henstock TJ. 2013. Thermal structure and mega thrust seismogenic potential of the Makran subduction zone. Geophys Res Lett. 40(8): 1528–1533.
- Titov VV, Rabinovich AB, Mofjeld HO, Thomson R, González1 F. 2005. Global reach of the 26 December 2004 Sumatra tsunami. Science. 309:2045–2048.
- Walton HI. 1864. Transactions of the Bombay Geographical Society from January 1863 to December 1864. Byculla: Education Society's Press.
- Yalciner AC, Karakus H, Kuran U. 2006a. Modeling of tsunamis in the eastern Mediterranean and comparison with Caribbean. In Mercado A, Liu PL, editors. Caribbean tsunami hazard. World Scientific; p. 326–340.
- Yalciner AC, Pelinovsky E, Zaytsev A, Chernov A, KurkinA, Ozer C, Karakus H. 2006b. NAMI DANCE Manual. Ankara, Turkey: METU, Civil Engineering Department, Ocean Engineering Research Center. Available from: http://namidance.ce.metu.edu.tr
- Zlatanova S, Fabbri A, Li J. 2005. Geo-information for disaster management: large scale 3D data needed by urban areas. GIM Int. 19:10–13.
- Zlatanova S, van Oosterom P, Verbree E. 2006. Geoinformation supports management of urban disasters. Open House Int. 31:62–79.