
Abstract
The main purpose of this study is to assess forest fire susceptibility maps (FFSMs) and their performances comparison using modified analytical hierarchy process (M-AHP) and Mamdani fuzzy logic (MFL) models in a geographic information system (GIS) environment. This study was carried out in the Minudasht Forests, Golestan Province, Iran, and was conducted in three main stages such as spatial data construction, forest fire modelling using M-AHP and MFL, and validation of constructed models using receiver operating characteristic (ROC) curve. At first, seven conditioning factors, such as altitude, slope aspect, slope angle, annual temperature, wind effect, land use, and normalized different vegetation index, were extracted from the spatial database. In the next step, FFSMs were prepared using M-AHP and MFL modules in a Netcad-GIS Architect environment. Finally, the ROC curves and area under the curves (AUCs) were estimated for validation purposes. The results showed that the AUCs for MFL and M-AHP are 88.20% and 77.72%, respectively. The results obtained in this study also showed that the MFL model performed better than the M-AHP model. These FFSMs can be applied for land use planning, management, and prevention of future fire hazards.
1. Introduction
Forests are major natural resources which play a crucial role in maintaining environmental balance. The health of forest in a given area is a true indicator of the ecological condition prevailing in that area (Saklani Citation2008). In general, fire is a natural component of many forest ecosystems and cannot be avoided (Dimopoulou & Giannikos Citation2001). Forest fires cause major damages to environment, human health and property, and endanger life (Rawat Citation2003). Six million square kilometre of forests has been lost around the world in less than 200 years mainly due to forest fire (Dimopoulou & Giannikos Citation2002). In Iran, forest fire is one of the most natural occurring hazards. According to the ECE/FAO database (Economic Commission for Europe/ Food and Agriculture Organization) on forest fires in 1982–1995, the number of forest fires per year is 130 and the burnt average area and its maximum is 54 km2 and 330 km2, respectively (Allard Citation2001). During the period 1991–1997, nearly 3063 fires have been reported, of which 13,700 ha was burnt. In the year 1998, there were 998 fires reported and the burnt area was estimated at 206,713 ha covering mostly shrubs. Losses were estimated at more than 5.6 million Rials (almost USD 3200 in the year of 1998), including 8761 tons of cattle feed lost (Allard Citation2001). In a recent paper, Janbaz Ghobadi et al. (Citation2012) reported that, in the last decade, 9086 ha of the forests have been affected by forest fire. Also, in Iran, it is difficult to control forest fire naturally; however, it is possible to map different hazard levels for minimizing fire hazards and avoid potential damage.
In the literature, several different methods and techniques for forest fire susceptibility and risk mapping have been proposed and tested. Many studies have evaluated forest fire using geographic information system (GIS) and remote sensing (RS) technologies (Chuvieco & Congalton Citation1989; Prosper-Laget et al. Citation1995; Castro & Chuvieco Citation1998; Jaiswal et al. Citation2002; Erten et al. Citation2004; Wulder & Franklin Citation2006; Pradhan et al. Citation2007; Razali Citation2007; Saklani Citation2008; Chuvieco et al. Citation2010; Pradhan & Assilzadeh Citation2010; Adab et al. Citation2013; Teodoro & Duarte Citation2013). Several studies have applied probabilistic-based models such as fuel moisture content (FMC), fire area simulator (FARSITE), and Maxent models (Chuvieco et al. Citation2004; García et al. Citation2008; Krasnow et al. Citation2009; Renard et al. Citation2012).
In the past decade, some methods, such as artificial neural networks (ANNs) (Betanzos et al. Citation2002; Maeda et al. Citation2009; Bisquert et al. Citation2012; Safi & Bouroumi Citation2013), fuzzy logic (Nadeau et al. Citation2005; Carvalho et al. Citation2006; Agarwal et al. Citation2013), and adaptive neuro-fuzzy inference system (ANFIS) (Angayarkkani & Radhakrishnan Citation2011), have been proposed. Recently, new forest risk assessment methods, such as support vector machine (SVM) (Cortez & Morais Citation2007; Koetz et al. Citation2008; Zhao et al. Citation2011), decision tree methods (Stojanova et al. Citation2006), and random forest (Cortez & Morais Citation2007; Pierce et al. Citation2012; Leuenberger et al. Citation2013), were employed and their performances were assessed.
The aim of the current research is to assess forest fire susceptibility maps (FFSMs) using modified analytical hierarchy process (M-AHP) and Mamdani fuzzy logic (MFL) models developed in Netcad GIS 6. The assessment was performed in the Minudasht forests situated in Golestan Province, Iran. The main difference between this research and the approaches described in the aforementioned publications is that an M-AHP model is applied and the result is compared with MFL model in the study area. Also, expert opinions are used in the mentioned models for defining the rules and conditioning factor scores in MFL and M-AHP models, respectively. This contribution provides originality to this study.
2. Study area
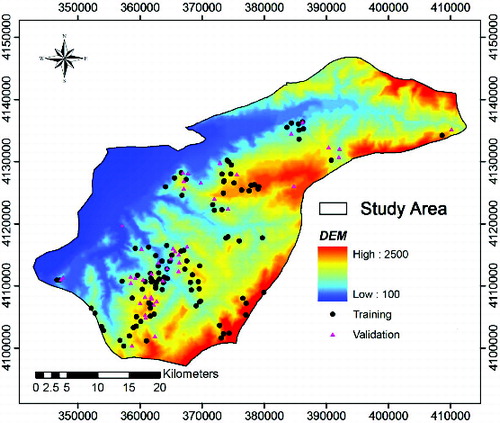
The study area is located in the eastern part of Golestan Province, in the north of Iran, between latitudes 37° 00′ 27″ to 37° 27′ 53″ N, and longitudes 55° 14′ 00″ to 56° 00′ 39″ E (). It covers an area about 1531 km2. This county shares boundaries with other Golestan Province counties such as Kalaleh county in the north and Azadshahr county in the west (Shadman Roodposhti et al. Citation2014). The elevation of the study area ranges between 100 and 2500 m above the mean sea level. The climate of Minudasht ranges between temperate and semi-humid types. The mean annual precipitation within the study area varies from 138 to 335 mm (Shadman Roodposhti et al. Citation2014). Based on Iranian Meteorological Organization, maximum and minimum of temperature were reported as +40 and −5 °C, respectively. Agriculture is the main economic activity of the region. In addition, part of the Golestan National Park is located within the county and it is known as tropical dry forests.
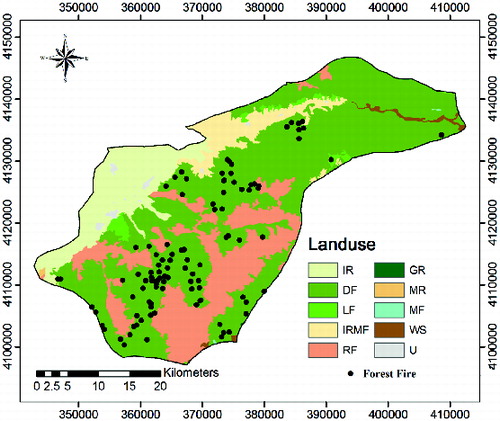
Figure 1. Forest fire location (black and pink dots) map in the study area. Modified from Pourtaghi et al. (Citation2014). To view this figure in colour, please see the online version of the journal.
3. Methodology
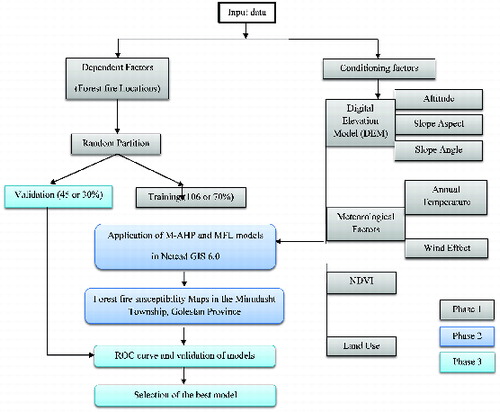
The overall methodology flow chart of the study is shown in . The flowchart consists of three phases: (1) data integration and analysis, (2) forest fire susceptibility modelling using M-AHP and MFL approaches, and (3) validation of the constructed models using receiver operating characteristic (ROC) curve.
Figure 2. Flow chart of used methodology in the study area.
3.1. Data integration and analysis
In general, data collection and construction of a database of effective factors in any study area are the most important parts of the process (Ercanoglu & Gokceoglu Citation2002). At first, fire occurrences and locations were collected from MODIS (Moderate-Resolution Imaging Spectro Radiometer) satellite images (collected in year 2010), extensive field surveys, and national reports. Forest fires are related to year 2010, at 1:25,000 scale (). Out of 151 forest fire locations, 70% were used in the model training and the remaining 30% were used for validation (Pourghasemi et al. Citation2012a; Zare et al. Citation2012; Pourghasemi et al. Citation2014; Regmi et al. Citation2014). For FFSM in the study area, seven effective factors were considered. These factors include altitude, slope aspect, slope angle, annual temperature, wind effect, land use, and normalized different vegetation index (NDVI). The spatial database for the study area is shown in .
Table 1. Data used for forest fire susceptibility mapping (FFSM).
One of the important factors in any fire hazard rating system is topography data. In the literatures, the impacts of elevation, slope aspect, and slope angle in fire behaviour have been widely reported (Chuvieco & Congalton Citation1989; Erten et al. Citation2004; Renard et al. Citation2012; Adab et al. Citation2013).
In the current research, a digital elevation model (DEM) was created by digitizing contours (30 m interval) and survey base points. The DEM map has a grid size of 30 m with 2323 columns and 1657 rows. Using the DEM, altitude, slope aspect, and slope angle were extracted ((a) and (b)).
Figure 3. Topographical parameter maps of the study area: (a) altitude, (b) slope aspect and (c) slope angle. Modified from Pourtaghi et al. (Citation2014).
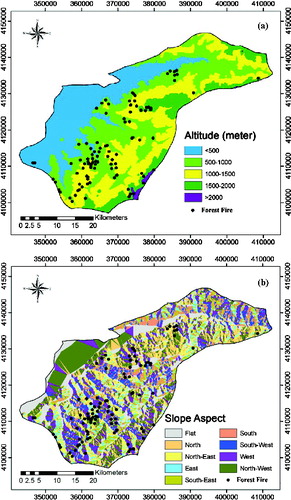

Elevation is a crucial physiographic variable that is associated with temperature, moisture, and wind (Xiangwei et al. Citation2011). Therefore, it has an important role in fire spreading (Jaiswal et al. Citation2002). The altitude map was extracted from the DEM and classified into five classes according to equal interval classification (Pradhan et al. Citation2007; Pourtaghi et al. Citation2014); that is, (1) <500 m, (2) 500–1000 m, (3) 1000–1500 m, (4) 1500–2000 m and (5) >2000 m ((a)).
Slope aspect is another factor that correlated with the amount of received solar energy in the area. Therefore, slope aspect layer was selected as one of the forest fire-related factors and has been categorized into nine classes: (1) flat, (2) north, (3) north-east, (4) east, (5) south-east, (6) south, (7) south-west, (8) west, and (9) north-west ((b)).
Also, one of the parameters that influence the fire spread rate is slope angle (Weise & Biging Citation1997). Fire can move more quickly up the slope and less quickly down the slope (Kushla & Ripple Citation1997). So, the slope map of the study area is derived from the DEM and divided into four classes such as 0°–5°, 5°–15°, 15°–30°, and >30° ((c)). In addition, using the meteorological database, the annual temperature and wind effect factors were calculated ((a) and (b)).
Figure 4. Meteorological parameter maps of the study area: (a) annual temperature and (b) wind effect (no dimension). Modified from Pourtaghi et al. (Citation2014).
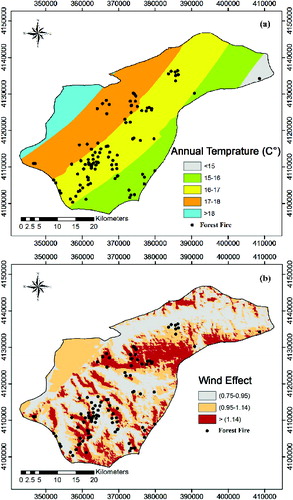
Temperature highly affects the moisture amount in forest combustion. High temperature led to dry combustion quickly (Antoninetti et al. Citation1993). The annual temperature map was classified as follows: <15, 15–16, 16–17, 17–18, and >18 °C ((a)).
Wind is an important factor because it provides fresh oxygen and the flame puts a new fuel source (Rawat Citation2003). Wind effect factor map was created based on three input parameters, such as DEM in grid format, wind direction (degree), and wind speed (m/s) in SAGA GIS (http://saga.sourcearchive.com/documentation/2.0.7plus-pdfsg-2/wind__effect_8cpp_source.html). In the current research, the wind effect was prepared in SAGA-GIS and classified based on the natural break classification scheme (Pourtaghi et al. Citation2014) into three classes such as (0.75–0.95), (0.95–1.14), and (>1.14) ((b)).
The land use map was created using Landsat-7 images of 2010. In order to create the land use map, a supervised classification using maximum likelihood algorithm was applied. A total of 370 signatures (training classes) were collected from all land use types. The signatures were collected by field survey and using GPS. Out of these 370 signatures, 250 signatures were used for land use mapping and the remaining were used for accuracy assessment. Nine land use classes were drawn such as irrigation farming (IF), dense forest (DF), sparse forest (SF), irrigated and rain-fed mixed farming (IRMF), rain-fed farming (RF), good range (GR), moderate range (MR), moderate forest (MF), woodlands and shrubbery (WS), and urban (residential) (U) ().
Figure 5. Land use map of the study area. Modified from Pourtaghi et al. (Citation2014).
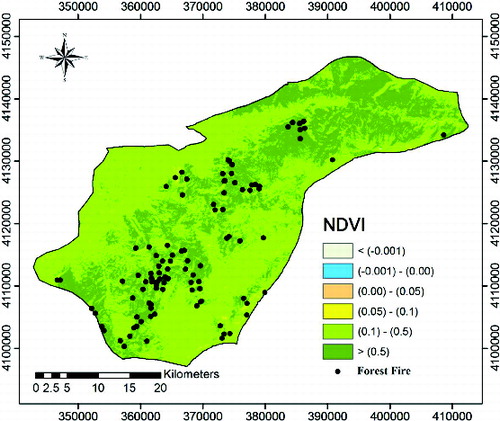
For assessment of vegetation cover, we used normalized difference vegetation index (NDVI), which is the most commonly used index to assess live FMC (Chuvieco Citation2003). The NDVI was prepared using Landsat-7 images (path 162 and row 34 obtained on 13 November 2010) based on the following equation (Rouse et al. Citation1973):
(1) where NIR (band 4) and RED (band 3) values are the infrared and red portion of the electromagnetic spectrum, respectively. In this study, the NDVI map was prepared in ENVI 4.8 and divided into six classes ().
Figure 6. Normalized different vegetation index (NDVI) map of the study area. Modified from Pourtaghi et al. (Citation2014).
For classification of conditioning factors, different methods were used such as equal interval, natural break, and normal or common standards. Finally, for application of M-AHP and MFL models, all the aforementioned conditioning factors were converted to a raster grid with 30 m × 30 m pixel size in the ArcGIS 9.3 software. All the maps are in UTM (Universal Transvers Mercator) coordinate system and WGS84 spatial reference (WGS84-UTM-Zone40N).
3.2. Statistical index
In this research, the statistical index (SI) model was applied to illustrate the quantitative relationship between distributions of forest fire occurrences with predictor factors. The SI method is a bivariate statistical analysis proposed by van Westen (Citation1997). A weight value for each categorical unit is defined as the natural logarithm of the forest fire density in the categorical unit divided by the forest fire density in the entire map (van Westen Citation1997; Rautela & Lakhera Citation2000; Cevik & Topal Citation2003; Pourghasemi, Moradi, et al. Citation2013). This method is based on the following equation (van Westen Citation1997):
(2) where WSI is the weight given to a certain class i of parameter j; Fij is the number of forest fires in a certain class i of parameter j; FT is the total number of forest fires in the entire map; Pij is the number of pixels in a certain class i of parameter j; and PT is the total pixels of the entire map.
3.3. Modified analytical hierarchy process
The analytical hierarchy process (AHP) is a theory of measurement for considering tangible and intangible criteria that have been applied to numerous areas, such as decision theory and conflict resolution (Vargas Citation1990; Yalcin Citation2008; Youssef et al. Citation2011). The AHP includes a matrix-based pairwise comparison of the contribution of different factors on forest fire occurrence. The process consists of four phases: (1) breaking a complex unstructured problem down into its component factors, i.e. conditioning factors considered in this study; (2) combine these factors in a hierarchical order; (3) assign numerical values according to the relative important of each factor (pairwise comparison); and (4) synthesize the rating to determine the priorities to be assigned to these factors (Saaty & Vargas Citation2001). The pairwise comparison is the process of comparing the relative importance, preference, or likelihood of two elements (for example, criteria) with respect to another element (for example, the goal) in the level above to establish priorities for the elements being compared (Saaty Citation1994; ).
Table 2. The AHP pairwise comparison scale (Saaty Citation1994).
One of the key points in AHP is calculation of consistency ratio (Saaty Citation1977). If consistency ratio is less of 0.1, then the mentioned matrix can be considered as an acceptable consistency (Saaty Citation1977). Several researchers have used AHP model in various applications and reported a reasonable accuracy (Ayalew et al. Citation2005; Hajeeh & Al-Othman Citation2005; Komac Citation2006; Yalcin Citation2008; Esmali Ouri & Amirian Citation2009; Wu & Chen Citation2009; Langenbrunner et al. Citation2010; Abba et al. Citation2013; Agarwal et al. Citation2013; Kayastha et al. Citation2013; Tierno et al. Citation2013; Zhang et al. Citation2013; Giri & Nejadhashemi Citation2014). However, it is based on expert opinions and thus may be subjected to cognitive limitations with uncertainty and subjectivity (Pourghasemi, Moradi, et al. Citation2013). Thus, for solving the limitations of the conventional AHP, an M-AHP is proposed by Nefeslioglu et al. (Citation2013) and applied in the current research. The differences between the M-AHP and the conventional AHP can be classified into two groups:
The preparation of the factor comparison matrix. In this step, there are following differences:
The factor comparison matrix in the M-AHP model is not according to the expert opinion,
The expert viewpoints in M-AHP only used to define the maximum scores for each factor in order to prepare factor score matrix,
Normalization of the factor score values according to maximum score factor,
Finally, construction of factor comparison matrix based on modified importance value scale (Nefeslioglu et al. Citation2013).
The evaluation of the importance distributions of the conditioning factors on the decision points (Nefeslioglu et al. Citation2013). In this step, at first, each factor will be normalized based on its own maximum score. Subsequently, linear distance between the normalized factor score and decision points will be calculated, and finally decision point comparison matrix will be prepared by considering modified importance value scale.
In other words, it is sufficient for the expert to identify important factors at model running (http://portal.netcad.com.tr/pages/viewpage.action?pageId=113803523). The details of the mentioned algorithm/tool (M-AHP) with an example on snow avalanche can be found in Nefeslioglu et al. (Citation2013).
3.4. Mamdani fuzzy logic
The fuzzy set theory was first introduced by Zadeh (Citation1965), and it is one of the tools used to handle complex problems. Fuzzy sets theory is a mathematical method used to characterize and propagate uncertainty and imprecision in data and functional relationships (Kurtener & Badenko Citation2000). The mentioned theory has been commonly used in different scientific studies and disciplines (Juang et al. Citation1992; Alvarez Grima & Babuska Citation1999; Ercanoglu & Gokceoglu Citation2002; Nefeslioglu et al. Citation2006; Saboya et al. Citation2006; Gokceoglu et al. Citation2009; Yagiz & Gokceoglu Citation2010; Akgun et al. Citation2012; Pourghasemi et al. Citation2012b; Osna et al. Citation2014). In the fuzzy set theory, membership can take on any value between 0 and 1, reflecting the degree of certainty of membership (Zadeh Citation1965; Pradhan Citation2011). A membership value was chosen arbitrary according to subjective judgement about the relative importance of the maps and their various states (Bonham-Carter Citation1994). A number of different types of membership functions (MFs) have been proposed for fuzzy inference system. These MFs are triangular, trapezoidal, sigmoidal, bell, Gaussian combination, and π-shaped (Pradhan Citation2013; Osna et al. Citation2014).
Meanwhile, in the literature, different fuzzy inference systems (FIS) have been proposed (Mamdani, Sugeno, and Tsukamoto), but the Mamdani fuzzy is one of the most interesting methods applied in engineering geology problems (Alvarez Grima Citation2000; Akgun et al. Citation2012).
In the Mamdani fuzzy model, if–then rules replace the usual set of equations used to characterize a system (Yager & Filev Citation1994). The Mamdani fuzzy model takes the following form:
(3) where k is the number of rules,
are input variables, y is the output variables, and Aij and Bi are linguistic terms.
In Mamdani model, each rule is a fuzzy relation which is calculated using the following equation:
(4) where the operator I can be either a fuzzy implication or a conjunction operator (t-norm) (Jager Citation1995).
There are four inference steps in Mamdani fuzzy inference system such as fuzzification, rule assessment, aggregation, and defuzzification steps (Mamdani & Assilian Citation1975); they are presented in equations (5)–(7).
Step 1: compute the degree of fulfillment αi of the antecedent for each rule i:
(5)
Step 2: for each rule, drive the output fuzzy set using the minimum t-norm:
(6)
Step 3: Aggregate the output fuzzy sets by taking the maximum method (Eq. 8):
(7)
Finally, in this study, due to defuzzification process (Step 4) was used of the centroid method because of its simplicity and producing consistent results (Jager Citation1995). The details of the mentioned algorithm can be found in Alvarez Grima (Citation2000).
As a result, the fuzzy logic allows more flexible combinations of weighted maps and could be readily implemented in GIS modelling language (Pradhan Citation2010a, Citation2010b).
For applying of the mentioned models (M-AHP and MFL) were used of a laptop computer by a hardware configuration such as CORE i7 processor, 64-bit CPU and 6GB RAM, the inference process completes in approximately 7 hours. But the computer output in the M-AHP model can be obtained in a less time, almost at 10 min.
4. Results
4.1. Statistical index (SI)
The spatial relationship between forest fire occurrences and the conditioning factors using the SI model is presented in . According to the relationship between forest fire occurrence and altitude, forest fire numbers or frequency is highest at elevations higher than 500 m. Thus, the probability of occurrence of fire in these altitudes is higher. Chuvieco and Congalton (Citation1989) and Adab et al. (Citation2013) reported that fire behaviour trends are less severe at higher altitudes because of higher rainfall. The SI value between forest fire occurrence and slope aspect shows that forest fires are most common on east (SI = 0.89), south-west (SI = 0.38), and west (SI = 0.21) facing slopes, respectively, and the flat (SI = −0.5) and north-west (SI = −0.36) facing slopes have the lowest incidence. The analysis of SI for the relationship between forest fire occurrence and slope degree indicates that slope degree class >30° and <5° has the highest and lowest values of SI (0.64 and −0.75), respectively. The results showed that the SI values decreased with the slope degree addition in the study area. Assessment of annual temperature showed that the temperature of 16–17 °C has high correlation with forest fire occurrence (SI = 0.55). The result of wind effect indicates that class >1.14 is considered to be susceptible to fire with an SI value of 0.47. In the case of land use, it can be inferred that 99.06% of forest fire falls on dense forest area with value of 0.51, indicating that the probability of occurrence of forest fire in this land use type is very high. The NDVI factor indicates that the range between 0.1 and 0.5 and >0.5 have the highest frequency for forest fire occurrence (26.42% and 72.64%). On the other hand, the remaining classes are lowest susceptible or non-susceptible to forest fire occurrence.
Table 3. Spatial relationship between conditioning factors and forest fire locations using statistical index (SI) model.
4.2. Forest fire susceptibility mapping (FFSM) by M-AHP model
For FFSM, a tool was developed in Netcad GIS 6 as M-AHP. At first, seven forest fire conditioning factors were classified based on literature review and expert knowledge. Then, the score of their classes (condition factor classes) was determined according to expert knowledge () and, subsequently, maximum score factors were extracted. In the mentioned table, for the altitude, the maximum score is 7 for classes >2000 m. Hernandez-Leal et al. (Citation2006) reported that humidity and temperature have higher influence on fire at higher altitude areas than lower ones. In the case of slope aspect, maximum scores referred to south-facing slopes by value of 6. It is noticed that south-facing slopes received more sunlight, higher temperatures, stronger winds, low humidity, and low fuel moistures than those facing the north pole. Thus, vegetation is generally drier and less dense on south-facing slopes than north-facing ones (Anderson Citation1982; Prasad et al. Citation2008), and drier fuels are more prone to ignition (Noonan Citation2003; Iwan et al. Citation2004). For the slope degree, the maximum score is 7 for slopes >30°. Kushla and Ripple (Citation1997) stated that fire can move more quickly up the slope and less quickly down the slope. On the other hand, flames being angled closer to the ground surface, thus, fire spread rate may rise on steeper slopes, and the process of heat convection can be enhanced by wind effects due to fire behaviour (Whelan Citation1995; DeBano et al. Citation1998; Adab et al. Citation2013). The maximum score for annual temperature showed that higher temperature caused dry combustion (Artsybashev Citation1983; Antoninetti et al. Citation1993) and the resulting classes >18 °C have the highest maximum value (score = 7). In the case of wind effect and according to the expert knowledge scores, when wind effect increases, the probability of forest fire increases. In other words, the rate of burning is increased with increasing of wind effect. (Rawat Citation2003). So, classes of >1.14 have a highest score (score = 5). Another important factor for forest fire occurrence is land use type. The relationships between forest fire locations and land use types show that 99.06% of forest fire falls on dense forest area with value of 0.51, indicating that the probability of occurrence of forest fire in this land use type is very high. Thus, for M-AHP model, the maximum score (score = 5) corresponded to dense forest land use type. In the case of NDVI, maximum score was 7. In the range of greater than 0.5, the study area is generally covered by dense vegetation and tropical rainforest, so it is susceptible to fire occurrence.
Table 4. The conditioning factor scores given by expert and maximum scores.
Another important problem in calculation of M-AHP is instant factor scores. During application of the model, for any terrain mapping unit in the field, instant factor scores should also be defined by the expert or relevant user (Nefeslioglu et al. Citation2013). But, one of the attributes of Netcad GIS 6 is that the instant scores will be obtained from the region basin (study area basin) automatically. In other words, they are computed from the raster maps used in this study. For running the M-AHP model, one key point is determination of decision points. In the current research, the decision points for the FFSM is grouped into four classes as low, moderate, high, and very high ((a)).
Figure 7. Forest fire susceptibility map (FFSM) produced by M-AHP (a) and MFL (b) models. Modified from Pourtaghi et al. (Citation2014).
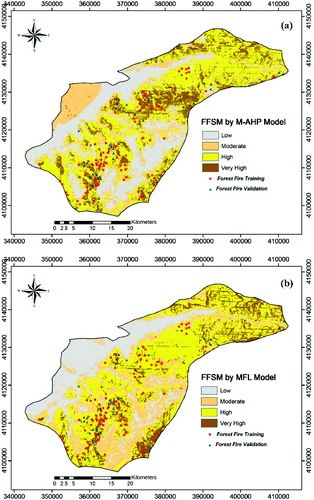
Finally, the FFSM prepared from the M-AHP method, which covered 29.66% of the total area, was designated to be a low FFSM class; 20.78, 33.17, and 16.39% of the total area are related to moderate, high, and very high FFSM zones, respectively ((a)).
4.3. Forest fire susceptibility mapping (FFSM) by Mamdani fuzzy logic
To produce FFSM using Mamdani fuzzy inference system (FIS), at first, conditioning factors were created in raster format with a 30 m × 30 m pixel size in GIS environment. After the inputs were loaded to Netcad GIS 6, the user can select a fuzzy existing model or build a new one based on the input numbers in the Architect page. In the next step, membership functions were defined for input and output layers. The input layers are the same as considered in the previous models.
Due to definition of membership function for categorical factors such as slope aspect and land use, the forest fire density and spatial relationship between these factors and forest fire locations () were considered in the current research. To minimize the uncertainty, a 50% overlap is applied between the fuzzy sets for each input parameter, and triangular membership functions are used for each fuzzy set (Akgun et al. Citation2012). On the other hand, output set as FFSM and its membership function draw into four classes such as low, moderate, high, and very high. Another important part in Mamdani FIS is definition of the fuzzy if–then rules. In this study, a total 128 if–then rules were used. First, the if–then rules are created automatically and then edited according to expert opinion. For transforming output linguistic variables into crisp values, defuzzification method should be used. Thus, for FFSM, the most common defuzzification method, namely, gravity center, was used (Jager Citation1995; Babuska Citation1996; Saboya et al. Citation2006).
Finally, the FFSM produced from the MFL method, which covered 23.17% of the total area, was designated to be a low FFSM class; 24.41, 38.97, and 13.45% of the total area are related to moderate, high, and very high FFSM zones, respectively ((b)).
4.4. Validation of forest fire susceptibility maps
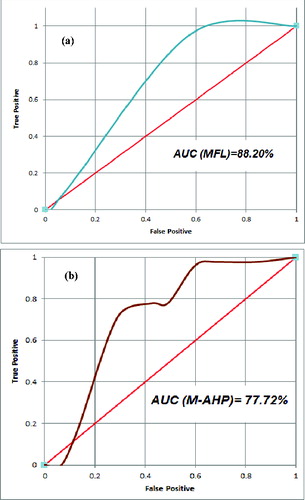
In general, the validation of predicted results is the crucial step in the modelling process, so that the results can provide a meaningful interpretation (Fabbri & Chung Citation2001; Chung & Fabbri Citation2003). To determine the accuracy of the two FFSMs produced using M-AHP and MFL models, the ROC curve (Pradhan et al. Citation2009; Pradhan Citation2010a, Citation2010b, Citation2011; Akgun et al. Citation2012; Mohammady et al. Citation2012; Pourghasemi, Goli Jirandeh, et al. Citation2013; Osna et al. Citation2014; Jaafari et al. Citation2014) was used. ROC curve analysis is a common method used to assess the diagnostic test accuracy (Egan Citation1975). The ROC curve plots the true positive rate on the Y-axis and the false positive rate on the X-axis. It represents the trade-off between the two rates (Negnevitsky Citation2002). In the ROC method, the area under the curve (AUC) values range from 0.5 to 1.0 and are used to evaluate the model accuracy (Nandi & Shakoor Citation2010). If the model does not predict the forest fire occurrences better than the chance, the AUC would equal 0.5. A ROC curve of 1 shows perfect prediction (Yesilnacar Citation2005). The quantitative–qualitative relationship between AUC and prediction accuracy can be classified as follows: 0.9–1, excellent; 0.8–0.9, very good; 0.7–0.8, good; 0.6–0.7, average; and 0.5–0.6, poor (Yesilnacar Citation2005). In this study, the forest fire locations that were not used during the model building process were used to verify the FFSMs. The AUC values of the ROC curve for MFL and M-AHP models were found to be 88.20% and 77.72% with a standard error of 0.042 and 0.49, respectively ( (a) and (b)). Hence, it is concluded that the MFL model employed in this study showed more reasonable results with respect to the M-AHP model in predicting the forest fire susceptibility of study area.
Figure 8. Prediction rate curve for the forest fire susceptibility map by MFL (a) and M-AHP (b) models.
5. Conclusion
The present study attempts to assess FFSMs produced by the M-AHP and MFL models and to compare their performances. The results of this study suggest that FFSMs for the Minudasht Township, Golestan Province, of Iran are viable. Meanwhile, based on the obtained AUC, the MFL model has better prediction performance (88.20%) than the M-AHP (77.72%) model. As a result, the FFSM by M-AHP is easy, because the mentioned model does not use the membership functions and if–then fuzzy rules; thus, it takes a less time for model running. According to Nefeslioglu et al. (Citation2013), another advantage of the M-AHP is that, using this methodology, the consistency ratio value for the comparison matrix and the weights never exceeds 0.10. In contrast, fuzzy algorithm is a powerful tool in modelling of complex natural processes and nonlinear systems. Finally, these maps can be used to early warning, fire suppression resources planning, and allocation works.
Acknowledgements
The authors would like to thank Prof. Candan Gokceoglu, Dr Hakan A. Nefeslioglu, Turgay Osna, and Deniz Celik for their supports in creating and training of spatial analyst in the Netcad GIS 6, especially on M-AHP and MFL modules. Also, the authors would like to thank the three anonymous reviewers for their helpful comments on the previous version of the manuscript.
References
- Abba AH, Noor ZZ, Yusuf RO, Mohd Din MF, Abu Hassan MA. 2013. Assessing environmental impacts of municipal solid waste of Johor by analytical hierarchy process. Resour Conserv Recycl. 73:188–196.
- Adab H, Devi Kanniah K, Solaimani K. 2013. Modeling forest fire risk in the northeast of Iran using remote sensing and GIS techniques. Nat Hazards. 65:1723–1743.
- Agarwal PK, Patil PK, Mehal R. 2013. A methodology for ranking road safety hazardous locations using analytical hierarchy process. Proc Soc Behav Sci. 104:1030–1037.
- Akgun A, Sezer EA, Nefeslioglu HA, Gokceoglu C, Pradhan B. 2012. An easy-to-use MATLAB program (MamLand) for the assessment of landslide susceptibility using a Mamdani fuzzy algorithm. Comput Geosci. 38:23–34.
- Allard G. 2001. The fire situation in Islamic Republic of Iran. Global forest fire assessment 1990-2000. Working Paper 55, Rome. p. 198–202. http://www.fao.org/forestry/en/
- Alvarez Grima M. 2000. Neuro-fuzzy modeling in engineering geology. Rotterdam: Balkema.
- Alvarez Grima M, Babuska R. 1999. Fuzzy model for the prediction of unconfined compressive strength of rock samples. Int J Rock Mech Mining Sci. 36:339–349.
- Anderson HE. 1982. Aids to determining fuel models for estimating fire behavior. Intermountain Forest and Range Experiment Station General Technical Report INT-122. Ogden (UT): USDA Forest Service.
- Angayarkkani K, Radhakrishnan N. 2011. An effective technique to detect forest fire region through ANFIS with spatial data. 3rd International Conference on Electronics Computer Technology (ICECT); 2011; Kanyakumari, India; p. 24–30. doi:10.1109/ICECTECH.2011.5941794
- Antoninetti M, Binagli E, Rampini A, D’Angelo M. 1993. The integrated use of satellite and topographic data for forest fire hazard map. In: Winkler P, Balkema AA, editors. Remote sensing for monitoring the changing environment of Europe. Rotterdam: Brookfield; p. 179–184.
- Artsybashev ES. 1983. Forest fires and their control. lst ed. New Delhi: Oxonian (in Russian, 1974).
- Ayalew L, Yamagishi H, Marui H, Kanno T. 2005. Landslides in Sado Island of Japan. Part II. GIS-based susceptibility mapping with comparisons of results from two methods and verifications. Eng Geol. 81:432–445.
- Babuska R. 1996. Fuzzy modelling and identification [dissertation]. Delft: Delft University of Technology.
- Betanzos AA, Fontenla-Romero O, Guijarro-Berdinas B, Hernandez-Pereira E, Canda J, Jimenez E, Legido JL, Muniz S, Paz-Andrade C, Paz-Andrade MI. 2002. A neural network approach for forestal fire risk estimation. In: Van Harmelen F, editor. Proceedings of the 15th Eureopean Conference on Artificial Intelligence, ECAI'2002; 2002 July; Lyon, France. p. 643–647.
- Bisquert M, Caselles E, Sanchez E, Caselles V. 2012. Application of artificial neural networks and logistic regression to the prediction of forest fire danger in Galicia using MODIS data. J Wildland Fire. 1:1025–1029.
- Bonham-Carter GF. 1994. Computer methods in the geosciences. Vol. 13. Ontario: Pergamon.
- Carvalho JP, Carola M, Tome JAB. 2006. Forest fire modeling using rule-based fuzzy Cognitive maps and Voronoi based cellular automata. Annual meeting of the North American Fuzzy Information Processing Society. NAFIPS 2006; 2006 Jun 3–6; Quebec, Canada; p. 217–222.
- Castro R, Chuvieco E. 1989. Modeling forest fire danger from geographic information systems. Geocarto Int. 13:15–23.
- Cevik E, Topal T. 2003. GIS-based landslide susceptibility mapping for a problematic segment of the natural gas pipeline, Hendek (Turkey). Environ Geol. 44:949–962.
- Chung CF, Fabbri AG. 2003. Validation of spatial prediction models for landslide hazard mapping. Nat Hazards. 30:451–472.
- Chuvieco E. 2003. Wildland fire danger estimation and mapping: the role of remote sensing data. Series in remote sensing. Vol. 4. Singapore: World Scientific.
- Chuvieco E, Aguadoa I, Yebraa M. 2010. Development of a framework for fire risk assessment using remote sensing and geographic information system technologies. Ecol Model. 221:46–58.
- Chuvieco E, Coceroa D, Riano D, Martinc P, Martıiez-Vega J, de la Riva J, Perez F. 2004. Combining NDVI and surface temperature for the estimation of live fuel moisture content in forest fire danger rating. Remote Sens Environ. 92:322–331.
- Chuvieco E, Congalton RG. 1989. Application of remote sensing and geographic information systems to forest fire hazard mapping. Remote Sens Environ. 29:147–159.
- Cortez P, Morais A. 2007. A data mining approach to predict forest fires using meteorological data. In: Neves J, Santos MF, Machado J, editors. New Trends in Artificial Intelligence. Proceedings of the EPIA 2007 – Portuguese Conference on Artificial Intelligence; 2007 December; Guimarães, Portugal, p. 512–523.
- DeBano LF, Neary DG, Ffolliott PF. 1998. Fire's effects on ecosystems. New York (NY): Wiley.
- Dimopoulou M, Giannikos I. 2001. Spatial optimization of resources deployment for forest-fire management. Int Trans Oper Res. 8:523–534.
- Dimopoulou M, Giannikos I. 2002. Towards an integrated framework for forest fire control. Eur J Oper Res. 152:476–486.
- Egan JP. 1975. Signal detection theory and ROC analysis. Vol. 195. New York (NY): Academic Press; p. 266–268.
- Ercanoglu M, Gokceoglu C. 2002. Assessment of landslide susceptibility for a landslide-prone area (North of Yenice, NW Turkey) by fuzzy approach. Environ Geol. 41:720–730.
- Erten E, Kurgun V, Musaoglu N. 2004. Forest fire risk zone mapping from satellite imagery and GIS: a case study. XXth Congress of the International Society for Photogrammetry and Remote Sensing, Istanbul, Turkey; p. 222–230.
- Esmali Ouri A, Amirian S. 2009. Landslide hazard zonation using MR and AHP methods and GIS techniques in Langan watershed, Ardabil, Iran. International Conference on ACRS 2009; Beijing, China.
- Fabbri AG, Chung CF. 2001. Spatial support in landslide hazard prediction based on map overlays. Proceeding of International Association for Mathematical Geology Annual Meeting (IAMG 2001); 2001 Sep 10–12; Cancun, Mexico.
- García M, Chuvieco E, Nieto H, Aguado I. 2008. Combining AVHRR and meteorological data for estimating live fuel moisture content. Remote Sens Environ. 112:3618–3627.
- Giri S, Nejadhashemi AP. 2014. Application of analytical hierarchy process for effective selection of agricultural best management practices. J Environ Manage. 132:165–177.
- Gokceoglu C, Sonmez H, Zorlu K. 2009. Estimating the uniaxial compressive strength of some clay-bearing rocks selected from Turkey by nonlinear multivariable regression and rule-based fuzzy models. Expert Syst. 26:176–190.
- Hajeeh M, Al-Othman A. 2005. Application of the analytical hierarchy process in the selection of desalination plants. Desalination. 174:97–108.
- Hernandez-Leal PA, Arbelo M, Gonzalez-Calvo A. 2006. Fire risk assessment using satellite data. Adv Space Res. 37:741–746. doi:10.1016/j.asr.2004.12.053.
- Iwan S, Mahmud AR, Mansor S, Shariff ARM, Nuruddin AA. 2004. GIS-grid-based and multi-criteria analysis for identifying and mapping peat swamp forest fire hazard in Pahang, Malaysia. Disaster Prev Manage 13(5):379–386.
- Jaafari A, Najafi A, Pourghasemi HR, Rezaeian J, Sattarian A. 2014. GIS-based frequency ratio and index of entropy models for landslide susceptibility assessment in the Caspian forest. Northern Iran. Int J Environ Sci Technol. 11:909–926.
- Jager R. 1995. Fuzzy logic in control [dissertation]. Delft: Delft University of Technology.
- Jaiswal RK, Mukherjee S, Raju KD, Saxena R. 2002. Forest fire risk zone mapping from satellite imagery and GIS. Int J Appl Earth Observ Geoinform. 4:1–10.
- Janbaz Ghobadi Gh, Gholizadeh B, Majidi Dashliburun O. 2012. Forest fire risk zone mapping from geographic information system in Northern Forests of Iran (case study, Golestan province). Int J Agric Crop Sci. 4:818–824.
- Juang CH, Lee DH, Sheu C. 1992. Mapping slope failure potential using fuzzy sets. J Geotech Eng Div ASCE. 118:475–493.
- Kayastha P, Dhital MR, De Smedt F. 2013. Application of the analytical hierarchy process (AHP) for landslide susceptibility mapping: a case study from the Tinau watershed, west Nepal. Comput Geosci. 52:398–408.
- Koetz B, Morsdorf F, van der Linden S, Curt T, Allgower B. 2008. Multi-source land cover classification for forest fire management based on imaging spectrometry and LiDAR data. For Ecol Manage. 256:263–271.
- Komac M. 2006. A landslide susceptibility model using the analytical hierarchy process method and multivariate statistics in peri-alpine Slovenia. Geomorphology. 74:17–28.
- Krasnow K, Schoennagel T, Veblen TT. 2009. Forest fuel mapping and evaluation of landfire fuel maps in Boulder County, Colorado, USA. For Ecol Manage. 257:1603–1612.
- Kurtener D, Badenko V. 2000. Methodological framework based on fuzzy set theory for land use management. J Braz Comput Soc. 6:26–32.
- Kushla JD, Ripple WJ. 1997. The role of terrain in a fire mosaic of a temperate coniferous forest. For Ecol Manage. 95:97–107.
- Langenbrunner JR, Hemez FM, Booker JM, Ross TJ. 2010. Model choice considerations and information integration using analytical hierarchy process. Proc Soc Behav Sci. 2:7700–7701.
- Leuenberger M, Kanevski M, Vega Orozco CD. 2013. Forest fires in a random forest. Eur Geosci Union Gen Assembly. 15:2013–3238.
- Maeda EE, Formaggio AR, Shimabukuro YE, Arcoverde GFB, Lima A. 2009. Forest fire risk mapping in the Brazilian Amazon using MODIS images and artificial neural networks. Int J Appl Earth Obs. 11:265–272.
- Mamdani EH, Assilian S. 1975. An experiment in linguistic synthesis with a fuzzy logic controller. Int J Man Mach Stud. 7:1–13.
- Mohammady M, Pourghasemi HR, Pradhan B. 2012. Landslide susceptibility mapping at Golestan Province, Iran: a comparison between frequency ratio, Dempster-Shafer, and weights-of-evidence models. J Asian Earth Sci. 61:221–236.
- Nadeau LB, McRae DJ, Jin JZ. 2005. Development of a national fuel-type map for Canada using fuzzy logic : INFORMATION REPORT NOR-X-406. Edmonton (AB): Canadian Forest Service Northern Forestry Centre.
- Nandi A, Shakoor A. 2010. A GIS-based landslide susceptibility evaluation using bivariate and multivariate statistical analyses. Eng Geol. 110:11–20.
- Nefeslioglu HA, Gokceoglu C, Sonmez H. 2006. Indirect determination of weighted joint density (wJd) by empirical and fuzzy models: Supren (Eskisehir, Turkey) marbles. Eng Geol. 85:251–269.
- Nefeslioglu HA, Sezer EA, Gokceoglu C, Ayas Z. 2013. A modified analytical hierarchy process (M-AHP) approach for decision support systems in natural hazard assessments. Comput Geosci. 59:1–8.
- Negnevitsky M. 2002. Artificial intelligence: a guide to intelligent systems. Harlow: Pearson Education; p. 394.
- Noonan EK. 2003. A coupled model approach for assessing fire hazard at point Reyes national seashore: Flam Map and GIS. In: Second international wild land fire ecology and fire management congress and fifth symposium on fire and forest meteorology. Orlando (FL): American Meteorological Society; p. 127–128.
- Osna T, Sezer EA, Akgun A. 2014. GeoFIS: an integrated tool for the assessment of landslide susceptibility. Comput Geosci. 66:20–30.
- Pierce AD, Farris GA, Taylor AH. 2012. Use of random forests for modeling and mapping forest canopy fuels for fire behavior analysis in Lassen Volcanic National Park, California, USA. For Ecol Manage. 279:77–89.
- Pourghasemi HR, Goli Jirandeh A, Pradhan B, Xu C, Gokceoglu C. 2013. Landslide susceptibility mapping using support vector machine and GIS at the Golestan Province, Iran. J Earth Syst Sci. 122:349–369.
- Pourghasemi HR, Moradi HR, Fatemi Aghda SM. 2013. Landslide susceptibility mapping by binary logistic regression, analytical hierarchy process, and statistical index models and assessment of their performances, Nat Hazards. 69:749–779.
- Pourghasemi HR, Pradhan B, Gokceoglu C. 2012a. Remote sensing data drived parameters and its use in landslide susceptibility assessment using Shannon's entropy and GIS. In: Varatharajoo R, Abdullah EJ, Majid DL, Romli FI, Mohd Rafie AS, Ahmad KA, editors. Applied Mechanics and Materials (Volume 225). AEROTECH IV, Chapter 7: Space Systems. p. 486–491.
- Pourghasemi HR, Pradhan B, Gokceoglu C. 2012b. Application of fuzzy logic and analytical hierarchy process (AHP) to landslide susceptibility mapping at Haraz watershed, Iran. Nat Hazards. 63:965–996.
- Pourghasemi HR, Moradi HR, Fatemi Aghda SM. 2014. GIS-based landslide susceptibility mapping with probabilistic likelihood ratio and spatial multi-criteria evaluation models (North of Tehran, Iran). Arab J Geosci. 7(5):1857–1878.
- Pourtaghi ZS, Pourghasemi HR, Rossi M. 2014. Forest fire susceptibility mapping in the Minudasht forests, Golestan province, Iran. Environ Earth Sci. http://dx.doi.org/10.1007/s12665-014-3502-4
- Pradhan B. 2010a. Use of GIS-based fuzzy logic relations and its cross application to produce landslide susceptibility maps in three test areas in Malaysia. Environ Earth Sci. 63(2): 329–349.
- Pradhan B. 2010b. Landslide susceptibility mapping of a catchment area using frequency ratio, fuzzy logic and multivariate logistic regression approaches. J Indian Remote Sens. 38:301–320.
- Pradhan B. 2011. Manifestation of an advanced fuzzy logic model coupled with geoinformation techniques for landslide susceptibility analysis. Environ Ecol Stat. 18:471–493.
- Pradhan B. 2013. A comparative study on the predictive ability of the decision tree, support vector machine and neuro-fuzzy models in landslide susceptibility mapping using GIS. Comput Geosci. 51:350–365.
- Pradhan B, Assilzadeh H. 2010. Forest fire detection and monitoring using high temporal MODIS and NOAA AVHRR satellite images in Peninsular Malaysia. Disaster Adv. 3:18–23.
- Pradhan B, Lee S, Buchroithner MF. 2009. Use of geospatial data for the development of fuzzy algebraic operators to landslide hazard mapping: a case study in Malaysia. Appl Geomatics. 1:3–15.
- Pradhan B, Suliman MDHB, Awang MAB. 2007. Forest fire susceptibility and risk mapping using remote sensing and geographical information systems (GIS). Disaster Prev Manage. 16:344–352.
- Prasad VK, Badarinath KVS, Anuradha E. 2008. Biophysical and anthropogenic controls of forest fires in the Deccan Plateau, India. J Environ Manage. 86:1–13.
- Prosper-Laget V, Douguedroitl A, Guinot JP. 1995. Mapping the risk of forest fire occurrence using NOAA satellite information. EAR seL Adv Remote Sens. 4:30–38.
- Rautela P, Lakhera RC. 2000. Landslide risk analysis between Giri and Tons Rivers in Himachal Himalaya (India). Int J Appl Earth Observ Geoinform. 2:153–160.
- Rawat GS. 2003. Fire risk assessment for fire control management in Chilla forest range of Rajaji National Park Uttaranchal (India) [thesis]. Enschede: International Institute for Geo-information Science and Earth Observation.
- Razali SBM. 2007. Forest fire hazard rating assessment in peat swamp forest using integrated remote sensing and geographical information system [thesis]. Malaysia:University Putra Malaysia.
- Regmi AD, Yoshida K, Pourghasemi HR, Dhital MR, Pradhan B. 2014. Landslide susceptibility mapping along Bhalubang-Shiwapur area of mid-western Nepal using frequency ratio and conditional probability models. J Mt Sci. 11(5):1266–1285.
- Renard Q, Pelissier R, Ramesh BR, Kodandapani N. 2012. Environmental susceptibility model for predicting forest fire occurrence in the Western Ghats of India. Int J Wildland Fire. 21:368–379.
- Rouse JW, Haas RH, Schell JA, Deering DW. 1973. Monitoring vegetation systems in the Great Plains with ERTS (Earth Resources Technology Satellite). In: Freden SC, Mercanti EP, Becker MA editors. Third earth resources technology satellite-1 Symposium- Volume I: Technical Presentations. NASA SP-351; Washington (DC): NASA. p. 309–317.
- Saaty TL. 1977. A scaling method for priorities in hierarchical structures. J Math Psychol. 15:234–281.
- Saaty TL. 1994. Fundamentals of decision making and priority theory with analytic hierarchy process. Pittsburgh: RWS Publications; p. 527.
- Saaty TL. 2000. Decision making for leaders: the analytical hierarchy process for decisions in a complex world. Pittsburgh: RWS Publications.
- Saaty TL, Vargas LG. 2001. Models, methods, concepts and applications of the analytic hierarchy process. Dordrecht: Kluwer.
- Saboya FJ, Alves MDG, Pinto WD. 2006. Assessment of failure susceptibility of soil slopes using fuzzy logic. Eng Geol. 86:211–224.
- Safi Y, Bouroumi A. 2013. Prediction of forest fires using artificial neural networks. Appl Math Sci. 7:271–286.
- Saklani P. 2008. Forest fire risk zonation, a case study Pauri Garhwal, Uttarakhand, India [dissertation]. Enschede: International Institute for Geo-information Science and Earth Observation.
- Shadman Roodposhti M, Rahimi S, Jafar Beglou M. 2014. PROMETHEE II and fuzzy AHP: an enhanced GIS-based landslide susceptibility mapping. Nat Hazards. 73(1):77–95.
- Stojanova D, Panov P, Kobler A, Dzeroski S, Taskova K. 2006. Learning to predict forest fires with different data mining techniques. Proceedings of the Conference on Data Mining and Data Warehouses; 2006 Oct 9; Ljubljana, Slovenia; p. 255–258.
- Teodoro AC, Duarte L. 2013. Forest fire risk maps: a GIS open source application – a case study in Norwest of Portugal. Int J Geogr Inf Sci. 27:699–720.
- Tierno NR, Puig AB, Vera JB, Verdu FM. 2013. The retail site location decision process using GIS and the analytical hierarchy process. Appl Geogr. 40:191–198.
- van Westen C. 1997. Statistical landslide hazard analysis. ILWIS 2.1 for Windows application guide. Enschede: ITC Publication; p. 73–84.
- Vargas LG. 1990. An overview of the analytic hierarchy process and its applications. Eur J Oper Res. 48:2–8.
- Weise DR, Biging GS. 1997. A qualitative comparison of fire spread models incorporating wind and slope effects. For Sci. 43:170–180.
- Whelan RJ. 1995. The ecology of fire. Cambridge: Cambridge University Press.
- Wu CH, Chen SC. 2009. Determining landslide susceptibility in Central Taiwan from rainfall and six site factors using the analytical hierarchy process method. Geomorphology. 112:190–204.
- Wulder MA, Franklin SE. 2006. Understanding forest disturbance and spatial pattern: remote sensing and GIS approaches. Boca Raton (FL): CRC Press (Taylor and Francis).
- Xiangwei G, Xianyun F, Hongquan X. 2011. Forest fire risk zone evaluation based on high spatial resolution RS image in Liangyungang Huaguo Mountain Scenic Spot. IEEE International Conference on Spatial Data Mining and Geographical Knowledge Services (ICSDM); 2011 Jun 29–2011 Jul 1; Fuzhou, China; p. 593–596.
- Yager RR, Filev DP. 1994. Approximate clustering via the mountain method. IEEE Trans Syst Man Cybern. 24:1279–1284.
- Yagiz S, Gokceoglu C. 2010. Application of fuzzy inference and non-linear regression methods for predicting rock brittleness. Expert Syst Appl. 37:2265–2272.
- Yalcin A. 2008. GIS-based landslide susceptibility mapping using analytical hierarchy process and bivariate statistics in Ardesen (Turkey): comparisons of results and confirmations. Catena. 72:1–12.
- Yesilnacar EK. 2005. The application of computational intelligence to landslide susceptibility mapping in Turkey [dissertation]. Melbourne: Department of Geomatics, The University of Melbourne; p. 423.
- Youssef MA, Pradhan B, Tarabees E. 2011. Integrated evaluation of urban development suitability based on remote sensing and GIS techniques: contribution from the analytic hierarchy process. Arab J Geosci. 4:463–473.
- Zadeh LA. 1965. Fuzzy sets. Inf Control. 8:338–352.
- Zare M, Pourghasemi HR, Vafakhah M, Pradhan B. 2013. Landslide susceptibility mapping at Vaz watershed (Iran) using an artificial neural network model: a comparison between multi-layer perceptron (MLP) and radial basic function (RBF) algorithms. Arab J Geosci. 6 (8):2873–2888.
- Zhang R, Zhang X, Yang J, Yuan H. 2013. Wetland ecosystem stability evaluation by using analytical hierarchy process (AHP) approach in Yinchuan Plain, China. Math Comput Model. 57:366–374.
- Zhao J, Zhang Z, Han S, Qu C, Yuan Z, Zhang D. 2011. SVM based forest fire detection using static and dynamic features. Comput Sci Inf Syst. 8:821–841.