
Abstract
The main goal of this research was to detect oil spills, to determine the oil spill frequencies and to approximate oil leak sources around the Oil Rocks Settlement, the Chilov and Pirallahi Islands in the Caspian Sea using 136 multi-temporal ENVISAT Advanced Synthetic Aperture Radar Wide Swath Medium Resolution images acquired during 2006–2010. The following oil spill frequencies were observed around the Oil Rocks Settlement, the Chilov and Pirallahi Islands: 2–10 (3471.04 sq km), 11–20 (971.66 sq km), 21–50 (692.44 sq km), 51–128 (191.38 sq km). The most critical oil leak sources with the frequency range of 41–128 were observed at the Oil Rocks Settlement. The exponential regression analysis between wind speeds and oil slick areas detected from 136 multi-temporal ENVISAT images revealed the regression coefficient equal to 63%. The regression model showed that larger oil spill areas were observed with decreasing wind speeds. The spatiotemporal patterns of currents in the Caspian Sea explained the multi-directional spatial distribution of oil spills around Oil Rocks Settlement, the Chilov and Pirallahi Islands. The linear regression analysis between detected oil spill frequencies and predicted oil contamination probability by the stochastic model showed the positive trend with the regression coefficient of 30%.
1. Introduction
The Oil Rocks Settlement, Chilov and Pirallahi Islands in the Caspian Sea were selected as the study areas because of their long-term oil exploration history. Oil slicks in the Caspian Sea have different sources such as spills resulting from offshore oil installation (Espedal & Johannessen Citation2000), ship accidents and illegal releases (Lu Citation2003; Lu et al. Citation1999) and other natural processes etc. Detection of oil spills caused by anthropogenic oil exploration activities plays a significant role in the environmental management of cleaning activities and response to emergency situations. Detection of natural seepage is considered to be one of the significant preliminary works for offshore petroleum exploration (Brekke & Solberg Citation2005; Akar et al. Citation2011). The oil slick detection and mapping were often used for the hydrocarbon exploration activities and emergency response to oil spill incidents in the world places such as Gulf of Mexico (Friedman et al. Citation2002) and South Caspian Sea (Ivanov & Vostokov et al. Citation2004; Ivanov & Fang et al. 2004; Zatyagalova et al. Citation2007; Ivanov & Zatyagalova, Citation2008; Ivanov et al. Citation2012), Australian Shelf (O'Brein et al. Citation2005) and Santa Barbara Channel, California (Leifer et al. Citation2006). Oil spill satellite detection was also used during the Lebanese oil spill pollution crisis (Coppini et al. Citation2011) during the hostilities between Israel and Lebanon back in 2006, as well for routine monitoring of illegal oil slicks from maritime traffic (Zodiatis et al. Citation2012).
It is well known that microwave sensors have the advantage for oil slick monitoring due to its wide area coverage and day and night capabilities (Martinez & Moreno, 1996; Ziemke Citation1996; Kubat et al. Citation1998; Del Frate et al. Citation2000; Topouzelis et al. Citation2002; Topouzelis et al. Citation2007; Akar et al. Citation2011). Radar backscattering level decreases with slick and appears as a dark patch with lower backscatter from the sea surface (Girard-Ardhuin et al. Citation2003). The limitation of synthetic aperture radar (SAR) is that it does not have capabilities for oil spill thickness estimation and oil type recognition. However, SAR is useful particularly for searching large areas and observing oceans and seas at night and at cloudy weather conditions.
Possibilities for the detection of oil slicks depend on radar polarization modes, height of the waves, the amount of oil that has been released, slick nature, the speed of the wind and type of oil (Espedal Citation1998; Kotova et al. Citation1998; Espedal & Wahl Citation1999; Gade et al. Citation2000; Girard-Ardhuin et al. Citation2003; O'Brein et al. Citation2005).
The discrimination of oil slicks from oil spill look-alikes produced by oceanic and atmospheric processes is one of the most complex issues in the process of oil slick detection from SAR images. Discrimination of oil slicks from look-alikes is performed based on the textural, geometrical, radiometric, persistence and temporal repetition (Solberg et al. Citation1999; Brekke & Solberg Citation2005; Karantzalos & Argialas Citation2008; Topouzelis Citation2008; Akar et al. Citation2011).
The main goal of this research was to study oil pollution around the Oil Rocks Settlement, Chilov and Pirallahi Islands in the Caspian Sea using ENVISAT Advanced Synthetic Aperture Radar (ASAR) Wide Swath Medium Resolution satellite images acquired during the period of 2006–2010. The detailed research goals are following:
Detection of oil spills around the Oil Rocks Settlement, Chilov and Pirallahi Islands in the Caspian Sea using 136 multi-temporal ENVISAT SAR images acquired for the period of 2006–2010.
Computation of oil spill frequencies based on detected oil spills from 136 multi-temporal ENVISAT SAR images for the determination of spatiotemporal distribution trends of oil spills and hot spots with persistence and temporal repetition of regular oil pollution in marine environment.
Approximation of probable oil leak sources at the Oil Rocks Settlement and around Chilov and Pirallahi Islands based on the frequencies of detected oil pollution.
Determination of spatial relationships among areas of detected oil spills, wind speeds and currents in the Caspian Sea.
Cross-validation of the achieved results using computed oil spill frequencies from multi-temporal ENVISAT SAR images and predicted contamination probability using stochastic oil spill modelling in OSCAR software.
This first research objective is performed for the detection of oil slicks based on the individual ENVISAT ASAR Wide Swath Medium Resolution radar satellite image. This second research objective is performed through the overlaid segmentation of detected oil spills using the geospatial analysis to compute oil spill frequencies. This third research objective is performed for the approximation of probable oil leak sources based on the detected oil spill frequencies. The forth research goal is to determine the spatial relationships between detected oil spills and natural factors as wind speeds and currents. The fifth goal is to cross-validate the detected oil spill frequencies from 136 multi-temporal ENVISAT images with stochastic oil spill modelling of contamination probability based on the OSCAR software.
A number of research activities were performed for the studies of oil pollution in the Caspian Sea using SAR technologies. One of the research activities for the studies of oil pollution around the Oil Rocks Settlement was performed by Ivanov et al. (Citation2012) using RADARSAT-2 satellite images. The research of Ivanov et al. (Citation2012) focused on the determination of oil slicks, assessment of negative environmental situation around the Oil Rocks Settlement, correlation between oil spill area and wind speed and optimal polarization mode for the detection of oil spills using SAR images. Another research of Ivanov and Zatyagalova (Citation2008) emphasized the role of geographical information systems (GIS) in the qualitative and quantitative characterization of spatiotemporal distribution of oil spills and in the assessment of environmental conditions of sea basins as a whole. Zatyagalova et al. (Citation2007) applied the ENVISAT SAR imagery for mapping and estimation of natural oil seeps in the South Caspian Sea. The research of Zatyagalova et al. (Citation2007) focused on the estimation of natural oil seeps from SAR images in the relationship to bathymetry, geophysical and seismic data and showed that the main hydrocarbon contribution visible on the Caspian Sea surface as oil slicks comes from the natural seepage. The automated oil spill detection based on the SAR images and validation using the GNOME (General NOAA Operational Modeling Environment) oil spill trajectory model was performed by Li et al. (Citation2010).
2. Study area
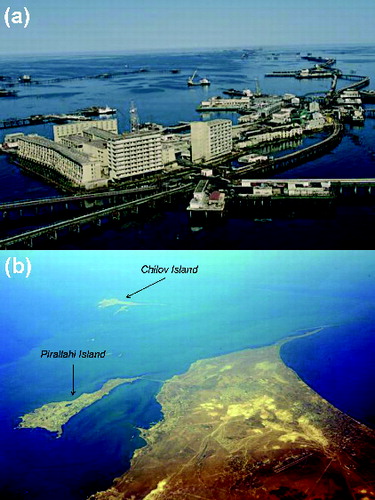
The Oil Rocks Settlement, Chilov and Pirallahi Islands in the Caspian Sea were selected as the research areas because of their long-term oil exploration history. The difference is that the Oil Rocks Settlement is artificially developed one whereas Chilov and Pirallahi Islands have the natural origin. The Oil Rocks is an industrial settlement in Baku, Azerbaijan. It is located 35 km from the coast of the Caspian Sea. The Oil Rocks is a functional city with a population of about 2000 and with a length from east to west over 300 km. The map of the Oil Rocks Settlement, Chilov and Pirallahi Islands is presented in . The settlement of the Oil Rocks was built in 1949 after oil was discovered there at 1100 m beneath the Caspian Sea and it became the first offshore oil infrastructure based on the steel trestle bridges joining the man-made islands in Azerbaijan (a)). By 1951, the Oil Rocks Settlement was ready for production with the equipped infrastructure needed at the time. In 1952, the systematic construction of trestle bridges connecting the artificial islands was begun. Chilov Island is located 16 km from the coast of the Caspian Sea. Pirallahi Island is located 1.6 km from the coast of the Caspian Sea (b)). Oil deposits on the northern part of Pirallahi Island are estimated at 1.2 million tons.
Figure 1. Map of the Oil Rocks Settlement, Pirallahi and Chilov Islands.
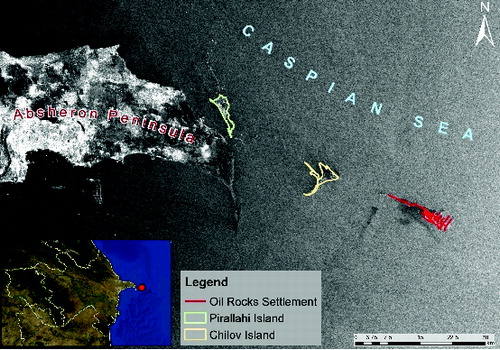
Figure 2. (a) Picture of the Oil Rocks Settlement; (b) picture of Pirallahi and Chilov Islands.
3. Data processing
3.1. ENVISAT ASAR Wide Swath Medium Resolution images for oil spill detection
ENVISAT ASAR Wide Swath Medium Resolution radar satellite images were used for the purpose of oil slick detection, computation of oil spill frequencies and approximation of oil leak sources using 136 multi-temporal ENVISAT SAR images acquired during 2006–2010. On 1 March 2002, ESA's ENVISAT satellite was launched, and data from sensors like ASAR – operating at C-band were available until ENVISAT operational services finished in April 2012. ENVISAT ASAR data come in different modes with different spatial resolutions and coverage. ENVISAT data is available in image, wave, and alternating polarization modes at approximately 30 × 30 m in the highest resolution, approximately 150 × 150 m in Wide Swath Mode, and at 1 km pixel resolution in Global Monitoring Mode. ENVISAT ASAR Wide Swath Medium Resolution images have a swath width of 400 km, and 150 m pixel spacing. Wide Swath Mode uses ScanSAR technique with VV (vertical transmit and vertical receive) or HH (horizontally transmitted and horizontally received) polarisation. The VV polarisation mode was used for the present research because of the technical suitability for the oil spill detection.
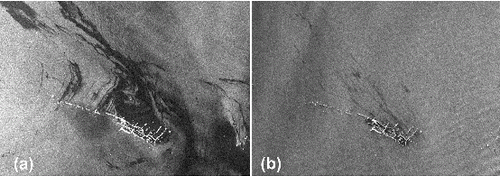
The appearance of oil slicks in SAR imagery depends on the Caspian Sea conditions during the acquisition in particular the wind speeds, currents and also on the oil parameters as spill age and oil type (Ivanov et al. Citation2012). If the wind speed is very low then the surface might be very smooth with low level of the backscatter causing difficulties in the detection of oil spill. In case of low wind speed, it can be possible to detect thin slicks but it may be difficult to separate thick slick (a)). Low wind areas can be misinterpreted as oil slicks. If on the other hand the wind speed is too high (>15 m/s) then the surface is very rough and waves are not noticeably attenuated by the oil. Also in this case, oil is hardly visible in the SAR images in a limited way. In case of high wind speed, advantage is that thick slicks can be detected whereas it can be difficult to detect thin slicks as it is shown in b).
Figure 3. (a) Identified and (b) non-identified oil patterns on the ENVISAT ASAR Wide Swath Medium Resolution images.
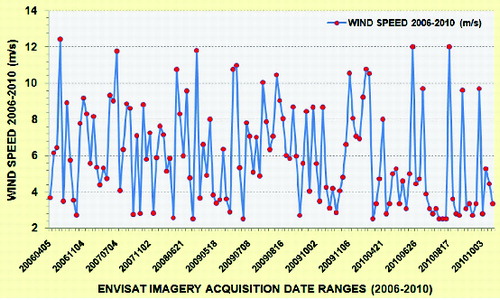
The time-series information of wind and current speeds and their directions in the Caspian Sea corresponding to the acquisition dates of ENVISAT images were accessed through the OSCAR software (a), (b)). OSCAR is the oil spill modelling software developed by SINTEF for deterministic and stochastic prediction of the fates and effects of oil released during an accidental release of oil, either from platforms or vessels. The models in OSCAR software account for weathering, the physical, biological and chemical processes affecting oil at sea. The wind speed and current data for the Caspian Sea were developed by Imperial College London. The wind and current data are provided at time intervals with a temporal resolution of 3 hours. The extents and count of suitable ENVISAT images for oil spill detection during 2006–2010 are presented in (a)–(e)) and , respectively. The suitability of SAR images for oil spill detection was determined based on the visual interpretation of all acquired ENVISAT Wide Swath Medium Resolution images during 2006–2010 and further consideration of wind and current speeds and their directions for imagery acquisition dates and time. The wind speeds of suitable 136 multi-temporal ENVISAT images 2006–2010 for oil spill detection are presented in . As it is possible to observe in , the wind speed range is 2.5–12.4 m/s.
Figure 4. Example snapshots of Caspian sea winds and currents visualized in OSCAR for date and time of 2007-05-07 06:00.
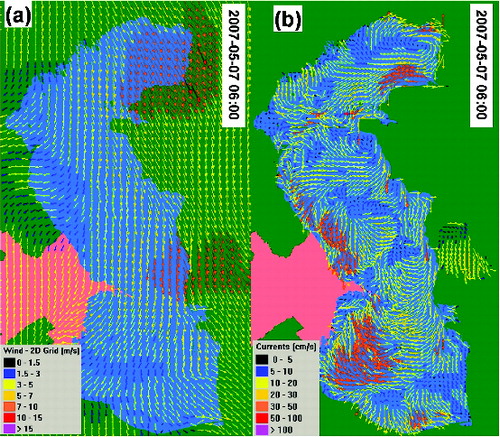
Figure 5. Extents of ENVISAT ASAR Wide Swath Medium Resolution images suitable for oil spill detection in (a) 2006; (b) 2007; (c) 2008; (d) 2009 and (e) 2010.
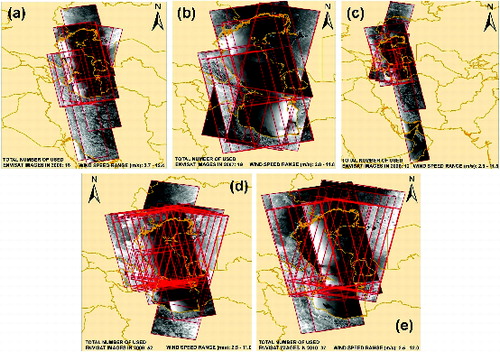
Table 1. Number of ENVISAT ASAR Wide Swath Medium Resolution images suitable for oil spill detection during 2006–2010.
Figure 6. Wind speeds of acquired 136 multi-temporal ENVISAT images suitable for oil spill detection.
3.2. Detection of oil spills around the Oil Rocks Settlement, Pirallahi and Chilov Islands
A number of automatic and semi-automatic oil spill detection algorithms were developed for the studies of environmental impacts of oil pollution in marine environment (Marghany Citation2001; Marghany et al. Citation2009; Marghany & Hashim Citation2011a; Marghany & Hashim Citation2011b; Marghany & Hashim Citation2011c; Marghany Citation2013). However limited automatic oil spill detection techniques were used in this research because of the non-significant territorial coverage of study area and main research focus on the assessment of environmental pollution. The workflow used for the semi-automatic oil spill detection, visual discrimination of oil slicks from look-alikes, computation of oil spill frequencies and approximation of leak sources is presented in .
Figure 7. Workflow for the detection of oil spills, computation of frequencies and approximation of oil leak sources.
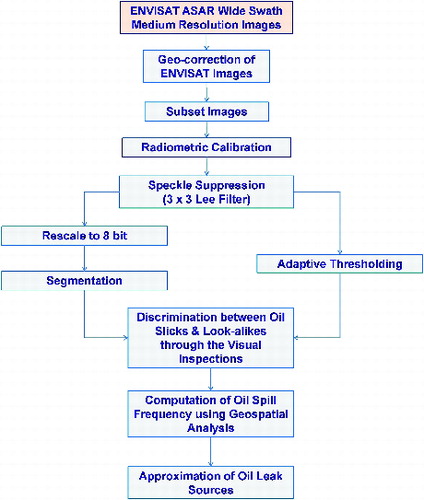
Geo-correction of each individual ENVISAT image is performed through the geo-coding relative to existing accurate geographic data of research area. This is performed for the achievement of reliable geospatial overlay analysis among detected oil spills from multi-temporal ENVISAT images. Subset of images to the extent of research area is performed to reduce the processing time of computations. Speckle filtering of the original SAR images is performed to produce better results in the process of semi-automatic detection of oil spills. The 3 × 3 Lee filter was applied to perform the speckle removal of ENVISAT images (Sheng & Xia Citation1996; Arvelyna et al. Citation2001; Capstick & Harris Citation2001). The first method used for oil spill detection is an adaptive thresholding dark spots detection algorithm in the Next ESA SAR Toolbox (NEST). It first estimates the mean backscatter level in a large window, then set a threshold which is k decibel below the estimated mean backscatter level. Pixels with backscatter values lower than the threshold are considered as potential oil spills. Finally the detected pixels are clustered and discriminated. Only those clusters that are larger enough are considered in the detection results. The following parameters were selected to be optimum in the NEST software for the detection of oil spills around Oil Rocks Settlement, Chilov and Pirallahi Islands: Threshold shift (the detecting threshold shift in decibels lower than the local mean backscatter level) – 0.01, background window size (the window size in pixels for computing local mean backscatter) – 300, minimum cluster size (the minimum cluster size in square kilometres) – 0.5.
Image segmentation method developed by Ruefenacht et al. (Citation2003) in ERDAS IMAGINE software was used for the segmentation of filtered and rescaled ENVISAT images to detect oil spills. This module iteratively compares the Euclidian spectral distance between the first pixel in the image, the seed pixel, and the adjacent cells. If the Euclidian spectral distance between the two cells is less than or equal to the threshold value specified by the user, the pixel is assigned to the same region as the seed. The region is finished when there are no more cells adjacent to a member in the group that satisfy the threshold criteria. When the region is closed, the next seed pixel is selected and the process is repeated. The following image segmentation parameters were selected to be optimum for the detection of oil spills around the Oil Rocks Settlement, Chilov and Pirallahi Islands in ERDAS IMAGINE software: edge detection threshold (threshold used in edge detection) – 18, edge detection minimal length (minimum acceptable length of the edge) – 3 pixels, image segmentation minimal value difference (minimum value difference between neighbouring segments) – 15, image segmentation variance factor (variation factor specifying how important a role that variation in pixel values within the same segment will play in determining whether to expand the segment or not) – 3.5.
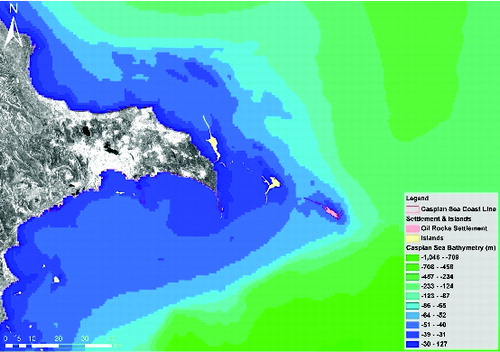
After the preliminary detection of dark spots using adaptive thresholding and segmentation principles, visual discrimination between look-alikes and oil spills is primarily based on the consideration of following aspects for the interpretation of dark spots: shape, size, area, dB-contrast, edge type, texture, persistency and temporal repetition. Second, contextual information as wind and current speeds and directions, location of oil and gas platforms, pipelines and vessels are additionally considered to remove look-alikes. Third, the following Caspian Sea features are considered for the discrimination of look-alikes and oil spills: the shallow water areas along the coastal zones of the Caspian Sea using bathymetry data (), upwelling driven by coastal currents, eddies, atmospheric attenuation caused by rain, dense fog, aerosols, calm sea caused by no-wind, in-flow of river systems, etc.
Figure 8. Caspian sea bathymetry for the area of the Oil Rocks Settlement, Chilov and Pirallahi Islands.
3.3. Computation of oil spill frequencies and approximation of leak sources
Geospatial overlay segmentation analysis of detected oil spills from 136 multi-temporal ENVISAT SAR images is performed to compute oil spill frequencies around the Oil Rocks Settlement, Chilov and Pirallahi Islands. It is obvious that the selected 136 ENVISAT images useful for oil spill detection are limited number of SAR images for the computation of oil spill frequencies during 2006–2010, but to the extent possible it describes the general situation with the persistence and temporal repetition of environmental pollution around the Oil Rocks Settlement, Chilov and Pirallahi Islands. The oil spill frequencies are also used for the approximation of leak sources based on the repeatability of observed oil spills at the Oil Rocks Settlement and around Chilov and Pirallahi Islands. The exponential regression analysis were performed between detected oil spill areas from 136 multi-temporal ENVISAT images and wind speeds accessed through the OSCAR software to understand the role of winds in the spatiotemporal distribution of observed oil pollution during 2006–2010. The spatiotemporal patterns of currents were also observed to understand the role of currents in the spatial distribution of oil spills around the Oil Rocks Settlement, Chilov and Pirallahi Islands.
3.4. Cross-validation of oil spill frequencies from 136 multi-temporal ENVISAT images and predicted contamination probability by stochastic modelling in OSCAR software
The statistical or stochastic modelling of OSCAR software provides insight in how a typical oil spill scenario behaves under a wide range of weather or seasonal conditions based on the multi-year data of Caspian Sea winds and currents within OSCAR software. According to Ivanov and Vostokov et al. (Citation2004), the approximate release of oil from the Oil Rocks Settlement is 5–15 kilograms per ton. The daily oil extraction is around 2500–3000 tons. This means that the approximate maximum daily environmental oil pollution is around 50 tons. The stochastic model of OSCAR software was used for the contamination probability prediction of oil spill around the Oil Rocks Settlement. This model was not run for Chilov and Pirallahi Islands because approximate release rates were not available. The simulation was performed for the period of one year with 576 simulations and 10 day duration of each simulation using 2006–2009 multi-year data of currents and winds. The oil type selected for the running of the model was appropriate to the Oil Rocks Settlement. The release temperature for oil was set to 10˚ and the water salinity 35 ppt.
4. Results
4.1. Detected hot spots from oil spill frequencies and approximated leak sources
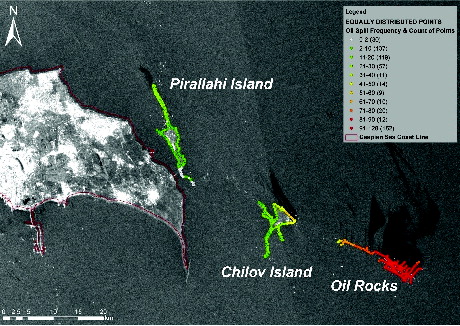
The map and areas of oil spill frequencies computed based on the 136 multi-temporal ENVISAT images suitable for oil spill detection during 2006–2010 are presented in and , respectively. Maps of monthly oil spill frequencies computed based on the same 136 multi-temporal ENVISAT images are presented in –. The achieved oil spill frequencies and areas does not obviously cover the whole range of frequencies because these computations are explicitly based on the acquired and selected number of useful 136 multi-temporal ENVISAT images for oil spill detection around Oil Rocks Settlement, Chilov and Pirallahi Islands to make the general persistence and temporal repetition assessment of regular environmental oil pollution. This approach allowed to detect hot spots with high frequencies of oil spills and their spatial distribution (). The detection of oil spills from 136 multi-temporal ENVISAT ASAR Wide Swath Medium Resolution images and geospatial multi-temporal overlay analysis contributed to the increase of the accuracy and reliability of detected oil spills, to computation of oil spill frequencies by criticality level and determination of the hotspots of regular oil spills. The oil spill areas with no temporal repetition within 136 multi-temporal ENVISAT images and far away from the oil spill sources were not presented because of the lower reliability of regular occurrence. The approximated leak sources based on the count of oil spill frequencies assigned to rationally distributed points at Oil Rocks Settlement and around Chilov and Pirallahi Islands are presented in . It is possible to observe that the most critical classes of oil leaks are located around the Oil Rocks Settlement. The overall achieved results provide a reliable basis for planning of cleaning activities around the Oil Rocks Settlement, Chilov and Pirallahi Islands.
Figure 9. Map of oil spill frequency around the Oil Rocks, Chilov and Pirallahi Islands in 2006–2010.
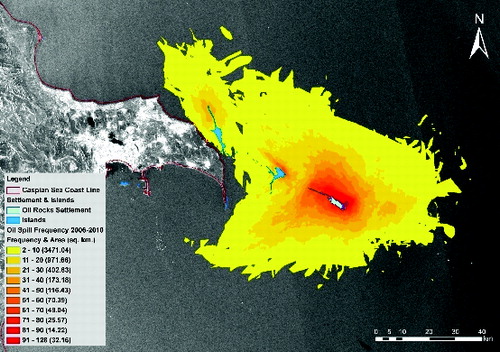
Table 2. Oil spill frequencies and areas computed from suitable 136 multi-temporal ENVISAT Wide Swath Medium Resolution images for oil spill detection.
Figure 10. Map of monthly oil spill frequency around the Oil Rocks, Chilov and Pirallahi Islands during 2006.
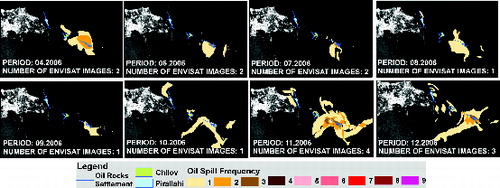
Figure 11. Map of monthly oil spill frequency around the Oil Rocks, Chilov and Pirallahi Islands during 2007.
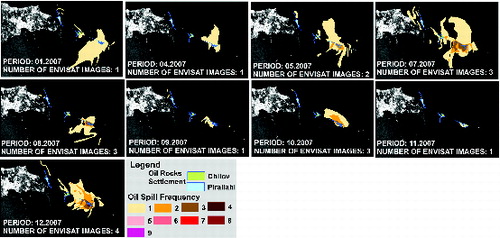
Figure 12. Map of monthly oil spill frequency around the Oil Rocks, Chilov and Pirallahi Islands during 2008.
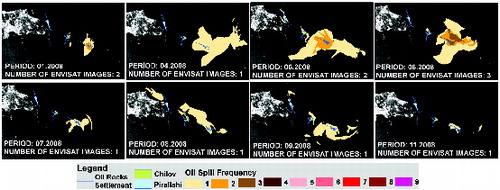
Figure 13. Map of monthly oil spill frequency around the Oil Rocks, Chilov and Pirallahi Islands during 2009.
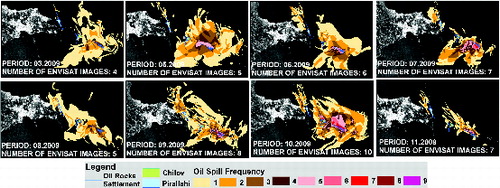
Figure 14. Map of monthly oil spill frequency around the Oil Rocks, Chilov and Pirallahi Islands during 2010.
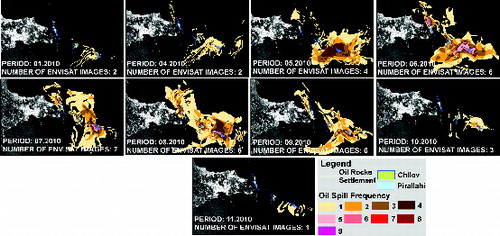
Figure 15. Map of oil leak sources at Oil Rocks, Chilov and Pirallahi Islands based on the oil spill frequency 2006–2010.
4.2. Spatial relationship among wind speeds, currents and oil spills
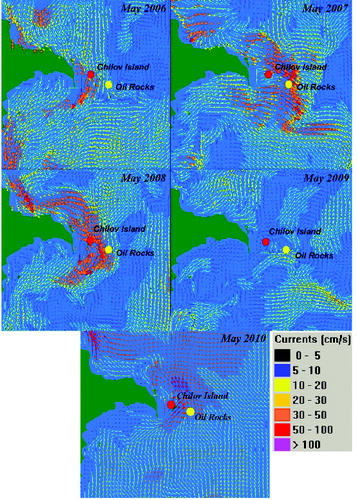
The exponential regression analysis between wind speeds from OSCAR software and detected oil slick areas from 136 multi-temporal ENVISAT images acquired during 2006–2010 revealed R2 equal to 63% (). This means that wind speed is one of the most important factors controlling spatiotemporal changes of oil slick areas around the Oil Rocks Settlement, Chilov and Pirallahi Islands. The exponential regression model showed that larger areas of oil spills were observed with decreasing wind speeds. The developed NRCS1 and NRCS2 for one of the selected images with large coverage of detected oil spill equal to 1450 sq km also showed the low wind speed range of 2.5–4.5 m/s for the low-intensity areas of oil spill on the ENVISAT image (–). Wind speeds and directions are major factors which shape the currents in the Caspian Sea. The prolonged shape and topography of the seashore and seabed of the Caspian Sea also exerts a substantial impact on the nature of the currents. It is well known that winds and currents are those factors, which affect the oil slick sizes and shapes. As it is possible to observe in , the Caspian Sea currents show the dynamic multi-directional patterns and speed, which explain spatial variations of oil spills in different directions around the Oil Rocks Settlement, Chilov and Pirallahi Islands.
Figure 16. Exponential regression analysis between wind speeds from OSCAR software and detected oil slick areas from ENVISAT images acquired during 2006–2010.
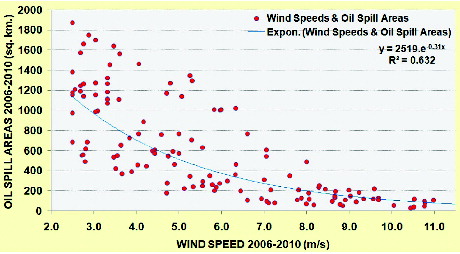
Figure 17. Map of normalized radar cross sections based on the ENVISAT radar images acquired on 18 May 2009 at 18:29.
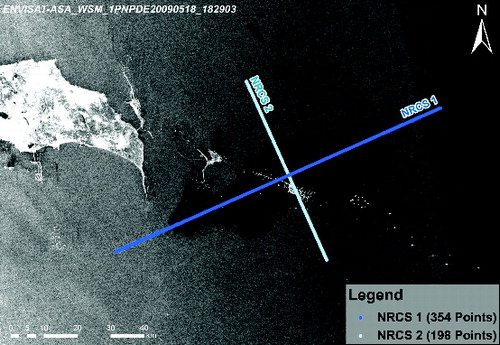
Figure 18. (a) Normalized radar cross Section 1 and wind speed (b) normalized radar cross Section 2 and wind speed.
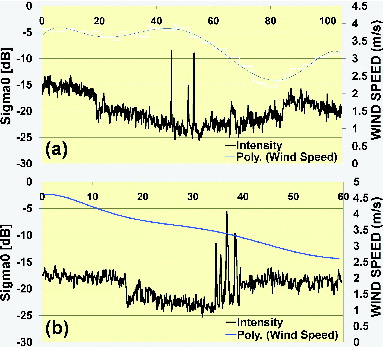
Figure 19. Wind speed from OSCAR System for 18 May 2009 at 18:29; (a) vector model and (b) grid odel.
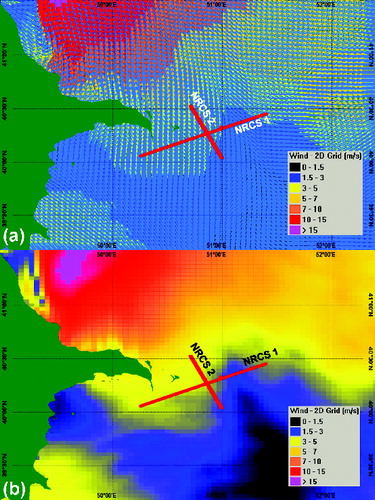
Figure 20. Caspian Sea currents around the Oil Rocks Settlement, Chilov and Pirallahi Islands.
4.3. Oil spill frequencies computed from 136 multi-temporal ENVISAT images and oil contamination probability predicted by the stochastic model in OSCAR
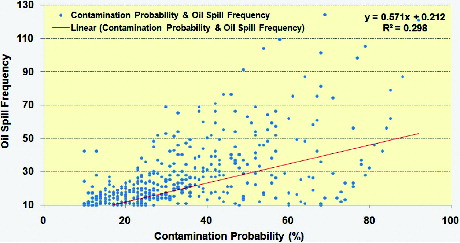
The stochastic oil spill modelling by the prediction of contamination probability in the OSCAR software was used for the cross-validation with the oil spill frequencies computed from detected oil spills using 136 multi-temporal ENVISAT images. As it is possible to observe in , the oil spill frequencies more than 20 were also predicted by the stochastic oil spill modelling with the contamination probability of 10. As it was expected, high oil spill frequencies and contamination probability were growing towards the Oil Rocks Settlement. The positive trend of the regression analysis showed that the oil frequencies were increasing with higher contamination probability (). However, it was possible to observe the significant spatial variations of oil spill frequencies computed from ENVISAT images and predicted contamination probability by OSCAR software. This was also expressed in low regression coefficient equal to 30% ().
Figure 21. Oil spill frequencies and oil contamination probability around the Oil Rocks Settlement.
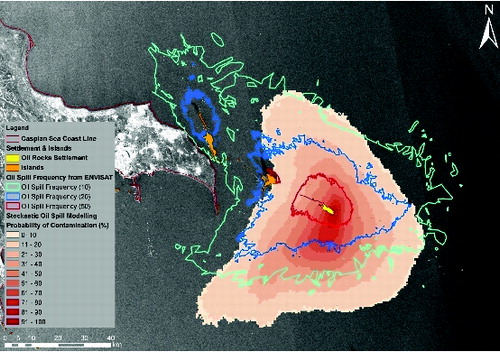
Figure 22. Linear regression analysis between contamination probability and oil spill frequencies.
These differences can be explained by the uncertainties of the input hydrodynamic and wind data in the Caspian Sea, release rates and exact location of oil leak sources. On the other hand, this can be explained by the fact that the number of acquired suitable 136 multi-temporal ENVISAT images during 2006–2010 for oil spill detection was limited to model the oil spill frequencies around the Oil Rocks Settlement, Chilov and Pirallahi Islands. Therefore, the detected oil spills based on the multi-temporal SAR images can significantly contribute to the improved prediction of oil spill distribution around the Oil Rocks Settlement, Chilov and Pirallahi Islands and vice versa the stochastic oil spill modelling can support in the determination of the inconsistency of SAR images for the assessment of oil spill frequencies.
5. Conclusions
Oil slicks were mainly detected on 136 multi-temporal ENVISAT Wide Swath Medium Resolution images acquired under the Caspian Sea wind speed range of 2.5–12.4 m/s. The following oil spill frequencies computed based on 136 multi-temporal ENVISAT images were observed around the Oil Rocks Settlement, the Chilov and Pirallahi Islands during 2006–2010: 2–10 (3471.04 sq km), 11–20 (971.66 sq km), 21–50 (692.44 sq km), 51–128 (191.38 sq km). The persistence and temporal repetition of oil spills prove the continuous environmental pollution around the Oil Rocks Industrial Settlement, Chilov and Pirallahi Islands and provide the hot spots of oil concentration for planning of cleaning activities. It was also determined that the most critical oil leak sources were observed around the Oil Rocks Settlement with the frequency range of 41–128. The frequency ranges of 0–30 and 11–60 were observed at Pirallahi and Chilov Islands, respectively.
The exponential regression analysis between wind speeds and detected oil slick areas from 136 multi-temporal ENVISAT images for the period of 2006–2010 revealed the regression coefficient equal to 63%. The regression model showed that larger oil spill areas were observed with decreasing wind speeds. The developed NRCS1 and NRCS2 for one of the selected images with large coverage of detected oil spill equal to 1450 sq km also showed the low wind speed range of 2.5–4.5 m/s for the low-intensity areas of oil spill on the ENVISAT image. The spatiotemporal patterns of currents in the Caspian Sea explained the multi-directional spatial distribution of oil spills around the Oil Rocks Industrial Settlement, Chilov and Pirallahi Islands.
The positive trend of the regression analysis showed that the oil spill frequencies computed from 136 multi-temporal ENVISAT images were increasing with higher contamination probability predicted by OSCAR software. The linear regression analysis between detected oil spill frequencies from ENVISAT images and stochastic contamination probability predicted by OSCAR oil spill modelling software showed the positive trend with the regression coefficient of 30%. However, it was possible to observe the significant spatial variations of oil spill frequencies computed from ENVISAT images and predicted contamination probability by OSCAR software. These differences can be explained by the uncertainties of the input hydrodynamic and wind data in the Caspian Sea, release rates and exact location of oil leak sources. On the other hand, this can be explained by the fact that the number of acquired suitable ENVISAT images during 2006–2010 for oil spill detection was limited to model the oil spill frequencies around the Oil Rocks Settlement, Chilov and Pirallahi Islands. Therefore, the detected oil spills based on the multi-temporal SAR images can significantly contribute to the improved prediction of oil spill distribution around the Oil Rocks Settlement, Chilov and Pirallahi Islands and vice versa the stochastic oil spill modelling can support in the determination of the inconsistency of the SAR images for the detection of oil spill frequencies and approximation of leak sources.
Acknowledgements
We would like to acknowledge European Space Agency (ESA) for the provision of access to ENVISAT images to implement this research.
Disclosure statement
No potential conflict of interest was reported by the authors.
Funding
This work was supported by European Space Agency (ESA) [grant number 15837].
References
- Akar S, Lutfi Süzen M, Kaymakci N. 2011. Detection and object-based classification of offshore oil slicks using ENVISAT-ASAR images. Environ Monitor Assess. 183:409–423.
- Arvelyna Y, Oshima M, Kristijono A, Gunawan I. 2001. Auto segmentation of oil slick in Radarsat SAR image data around Rupat Island Malacca Strait. Proceedings of ACRS 2001, 22nd Asian Conference on Remote Sensing; 2001 Nov 5–9. Centre for Remote Imaging, Sensing and Processing (CRISP), Singapore: National University of Singapore.
- Brekke C, Solberg AHS. 2005. Oil spill detection by satellite remote sensing. Remote Sensing Environ. 95:1–13.
- Capstick D, Harris R. 2001. The effects of speckle reduction on classification on ERS SAR data. Int J Remote Sensing. 18:3627–3641.
- Coppini G, De Dominicis M, Zodiatis G, Lardner R, Pinardi N, Santoleri R, Colella S, Bignami F, Hayes DR, Soloviev D, et al. 2011. Hindcast of oil-spill pollution during the Lebanon crisis in the Eastern Mediterranean, July–August 2006. Marine Pollut Bull. 62:140–153.
- Del Frate F, Petrocchi A, Lichtenegger J, Calabresi G. 2000. Neural networks for oil spill detection using ERS-SAR data. IEEE Trans Geosci Remote Sensing. 5:2282–2287.
- Espedal HA. 1998. Detection of oil spill and natural film in the marine environment by spaceborne synthetic aperture radar [PhD thesis]. Bergen: Department of Physics University of Bergen and Nansen Environment and Remote Sensing Center.
- Espedal HA, Johannessen OM. 2000. Detection of oil spills near offshore installations using synthetic aperture radar (SAR). Int J Remote Sensing. 21:2141–2144.
- Espedal HA, Wahl T. 1999. Satellite SAR oil spill detection using wind history information. Int J Remote Sensing. 20:49–65.
- Friedman KS, Pitchel WG, Clemente-Colon P, Li X. 2002. GoMEx – an experimental GIS system for the Gulf of Mexico Region using SAR and additional satellite and ancillary data. International Geoscience and Remote Sensing Symposium, IGARSS '02. 2002 IEEE International. doi: 10.1109/IGARSS.2002.1027177
- Gade M, Scholz J, & von Viebahn C. 2000. On the detectability of marine oil pollution in European marginal waters by means of ERSSAR imagery. Proceedings IGARSS 2000; 2000 Jul 24–28. Honolulu, HI: IEEE.
- Girard-Ardhuin F, Mercier G, Garello R. 2003. Oil slick detection by SAR imagery: Potential and limitation. IEEE/MTS Proceedings of the Marine Technology and Ocean Science Conference OCEANS2003; 2003 Sep 22–26; San Diego, CA: IEEE.
- Ivanov AY, Dostovalov MY, Sineva AA. 2012. Characterization of oil pollution around the oil rocks production site in the Caspian Sea using spaceborne polarimetric SAR imagery. Izvestiya, Atmospheric Oceanic Phys. 48:1014–1026.
- Ivanov AY, Fang M, He M-X, Ermoshkin IS. 2004. An experience of using Radarsat, ERS-1/2 and Envisat SAR images for oil spill mapping in the waters of the Caspian Sea, Yellow Sea and East China Sea. Envisat and ERS Symposium; 2004 Sep 6–10; Salzburg, Austria ( ESA SP-572).
- Ivanov AY, Vostokov SV, Ermoshkin IS. 2004. Mapping oil films on the sea surface using synthetic aperture radar images (the Caspian Sea as an example) [in Russian]. Earth Observation Space. 4:82–92.
- Ivanov AY, Zatyagalova VV. 2008. A GIS approach to mapping oil spills in a marine environment. Int J Remote Sensing. 29:6297–6313.
- Karantzalos K, Argialas D. 2008. Automatic detection and tracking of oil spills in SAR imagery with level set segmentation. Int J Remote Sensing. 29:6281–6296.
- Kotova LA, Espedal HA, Johannessen OM. 1998. Oil spill detection using spaceborne SAR; a brief review. Proceedings of 27th ISRSE; Tromsb.
- Kubat M, Holte RC, Matwın S. 1998. Machine learning for the detection of oil spills in satellite radar images. Machine Learn. 2–3:195–215.
- Leifer I, Luyendyk B, Broderick K. 2006. Tracking an oil slick from multiple natural sources, Coal Oil Point, California. Marine Petroleum Geol. 23:621–630.
- Li X, Pichel W, Cheng Y, Garcia-Pineda O, Liu P, Streett D, Gallegos S. 2010. Oil Spill Response Utilizing SAR Imagery in the Gulf of Mexico. Proceedings of SEASAR 2010 Workshop; 2010 Apr 1; Frascati.
- Lu J. 2003. Marine oil spill detection, statistics and mapping with ERS SAR imagery in south-east Asia. Int J Remote Sensing. 24:3013–3032.
- Lu J, Lim H, Liew SC, Bao M, Kwoh LK. 1999. Ocean oil pollution mapping with ERS synthetic aperture radar imagery. Proceedings of IGARSS '99; 1999 Jun 28–Jul 02; Hamburg: IEEE.
- Marghany M. 2001. RADARSAT automatic algorithms for detecting coastal oil spill pollution. Int J Appl Earth Observation Geo-information. 3:191–196.
- Marghany M. 2013. Genetic algorithm for oil spill automatic detection from Envisat Satellite Data. In: Murgante B, Misra S, Carlini M, Torre CM. , Nguyen H, Taniar D, Apduhan BO, Gervasi O, editors. ICCSA 2013, Part II. LNCS; Heidelberg: Springer.
- Marghany M, Cracknell A, Hashim M. (2009). Modification of fractal algorithm for oil ppill detection from RADARSAT-1 SAR data. Int J Appl Earth Observation Geoinformation. 11:96–102.
- Marghany M, Hashim M. 2011a. Comparison between Mahalanobis classification and neural network for oil spill detection using RADARSAT-1 SAR data. Int J Phys Sci. 6(3): 566–576.
- Marghany M, Hashim M. 2011b. Discrimination between oil spill and look-alike using fractal dimension algorithm from RADARSAT-1 SAR and AIRSAR/POLSAR data. Int J Phys Sci. Oil-Spill Pollution Remote Sensing by Synthetic Aperture Radar. Available from: http://dx.doi.org/10.5772/5747747
- Marghany M, Hashim M. 2011c. Comparative algorithms for oil spill automatic detection using multimode RADARSAT-1 SAR data. IEEE International Geoscience and Remote Sensing Symposium.
- Martinez A, Moreno V. 1996. An oil spill monitoring system based on SAR images. Spill Sci Technol Bull. 1–2:65–71.
- O'Brein GW, Lawrence GM, Williams AK, Glenn K, Barrett AG, Lech M, Edwards DS, Cowley R, Boreham CJ, Summons RE. 2005. Yampi Shelf, Browse Basin, North-West Shelf, Australia: a test-bed for constraining hydrocarbon migration and seepage rates using combinations of 2D and 3D seismic data and multiple, independent remote sensing technologies. Marine Petroleum Geol. 22:517–549.
- Ruefenacht B, Vanderzanden D, Morrison M. 2003. New technique for segmenting images. Utah: USDA Forest Service Remote Sensing Applications Center.
- Sheng Y, Xia Z. 1996. A comprehensive evaluation of filters for radar speckle suppression. Proceedings of the International Geoscience and Remote Sensing Symposium IGARSS'96; 1996 May 27–31. Lincoln, NE: IEEE.
- Solberg AHS, Storvik G, Solberg R, Volden E. 1999. Automatic detection of oil spills in ERS SAR images. IEEE Trans Geosci Remote Sensing. 37:1916–1924.
- Topouzelis KN. 2008. Oil spill detection by SAR images: dark formation detection, feature extraction and classification algorithms. Sensors. 8:6642–6659.
- Topouzelis K, Karathanassi V, Pavlakis P, Rokos D. 2002. Oil spill detection: SAR multi-scale segmentation and object features evaluation. 9th International Symposium on Remote Sensing (SPIE); 2002 Sep 23–27. Crete.
- Topouzelis K, Muellenhoff O, Ferraro G, Tarchi D. 2007. Satellite mapping of oil spills in the East Mediterranean sea. Proceedings of the 10th International Conference on Environmental Science and Technology; 2007 Sep 5–7; Greece: Kos Island.
- Zatyagalova VV, Ivanov AY, Golubov BN. 2007. Application of Envisat SAR imagery for mapping and estimation of natural oil seeps in the South Caspian Sea. In: Lacoste H, Ouwehand L, editors. Proceedings of the Envisat Symposium-2007; 2007 Apr 23–27; Montreux (ESA SP-636), CD-ROM. Noordwijk: ESA Publication Division.
- Ziemke T. 1996. Radar image segmentation using recurrent artificial neural networks. Pattern Recognition Lett. 4:319–334.
- Zodiatis G, Lardner R, Solovyov D, Panayidou X, De Dominicis M. 2012. Predictions of oil slicks detected from satellite images using MyOcean forecasting data. Ocean Sci. 8:1105–1115.