
Abstract
On 30 May 2013, a forest fire occurred in Izmir, Turkey causing damage to both forest and fruit trees within the region. In this research, pre- and post-fire SPOT-6 images obtained on 30 April 2013 and 31 May 2013 were used to identify the extent of forest fire within the region. SPOT-6 images of the study region were orthorectified and classified using pixel and object-based classification (OBC) algorithms to accurately delineate the boundaries of burned areas. The present results show that for OBC using only normalized difference vegetation index (NDVI) thresholds is not sufficient enough to map the burn scars; however, creating a new and simple rule set that included mean brightness values of near infrared and red channels in addition to mean NDVI values of segments considerably improved the accuracy of classification. According to the accuracy assessment results, the burned area was mapped with a 0.9322 kappa value in OBC, while a 0.7433 kappa value was observed in pixel-based classification. Lastly, classification results were integrated with the forest management map to determine the effected forest types after the fire to be used by the National Forest Directorate for their operational activities to effectively manage the fire, response and recovery processes.
1. Introduction
The Mediterranean region has been exposed to forest destruction due to forest fires in the region caused by human-induced behaviours or natural conditions, such as vegetation, meteorology and topography. An estimated average of 600,000–800,000 ha forests are burned as a result of more than 50,000 fires every year (EU Report Citation2014). Land-use changes and global warming have been causing the increase of forest fires in the Mediterranean (Mitri & Gitas Citation2006).
According to the Turkish Statistical Institute's report, 86,769 forest fires occurred between 1937 and 2009 and affected 1,617,701 ha of forest. Most of the fires occurred in the Aegean and Mediterranean regions of Turkey, which have large forest areas and an arid-summer climate. The biggest 20 forest fires between 1978 and 2008 occurred in these two regions with forest loss ranging from 1200 and 14,000 ha (OGM Citation2014).
Burned area mapping is an important task to quantify the impact of fires on the economy and ecology, plan response, recovery and mitigation activities, as well as to create reference information for future planning (Polychronaki & Gitas Citation2012).
Gitas et al. (Citation2012) emphasized the need for high spatial and temporal resolution satellite images to address forest fires, considering that these data could provide the necessary information for forest and fire managers with the appropriate scale and accuracy.
For operational purposes, especially to support response activities during a forest fire, satellite images obtained immediately after the fire are most important. Moreover, national forest agencies in Turkey are working with a scale of 1/25,000 or better; therefore, urgent programming capability and spatial resolution of satellite images are crucial to obtain the desired scale and locational accuracy to meet the needs and requirements of these agencies.
In this paper, we have developed a new rule set to be used in a decision-tree based object-oriented classification to map burned areas using 1.5 m spatial resolution SPOT-6 images to compare the results of the object-based classification (OBC) model with a pixel-based supervised classification and to investigate the use of SPOT-6 images for operational purposes in the case of forest fires by finding fire-affected forest types and their spatial distribution.
2. Study area and data used
The forest fire investigated in this research occurred in Izmir, which lies over the first degree forest fire risk zone. The study area was situated from 38°33′14″ to 38°36′58″ north latitude and from 27°17′36″ to 27°21′09″ east longitude in the Aegean part of Turkey. According to meteorological records from the nearest station of the State Meteorological Institute, the temperature was 29 °C at the time of the fire with a relative humidity of 36%, and the wind speed was 10.8 km/h with direction of S–SE. The last rain was observed 16 days before the forest fire.
The SPOT-6 satellite was launched in 2012 and provides satellite images with 1.5 m high spatial resolution and 60 km swath width. The SPOT-6 satellite provides timely data of the Earth's surface and is able to receive tasking plans every 4 hours, which is valuable for urgent requests during disasters. Integration of weather forecasts into the tasking process provides great efficiency and minimizes the collection of cloudy images (AIRBUS Citation2014). In our case, the fire started on 30 May 2013 at approximately 11 am (UTC), urgent data acquisition with SPOT-6 satellite over the region was requested at 4 pm (UTC), and the data were received at 8:45 am (UTC) on 31 May 2013 to be used for operational purposes.
A forest management map of the region was obtained from the General Directorate of Forest in a vector format. According to the map that was produced from in situ measurements, the region was mostly covered with Pinus brutia and Pinus pinea. There was also a considerable amount of agricultural fields with permanent and annual crops. The ASTER Global Digital Elevation Model v.2 was used for the orthorectification and topographical analysis.
3. Methods
Both pre- and post-fire SPOT-6 images were orthorectified using RPC coefficients and digital elevation model (DEM) with an root mean square error (RMSE) value below 0.5 pixels before conducting classification and spatial analyses. Geometric accuracies of two images were analyzed, and it was observed that both images were aligned with each other with sub-pixel accuracy and geographically match the forest management vector map obtained from the General Directorate of Forest. All images and maps were projected to the UTM coordinate system and WGS84 datum.
Pixel-based classification methods analyze spectral properties of each pixel, whereas OBC methods consider spectral, spatial and contextual information of segments. In this study, pixel and OBC methods were applied to a single date (post-fire) image to detect burned areas and other land use/cover types in order to evaluate the efficiency of algorithms in the burned area mapping when only a post-fire image is available. A pre-fire image was used to determine the land cover types affected by the forest fire using the burned area boundary obtained from the classification of the post-fire image.
The maximum likelihood classification (MLC) approach was used in this research as the pixel-based classification algorithm, which is a parametric supervised method derived from the Bayesian theorem. It is difficult to distinguish pixels having similar spectral properties but belonging to different land cover classes using MLC. In this study, 50 samples were selected during the training site selection process prior to performing the land use and land cover (LULC) classification using MLC. After the process, information classes belonging to the same LULC category were merged and the final classification indicated six classes: burned area, forest 1 (forest areas having darker green leaves), forest 2 (forest areas having lighter green leaves), agriculture, impervious (roads, built-up areas, etc.) and excavation (mining sites) areas.
The OBC method has become an effective alternative to pixel-based classification methods with the launch of high-resolution satellites. This approach creates objects from pixels using a segmentation process. Parameters such as scale, layer weight, colour, shape and textural homogeneity are taken into account in segmentation (Alganci et al. Citation2013).
In this study, a multi-resolution segmentation approach was performed using eCognition Developer© v.8.9 software. Image layers were weighted according to their standard deviation values and the other parameters were defined experimentally in order to detect the fire scars as single and/or multiple objects. A bottom–up approach was performed for merging the small image objects to define real land use/cover objects. Each parameter set that was chosen experimentally resulted in different object sizes. Overall, “100” scale factor, “0.8” colour and “0.2” shape parameters set was found to be suitable for ideal object definition.
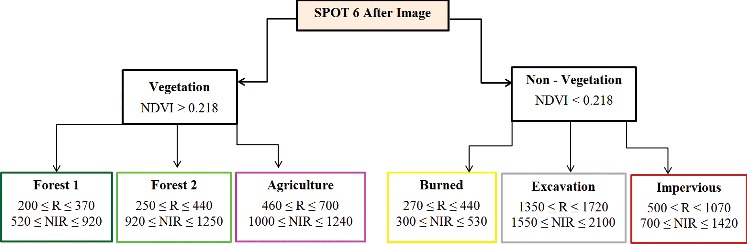
The second step was to perform classification from image objects. For this aim, a rule set was developed to determine the fire scars and other land use/cover classes. The rule set developed in this study was based on a decision tree of classes, where class descriptions were defined by membership functions. Membership functions were mainly defined by the thresholds of objects according to their spectral properties. Thresholds were evaluated experimentally using the normalized difference vegetation index (NDVI) and spectral bands. In the first step, image segments were classified into two main classes as vegetation and non-vegetation using the NDVI-based mean value threshold which is 0.218. As a second step, sub-classes were defined according to mean values of Red and near infrared (NIR) bands for the segments. Membership functions were determined for each sub-class according to thresholds of these two bands. Class definition steps for the OBC algorithm are given as a flowchart in . As observed in this figure, mean brightness value thresholds of Red and NIR bands for Burned Area class are “270–440” and “300–530,” respectively, while the thresholds for the Excavation class are “1350–1720” and “1550–2100,” respectively. Both of these classes have similar mean NDVI values, making differentiation impossible with only the NDVI data; however, applying the mentioned Red and NIR-based thresholds allowed for the separation of these classes.
Figure 1. Class membership definition flowchart for the OBC algorithm.
After the classification of satellite images, a burned area mask was created from the OBC results as a vector file to create the spatial distribution of burned areas and integrate it into the geographical information system (GIS) environment. Then, the burned area mask was overlaid with the forest management map and spatial statistics were calculated to determine the most affected forest types with respect to the crown closure and age.
Topographical properties of the land surface, such as aspect and slope mostly show a relationship with the spatial distribution and the propagation of fire (Alganci et al. Citation2010). In this research, slope and aspect maps derived from DEM were used for extracting the relationships of these parameters from the burn scars.
4. Results
In some forest fire cases, it might not be possible to obtain close dated pre-fire images, therefore, images obtained after the fire might be the only source for the burned area mapping. To address this issue, satellite image analyses results are presented in two different sections in this research. In the first section, post-fire image analysis results research are presented, while the second section presents the NDVI-based multi-temporal analysis considering the pre- and post-image availability.
4.1. Results obtained from using only post-fire satellite image
The post-fire SPOT-6 image was classified using a pixel and an OBC approach, and the results were compared to determine the more accurate method for this research (). Six different land cover classes were classified using two different classification approaches. Total areas of these classes obtained from classification are presented in .
Figure 2. Classification results of two different algorithms: (a) OBC, (b) MLC.
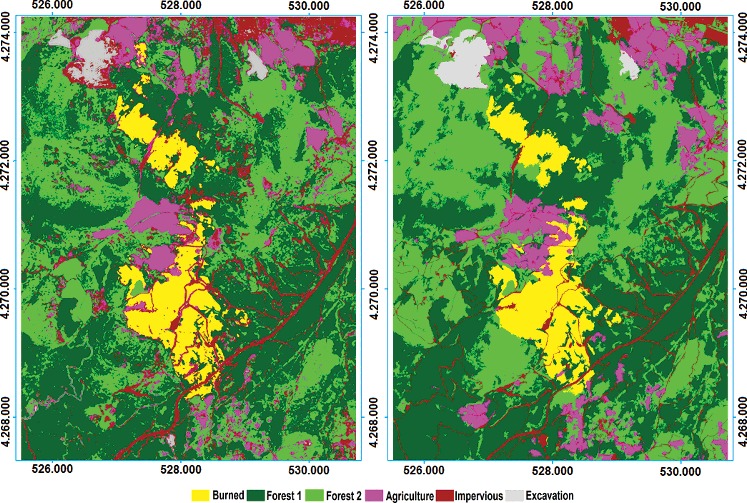
Table 1. Areal information of the classes, according to OBC and MLC algorithms.
A point-based accuracy assessment was performed for the OBC and MLC classification results of the study area with a total of 100 randomly checked control points. Class labels generated from the classified images and their corresponding ground references were defined using the original high resolution (HR) SPOT-6 image itself, Google Earth image library and photographs that were taken just after the fire. Points were selected over the OBC classified image and recorded to be used in the MLC results. gives the accuracy assessment results for both classification methods. The data presented in shows that the OBC approach increased the kappa value by nearly 13% compared to MLC, while this increment was approximately 19% for the burned area class.
Table 2. Accuracy assessment results for OBC and MLC analysis.
4.2. Results obtained from pre- and post-fire satellite images
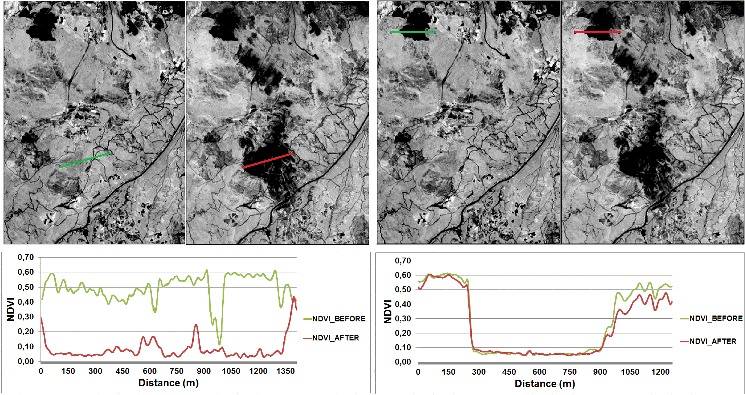
Different remote sensing analyses such as indices could be applied to pre- and post-fire satellite images to derive the information about the fire extent. The most popular index for the burn scar detection is known to be the normalized burn ratio index; however, this index requires a short wave infrared (SWIR) band that is mostly unavailable in HR and very high resolution (VHR) satellites. Conventional spectral vegetation indices, such as NDVI are also used for the burn scar detection in the lack of a SWIR band, especially when a multi-temporal image set is available. We used 6 m resolution multi-spectral SPOT-6 images obtained before and after the fire for the vegetation index analysis. The NDVI analysis was performed using top of atmosphere reflectance images in order to differentiate the healthy vegetation from the burned areas and other land cover classes. The transaction analysis was performed over different regions of the pre- and post-NDVI images in order to measure the performance of NDVI for the detection of burned areas ().
Figure 3. Cross sections derived from before and after NDVI images.
4.3. Spatial analysis and topographical properties of the burned areas
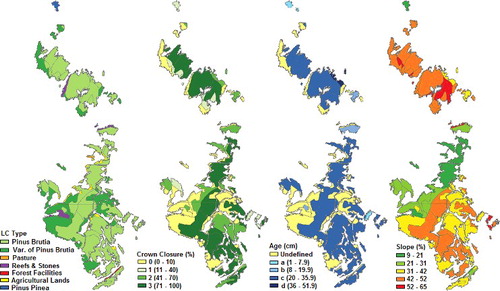
Burned area boundaries derived from OBC were overlaid with the forest type, crown closure, age and slope maps to check the relationships between these parameters and the burned area spatial extent. There are four different crown closure levels used by the General Directorate of Forest in Turkey. Ages of trees are categorized in five different levels based on the circumference measurements of tree trunks. To derive the relationship between burned areas and the topographic structure, the burned area vector and DEM data were subjected to overlay analysis. The statistical results of the closure, age and slope analysis are given in , while the spatial distribution maps are given in .
Table 3. Spatial statistical results.
Figure 4. Result maps produced from spatial analysis.
5. Discussions
According to the results of this study, OBC is superior to the MLC method in terms of the overall accuracy and kappa value. According to the accuracy assessment results of MLC, the burned area class tends to mix with the Forest 1 class, especially in hilly areas, where low spectral reflectance characteristics of forest become dominant due to shadows and show similarities to the burned area. The second issue with MLC was the mixture of agricultural lands with the Forest 2 class due to the similarity of reflectance. Lastly, excavation sites and impervious surfaces mixed especially for the boundaries of excavation and unpaved roads.
On the other hand, the OBC algorithm performed better in LULC mapping with creating more homogenous objects. This was especially true in agricultural lands and sparse forest areas. The MLC algorithm normally mixed the agriculture and forest with bare soil in their textural structure, however, due to the segmentation process of OBC, textural properties did not affect the original object boundary.
The results also showed that the availability of only the post-fire imagery might be a sufficient data source if the main aim is to determine the spatial distribution of burned areas. However, if information is needed for the land cover characteristics of burned areas before the fire, then usage of the pre-fire image or maps will be necessary. It can be asserted that when the detailed forest management map is unavailable, classification of the pre-fire image can provide valuable information about the forest type and the density in burned areas. However, in our research, we used the forest management map to determine the most affected land cover and forest type classes. In the event of lack of a pre-fire image, this type of map will also be beneficial for fire impact analyses.
According to the transaction analysis over the NDVI images, there was an obvious decrease on NDVI values for burn scars from 0.50–0.60 to 0.03–0.15. However, excavation sites also showed low NDVI characteristics between 0.03–0.10 in both before and after images (). This similarity was also obvious in roads and urban areas located in the upper right part of the images. These results lead us to the need for more complicated classification analysis instead of only NDVI-based analysis for burned area detection when only a post-fire image is available. The NDVI-based analysis seems to be effective in a change detection analysis when a multi-temporal image set is available.
The spatial statistical results showed that forest types having a closure level of 3 were affected most by the fire with a total area of 123.50 ha. Moreover, trees having an age of level 3 were most affected by the fire with a total area of 168.45 ha. In addition to these analyses, it was found that areas having slope values 42%–52% were severely affected by fire. An aspect map of the region was also investigated but there was not a significant relationship between the burned areas and different aspect directions.
6. Conclusions
The results discussed in this study show that in both methods, misclassification tended to increase due to shadows. The ML classification also experienced difficulty due to factors, such as the varied shapes of the forest canopy and mixing of vegetation. The OBC classification, in contrast, relies on abstraction of comparatively homogenous areas, and proved capable of extracting the boundaries among all the forest types. We introduced a new and simple rule set based on mean NDVI and Red–NIR brightness value thresholds, which provided promising results to identify not only burned areas but also other land cover classes. This rule set may be adapted to other fire cases and other satellite sensor data to rapidly and accurately find the spatial extent of forest fires.
The capability of the SPOT-6 satellite to collect urgent mode imagery in emergency cases alongside its high spatial resolution are important assets for post-fire monitoring, accurate operational mapping of forest fire and supporting recovery teams and decision-makers to take immediate action soon after the fire. This research benefitted from the urgent data acquisition capability of the SPOT-6 satellite (post-fire image obtained just one day after the fire) and its high spatial resolution to accurately identify the extent of the burned area in a manner that was compatible with the accuracy and scale requirements of Governmental Forest Agencies.
Acknowledgements
The authors acknowledge the support of “Istanbul Technical University – Center for Satellite Communication and Remote Sensing” for providing Spot-6 satellite images and the “Republic of Turkey – General Directorate of Forest” for providing the Forest Management Map.
Disclosure statement
No potential conflict of interest was reported by the authors.
References
- AIRBUS. 2014. Airbus Defense & Space web site; [cited2014 June 23]. Available from: http://www.astrium-geo.com/en/147-spot-6-7-satellite-imagery
- Alganci U, Sertel E, Ormeci C. 2010. Forest fire damage estimation using remote sensing and GIS. In: Reuter R, editor. Proceedings of the 30th EARSeL Symposium - Remote Sensing for Science, Education, and Natural and Cultural Heritage; May 31–June 3; Paris, France: EARSeL. p. 423–430.
- Alganci U, Sertel E, Ozdogan M, Ormeci, C. 2013. Parcel level crop type identification using different classification algorithms and multiresolution imagery in Southeastern Turkey. Photogrammetric Eng Remote Sensing. 79(11):1053–1065.
- EU Report. 2014. Forest fires in the Mediterranian: a burning issue; [cited2014 June 10]. Available from: http://ec.europa.eu/environment/forests/pdf/meeting140504_wwffirstdocument.pdflast
- Gitas ZI, Mitri GH, Veraverbeke S, Polychronaki A. 2012. Advances in remote sensing of post-fire vegetation recovery monitoring – a review. In: Fatoyinbo L, editor. Remote sensing of biomass – principles and applications. INTECH, p. 143–176.
- Mitri GH, Gitas IZ. 2006. Fire type mapping using object-based classification of Ikonos imagery. Int J Wildland Fire. 15:457–462.
- OGM. 2014. Turkish General Directorate of Forest, Web Reports; [cited2014 June 15]. Available from: http://web.ogm.gov.tr/diger/Yanginhareket/Sayfalar/istatistiklerr.aspx
- Polychronaki A, Gitas IZ. 2012. Burned area mapping in Greece using SPOT-4 HRVIR images and object-based image analysis. Remote Sensing. 4:424–438.