
Abstract
On October 28, 2012, an earthquake occurred offshore Canada, with a magnitude Mw of 7.8, triggering a tsunami that propagated through the Pacific Ocean. The tsunami numerical model results show it would not be expected to generate widespread inundation on Hawaii. Yet, two hours after the earthquake, the Pacific Tsunami Warning Centre (PTWC) issued a tsunami warning to the state of Hawaii. Since the state was hit by several tsunamis in the past, regular siren exercises, tsunami hazard maps and other prevention measures are available for public use, revealing that residents are well prepared regarding tsunami evacuation procedures. Nevertheless, residents and tourists evacuated mostly by car, and because of that, heavy traffic was reported, showing that it was a non-viable option for evacuation. The tsunami caused minor damages on the coastline, and several car accidents were reported, with one fatality. In recent years, there has been a remarkable interest in tsunami impacts. However, if risk planners seem to be very knowledgeable about how to avoid or mitigate their potential harmful effects, they seem to disregard its integration with other sectors of human activity and other social factors.
1. Introduction
On Sunday, October 28, 2012, at 3:04 (UTC) an earthquake occurred offshore Haida Gwaii (former Queen Charlotte Islands), in the western British Columbia, Canada, with a magnitude Mw 7.8 (USGS). This earthquake generated a tsunami that propagated through the Pacific Ocean, being recorded, among other instruments, on the tide gauge stations in real time (NOAA). About two hours after the earthquake the Pacific Tsunami Warning Centre (PTWC) issued a tsunami warning to the state of Hawaii. In the meantime, the tsunami continued to propagate through the Pacific Ocean, reaching Hawaii about 5 hours and 30 minutes after the earthquake occurred, with reduced inundation areas and less impacts than expected.
Since the nineteenth century Hawaii has been hit by at least 25 tsunamis that caused damage and 8 of those tsunamis caused deaths: 1837, 1868, 1877, 1923, 1946, 1957, 1960 and 1975, either by local or trans-oceanic tsunamis (Lander & Lockridge Citation1989). The past events led to the creation of the warning system and more recent events indicate the need to find tools for improving it. Spatial planning authorities and emergency agents have been in urgent need of operational tools that would provide accurate tsunami forecast as guidance for rapid, critical decisions in which lives and property are at stake. In addition, significant efforts have been carried out in order to reduce tsunami hazards along the US coastline (Titov et al. Citation2005). These efforts include the installation of a variety of real-time instruments (Bernard Citation2005; Gonzalez et al. Citation2005; Titov et al. Citation2005). One of the main concerns was to quickly confirm potentially destructive tsunamis and reduce false alarms (Bernard Citation2005), since false evacuations are costly both in terms of monetary expenses and in terms of authority's credibility.
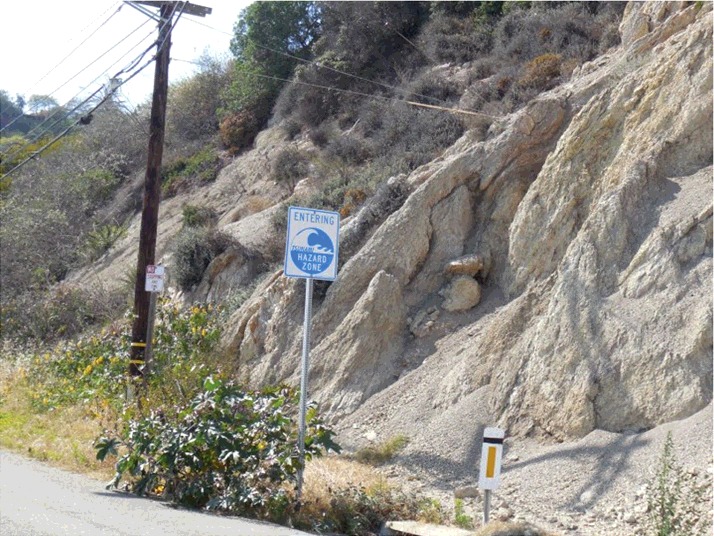
The combination of the tsunami numerical model simulation with real-time tsunami data is a useful tool for the tsunami warning system, especially for far-field tsunamis (Titov et al. Citation2005). Still, redundant methods should be used for a safe and organized evacuation. The PTWC, originally known as the Honolulu Magnetic Observatory, was established in Hawaii in 1948 as a tsunami warning system for the United States and later renamed to the PTWC in 1968 after its responsibility was expanded to include the nations throughout the Pacific (Igarashi et al. Citation2011). Since the creation of the warning system, the state of Hawaii has been improving the tsunami preparedness by creating tsunami hazard maps for public use and scheduling regular siren exercises, which also involves the participation of local communities. Although there remains some uncertainty about the level of public understanding of the sirens and their implications for behavioural response (Gregg et al. Citation2007), Hawaiian residents are well prepared regarding the tsunami preparedness. Furthermore, stakeholders have contingency plans in order to safely evacuate the coastal populations. The plans involve, among other tools, vertical evacuation signs ().
Figure 1. Tsunami vertical sign that indicates entering a hazard zone. (Photo taken by the third author at the California coast on 2013 May 13).
Knowledge about past events is relevant because previous involvement in hazard incidents is important in the risk perception (Queirós et al. Citation2007; Momani & Salmi Citation2012). In fact, as mentioned by Tavares et al. (Citation2010) risk perception levels depend more on general knowledge and the ability to have access to sources of information. For example, during the 2004 Indian Ocean Tsunami, residents in Simeulue Island, Indonesia and the nomadic Moken in Myanmar and Thailand evacuated safely to higher ground because they remembered past hazard incidents (Santos et al. Citation2007). Although at that time the tsunami warning system was not implemented, these accounts showed that knowledge about past events is indeed important for the risk perception, even without any warning system. In addition, the analysis of the survivors' accounts of the 2011 Tohoku Tsunami (Santos & Queirós Citation2013) showed that several people evacuated to higher ground because they remembered past tsunami events, even without any further warning system information (Santos et al. Citation2011; Santos & Fonseca Citation2013).
Although several studies have been focusing on evacuation planning based on simulation and models (Xudong et al. Citation2009), the only way to test such models is to conduct drills and evacuation exercises (Kobes et al. Citation2010; Queirós & Santos Citation2013). In addition, evacuation drills help to develop “muscle memory” (Dengler et al. Citation2011) to prepare and to respond appropriately to the natural warning signals of local tsunamis. Moreover, the analysis of the survivors' accounts of the 2011 Tohoku Tsunami (Santos & Queirós Citation2013) showed that knowledge about emergency plans, combined with regular drills and evacuation exercises, allowed efficient tsunami preparedness. Nevertheless, for each disaster that occurs there are important lessons, either by a large event (Santos et al. Citation2007) or a small disaster (Voss & Wagner Citation2010).
Currently the PTWC has four types of messages: warning, advisory, watch and information statement. The meaning of these messages is widely spread for public use. The October 28, 2012, tsunami triggered a tsunami warning that was issued for the state of Hawaii by the PTWC, meaning that it is necessary to evacuate low-lying coastal areas.
Thus, the objectives of this study are to compile real-time tsunami data, calculate the tsunami propagation, by carrying out the tsunami numerical model, and to analyze the evacuation process in Hawaii through the eyewitnesses' accounts. The lessons from this event would be useful for improving the risk management and spatial planning policies, as well as in the dissemination of strategic implementations that include the combination of the tsunami numerical model simulation with real-time tsunami data, and tsunami evacuation processes, because local communities should know what to do in an emergency situation. These strategies would be important not only to Hawaii, but also to other coastal regions that are vulnerable to tsunamis in order to create tsunami-resilient communities.
2. Tide gauge data
The real-time tsunami data were compiled from messages that were received in real time, by an email notification service provided by the PTWC. The stations are distributed along the coastlines of Alaska, Washington, Oregon, California, Hawaii and British Colombia, as presented on . Later, the PTWC and the National Tsunami Warning Center have reviewed the tsunami arrival times on these stations. Furthermore, seven DART stations, which are located on deep waters (approximate water depths between 2800 m and 4480m), also recorded the tsunami. The data are summarized in , which includes the name and location of 36 stations, arrival time (UTC), and arrival time of the maximum water level height and its value.
Figure 2. Location of the tide gauge stations, as presented in , and the epicentre.
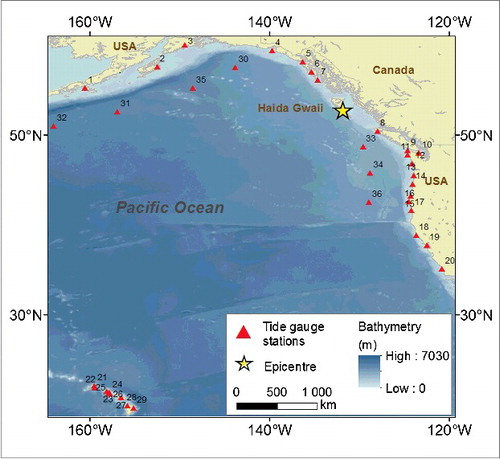
Table 1. Tide gauge stations data considered in this study.
The tsunami reached DART 46419 (#34) and Winter harbour station (#8) in less than one hour after the earthquake. In the meanwhile, the tsunami continued to propagate and was recorded at the tide gauge stations of Port Alexander (#7), DART 46404 (#35), DART 46410 (#30), Sitka (#6), DART 46409 (#31), La Push (#11) and Elfin Cove (#5). In less than four hours after the earthquake, the tsunami reached all the coastlines of Alaska, Washington, Oregon and California. About 5 hours and 30 minutes after the earthquake, at 8:30 (UTC), or 10:30 (HST), the tsunami waves started to arrive at Hawaii. The tsunami had small wave heights in all stations, but there was a significant amplification in Hawaii, especially on Haleiwa (#23), Honolulu (#25), Makapuu (#26), Kahului (#27), Kawaihae (#28) and Hilo (#29).
3. Tsunami numerical model
3.1 The earthquake
The earthquake occurred on Sunday, October 28, 2012, at 3:04 (UTC), with its epicentre offshore Haida Gwaii (former Queen Charlotte Islands), in the western British Columbia, Canada (). The local time in the state of Hawaii (HST) was Saturday, October 27 at 5:04 (pm). The initial earthquake estimated magnitude Mw was 7.1, later corrected to Mw 7.8 (USGS); this was the second largest recorded earthquake in the region. The earthquake generated a tsunami, and post-tsunami field survey results show inundation depths in the near-source area on the coast of Haida Gwaii were up to 2.2 m (Leonard et al. Citation2012).
Figure 3. The seismo-tectonics of the Queen Charlotte fault: (a) Location of the Queen Charlotte Fault and plate boundaries; (b) aftershocks of the October 28 earthquake.
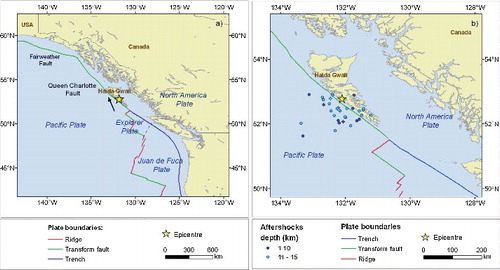
The current seismo-tectonic setting offshore Haida Gwaii is dominated by the Queen Charlotte Fault zone, which is a transpressive boundary between the Pacific and North America Plates along the northwest margin of Canada (Govers & Meijer Citation2001; Bustin et al. Citation2007; Xue & Allen Citation2007; Doser & Rodriguez Citation2011; Duchesne et al. Citation2011 ), as presented in (a).
The main Queen Charlotte Fault is located immediately offshore the Haida Gwaii and extends north-westward at an azimuth of 319° (Bustin et al. Citation2007), from the triple junction (where the three plates converge) to the Fairweather Fault off the west coast of Alaska, USA.
The October 28 earthquake had a strike of 319° (USGS), which is in agreement with the plate boundaries. In addition, the relative Pacific/North America motion along the fault zone is primarily right-lateral transform (strike-slip) at a rate of about 50 mm yr−1 (Bustin et al. Citation2007; Doser & Rodriguez Citation2011); however, there is also a significant component, about 15 mm yr−1, of convergence across the margin (Bustin et al. Citation2007; Doser & Rodriguez Citation2011). These components make the direction of motion of the Pacific plate relative to North America (at the latitude of the epicentre of the October 28 earthquake), as represented by the arrow in (a) (Bustin et al. Citation2007; Doser & Rodriguez Citation2011). The October 28 earthquake occurred at a depth of 14 km, and had a dip angle of 17° (USGS), which are in agreement with the aftershocks' depths ((b)) and local convergence.
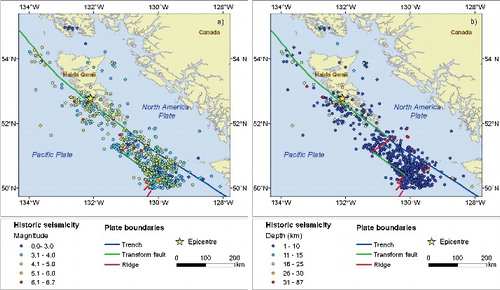
In addition, the historic seismicity was compiled from the USGS website from March 1, 1973, to October 30, 2012. The magnitudes vary between 2.5 and 6.7, as shown in . There are two main earthquake clusters in the area: above 52ºN, the earthquakes occur on the Queen Charlotte Fault, while below 52°N the earthquakes are associated with the Explorer and Juan de Fuca plates ((a)). There were five earthquakes of magnitude higher than 6.0 on the Queen Charlotte Fault: two events in 2001, one event in 2009 and two in 2012, which are considered aftershocks of the October 28 earthquake. The historic seismicity shows the earthquakes generated in the area are shallow (mostly less than 10 km). Thus, the depth and dip angle of the October 28 earthquake are in agreement with historic data. The additional source parameters (USGS) are: slip = 110°, fault length = 150 km, fault width = 60 km, dislocation = 3 m.
Figure 4. Historic seismicity off-shore Canada and the epicentre of the October 28 earthquake: (a) magnitude; (b) focal depth.
3.2 Numerical model results
The Okada (Citation1985) formulas were used to calculate the initial sea surface displacement, with the source parameters presented above. Then, the tsunami numerical modelling was carried out by using the linear shallow water theory in a spherical coordinate system, with a staggered leap-frog scheme (Imamura Citation1995). Furthermore, one-minute cell size bathymetry data are used (GEBCO Citation2003), with a time step of 3 s for the numerical model. The calculations were conducted for 12 h of computation time.
The plot of the sea surface displacement is shown in (a). The maximum uplift is 1.2 m, while the subsidence is 0.4 m. The tsunami travel times through the Pacific Ocean are presented in (b), showing that at about 5 hours and 30 minutes after the earthquake, the tsunami reaches Hawaii, which are in agreement with tide gauge data ().
Figure 5. Tsunami numerical model results: (a) sea surface displacement, in metres; (b) tsunami travel times; (c) maximum water level.
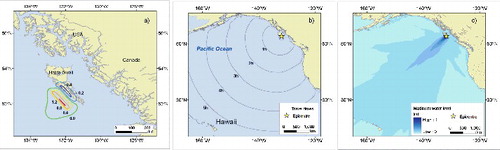
Table 2. Comparison between observed and modelled travel times.
The maximum water level is shown in (c), where it is clear that the energy is mainly focused slightly northward of Hawaii, and not towards the Islands. In addition, the maximum water level decreases with distance from the tsunami source area.
The tsunami water level waveforms are presented in . The model results show amplitudes below 0.5 m, except in Hawaii, where there were local amplifications at Haleiwa (#23), Mokuloe (#24), Kahului (#27) and Kawaihae (#28). The wave period on Hawaii stations is about 10 min.
Figure 6. Tsunami numerical model results: tsunami water level waveforms.
The summary of the observed and modelled travel times at the tide gauge stations is presented in . The time difference is also presented, showing that the model arrives 1.7 min earlier than the observed stations, with a standard deviation of 9.0 min. The bathymetry data used in the tsunami numerical model have one-minute cell size, which is not accurate enough inside bays and harbours (e.g., Santos et al. Citation2009). Therefore, excluding the tide gauge stations located on these areas (Kodiak (#2), Seaward (#3), Yakutat (#4), Elfin Cove (#5), Sitka (#6), Neah bay (#9) and Port Angels (#10)), the model arrives 2.6 min earlier than the observed stations, with a standard deviation of 7.2 min. On the seven DART stations, the model arrives 1.6 min earlier than the observed stations, with a standard deviation of 3.0 min. These results show the observed travel times validate the source model proposed in this study.
4. Tsunami evacuation information
The authors have compiled information related to the tsunami evacuation process in Hawaii on live broadcasting for about nine hours, on CNN TV Channel, Hawaii Now Online and the Tsunami Information Website to Hawaii (http://hitsunami.info/), which included live broadcasting of the roads at the tsunami inundation zones. In addition, other evacuation information, including timeline, was compiled from six online archives that contain the eyewitnesses' accounts (Barut & Roig Citation2012; Corrigan Citation2012; Osher Citation2012; SAAP Citation2012; Scheuring & Meiers Citation2012; Zimmerman Citation2012). The analysis and discussion of the evacuation process in Hawaii are based on the facts reported by the witnesses.
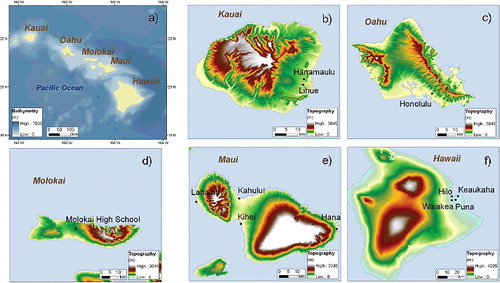
On Saturday evening (October 27, 2012) people across the state of Hawaii were enjoying early Halloween events and street festivals, dinner parties with friends and family, movies and even a wedding (Zimmerman Citation2012). The weather conditions were as expected for that time of year (NOAA Citation2012), with temperatures ranging between 22.2 and 28.9 °C in Lihue, Kauai Island (), 23.3 and 30.0 °C in Honolulu (Oahu Island), 21.7 and 28.9 °C in Kahului (Maui Island), 18.3 and 28.3 °C in Hilo, Hawaii Island (Big Island), with an average relative humidity ranging between 62 and 76% for the four islands mentioned. Heavy rain was observed in Hilo (2.79 mm), light rain in Lihue (1.02 mm) and trace precipitation in Kahului.
Figure 7. Hawaii Islands and the places described by the witnesses during the evacuation: (a) main islands; (b) Kauai; (c) Oahu; (d) Molokai; (e) Maui; (f) Hawaii (Big Island).
When the earthquake occurred (3:04 UTC on October 28, or 17:00 Hawaii Standard Time (HST) on October 27) the PTWC announced that no action was needed (). At 3:45 (UTC) an Information Only statement was issued to the state of Hawaii, informing the tsunami waves would arrive from 8:28 (UTC), or 10:28 HST. Then, two hours after the earthquake, 5:09 (UTC) or about 7 pm HST, a tsunami warning was issued for the state of Hawaii by the PTWC, meaning that it is necessary to evacuate low-lying coastal areas.
Table 3. Timeline of the evacuation process at Hawaii.
However, only about one hour after the tsunami warning was issued to Hawaii the tsunami sirens began blaring, and about 100,000 people evacuated mostly by car, causing traffic congestion. In Oahu, the sirens prompted an immediate crush of traffic in Honolulu, with many motorists stopping at service stations to fill gasoline (Barut & Roig Citation2012). During the evacuation, at least four major car accidents were reported by the State Emergency Medical Services at Oahu (Osher Citation2012). Although there were no immediate reports of damage in the state, one person died in a fatal crash near a road that was closed near the Oahu's north shore (Hainsworth Citation2012).
Then, at 6:36 (UTC), or 8:36 pm (HST), Maui Civil Defence Agency also issued a tsunami warning and an immediate evacuation advisory for all persons in low-lying coastal areas, ordering to evacuate immediately to higher ground. This happened about 1 hour and 30 minutes after the initial tsunami warning was issued. Water and sewer services were closed in preparation for the tsunami. However, heavy traffic was reported in South Maui ((e)) at the Ohukai/South Kihei Road intersection ((a)), through Lahaina Town in both Front Street and Honoapiilani Highway in town ((b)). All these roads are located in the tsunami inundation zones (), which are available for public at the Pacific Disaster Centre website.
Figure 8. Evacuation details at Maui Island ((e)), showing the streets where heavy traffic was reported, the tsunami inundation areas, and the location of the evacuation areas. (a) South Kihei; (b) Lahaina; (c) Kahului.
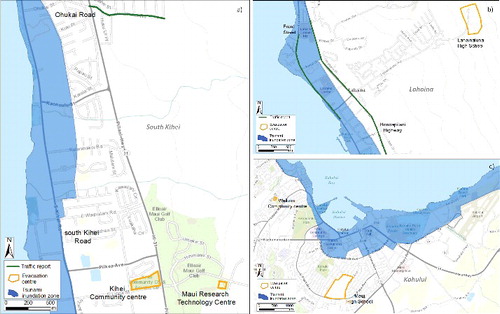
At 7:00 (UTC) or 9:00 pm (HST), at the Kahului airport, Maui Island ((e) and (c)) still had three incoming flights planned. Other flights were standing for clearance. The concern about the Kahului airport was related to the fact that some parts of the airport are inside the tsunami inundation zones.
From 7:09 (UTC) or 9:09 pm (HST) the evacuation centres started to open for public use (). And only two hours after the initial tsunami warning was issued the Maui Police Department sent units to evacuate beaches and other low-lying areas. About 5 hours and 30 minutes after the earthquake, at 8:28 (UTC), or 10:28 (HST), the tsunami waves started to arrive at Hawaii, giving a travel time of 324 min. This is in agreement with the tsunami only statement issued by the PTWC at 3:45 (UTC). The tsunami was recorded on the tide gauge stations of Nawiliwili (#22), with 0.03 m, at Kahului (#27) with 0.76 m, at Hilo (#29) with 0.091 m and at Kawaiha (#28) with 0.56 m.
The counties of Maui, Hawaii Island, Kauai and Oahu reported either little or no damage from the tsunami waves, and in Molokai, there was some damage to property near the ocean. The maximum water level height in Hawaii was 1.35 m at Kahului. While the tsunami waves were reported in the East Maui area of Hana ((e)), a smooth evacuation was still in place on Front Street in the West Maui ((a)). But only between 9:02 and 9:16 (UTC) the first tsunami waves were reported by the PTWC.
At 10:22 (UTC), or 0:22 am (HST), all water and wastewater services were restored to all areas though the tsunami warning was still in effect. One hour later, at 11:22 (UTC), or 1:02am (HST), the warning was downgraded to a tsunami advisory, allowing people to return to their homes in low-lying areas 30 min later, and at 13:58 (UTC), or 3:58 am (HST), the tsunami advisory was cancelled. This happened almost nine hours after the tsunami warning was issued to the state of Hawaii.
5. Discussion and conclusions
The 2012 Haida Gwaii Tsunami was triggered by a magnitude Mw 7.8 earthquake, which was the largest event recorded on the Queen Charlotte Fault. The initial sea surface displacement had a maximum uplift of 1.2 m, while the subsidence was 0.4 m. The tsunami numerical model results show the proposed source model arrives on average 1.7 min earlier than the 36 observed stations, with a standard deviation of 9.0 min. However, excluding the tide gauge stations located on the bays (Kodiak (#2), Seaward (#3), Yakutat (#4), Elfin Cove (#5), Sitka (#6), Neach bay (#9) and Port Angels (#10)), the model arrives 2.6 min earlier than the observed stations, with a standard deviation of 7.2 min. On the seven DART stations, the model arrives 1.6 min later than the observed stations, with a standard deviation of 3.0 min. These results show the observed travel times validate, in general, the source model proposed in this study. The modelled water level waveforms show the tsunami amplitude was less than 0.5 m in height. Although local amplifications were obtained in Hawaii (Haleiwa (#23), Mokuloe (#24), Kahului (#27) and Kawaihae (#28)), the tsunami numerical results show the 2012 Haida Gwaii Tsunami would not generate widespread inundation. This was confirmed by the counties of Kauai, Oahu, Maui and Hawaii Island, which reported either little or no damage from the tsunami waves. On Molokai Island there was some damage to property near the ocean. Therefore, the tsunami warning issued to Hawaii would not be necessary. In fact, a PTWC spokesperson admitted that the warning “probably was not necessary” (Zimmerman Citation2012) because they made some errors. If they had not made the errors, smaller waves would have been predicted and there would have been a tsunami advisory issued for Hawaii.
On the other hand, the modelled water level waveforms also show the period at Hawaii stations is about 10 min. Eyewitnesses also reported that tsunami waves did begin to hit Hawaii from 8:28 (UTC) at every 10–12 minutes, but they were just about 0.45 m in height. In Maui, waves reached as high as 1.35 m in Kahului. The arrival time reported by the witnesses is in agreement with the tsunami only statement issued by the PTWC at 3:45 (UTC), which correctly forecast the arrival time of the tsunami. In addition, the tsunami numerical model results fit the results obtained by the eyewitnesses' accounts () and tide gauge data at Hawaii (), except in Nawiliwili (#22). The good performance of the tsunami numerical model shows the proposed source model is correct and therefore it is a good tool for the tsunami warning system.
The eyewitnesses' accounts also show that only about one hour after the tsunami warning was issued to Hawaii the tsunami sirens began blaring, initiating the evacuation of about 100,000 residents and tourists. Hawaiians were in a good mood and were partying; they responded well to the evacuation, they knew the location of the evacuation centres and some witnesses even continued to party on higher ground. However, because most people evacuated by car, heavy traffic was observed and four car accidents were reported in Oahu, causing one fatality. It is believed that mishaps and human errors can be prevented if adequate consideration is given to human factors during the design of emergency planning operations (Woodcok & Au Citation2013). Therefore, evacuating by car is a kind of human behaviour that has been raising some concern because similar situations have been reported. For example, during the May 9, 2010, earthquake, at Banda Aceh, Indonesia, which although did not cause a tsunami, there was massive disorder and traffic congestion during the evacuation (Affan et al. Citation2012). Likewise, the eyewitnesses' accounts of the 2011 Tohoku tsunami also reported traffic congestion at five coastal cities and towns (NHK Morioka Citation2011a, Citation2011b, Citation2011c, Citation2011d, Citation2011e) because many people evacuated by car; those who remained in their cars were caught by the tsunami and died. These facts show that even when a coastal community has been experiencing tsunamis, and with regular practice of evacuation exercises, the evacuation procedures need to be constantly improved and re-evaluated.
Moreover, the weather conditions at Hawaii were comfortable. The situation might be different, however, if the evacuation would happen during day time, with the maximum temperature being 30 ºC, because weather conditions influence human behaviour during an evacuation (Greenough et al. Citation2001). Some witnesses questioned if the evacuation was really necessary, since small waves were observed at the coast; others were complaining that they could not return home. It is important to point out that although the tsunami arrived to Hawaii on Saturday evening, only at 11:02 (UTC) or 1:02 am (HST), the tsunami warning was downgraded to an advisory. Some evacuation centres were reported full and people had to be diverted to other areas. Another eyewitness said the state did not overreacted at all. The same witness said “I was blown away at the coordinated effort on all the islands. I felt secure with all the precautions” (Barut & Roig Citation2012). Therefore, the “always evacuate” idea is not straightforward, and for this reason, it is important to avoid false alarms. Also, risk communication strategies should emphasize preparedness and offer information about preventive measures or filling the gap between the institutional levels and community by interactions with actors (Tavares & Mendes Citation2010), which can stimulate better public recognition of the information (Tavares & Santos Citation2014).
Nevertheless, this event provided useful lessons for future tsunami mitigation, not only to Hawaii, but also to other coastal communities that might be vulnerable to tsunamis: the warning system does not serve the need in an emergency situation, if it is not consistent with an effective risk communication, where the information dissemination and monitoring of public response is crucial. Therefore, parallel to a warning system, tsunami education programmes should be articulated with traffic congestion simulations, studies of road traffic (Affan et al. Citation2012), as well as dissemination of informative pamphlets (Santos et al. Citation2013), regular siren exercises, dissemination of tsunami hazard maps for public use, and the implementation of emergency plans, which should be tested and updated by conducting evacuation exercises (Queirós & Santos Citation2013). Although the frequency of earthquakes and tsunamis has remained stable (Dunbar et al. Citation2010), the increasing density of populations at the coastal areas raises the need of tsunami awareness.
Disclosure statement
No potential conflict of interest was reported by the authors.
Additional information
Funding
References
- Affan M, Goto Y, Agussabti. 2012. Tsunami evacuation simulation for disaster awareness education and mitigation planning of Banda Aceh. Paper presented at: 15WCEE; September 24–28; Lisbon. 10 pp.
- Barut J, Roig S. 2012. Hawaii tsunami warning cancelled after lower than expected waves [Internet]. [cited 2013 Feb 25]. Available from: http://www.reuters.com/article/2012/10/28/us-hawaii-tsunami-idUSBRE89R02M20121028
- Bernard E. 2005. The U.S. National Tsunami Hazard Mitigation Program: a successful state–federal partnership. Nat Hazards. 35:5–24.
- Bustin A, Hyndman R, Kao H, Cassidy JF. 2007. Evidence for underthrusting beneath the Queen Charlotte Margin, British Columbia, from teleseismic receiver function analysis. Geophys J Int. 171:1198–1211.
- Corrigan D. 2012. Hawaii tsunami – Hilo evacuates, mayor speaks [Internet]. [cited 2013 Feb 25]. Available from: http://www.bigislandvideonews.com/2012/10/27/video-hawaii-tsunami-hilo-evacuates-mayor-speaks/
- Dengler L, Goltz J, Fenton J, Miller K, Wilson R. 2011. Building tsunami-resilient communities in the United States: an example from California. TsuInfo Alert. 13(2):1–14.
- Doser D, Rodriguez H. 2011. A seismotectonic study of the Southeastern Alaska Region. Tectonophysics. 497:105–113.
- Duchesne M, Halliday E, Vaughn Barrie J. 2011. Analyzing seismic imagery in the time–amplitude and time–frequency domains to determine fluid nature and migration pathways: a case study from the Queen Charlotte Basin, offshore British Columbia. J Appl Geophys. 73:111–120.
- Dunbar P, Stroker K, McCullough H. 2010. Do the 2010 Haiti and Chile earthquakes and tsunamis indicate increasing trends? Geomatics, Nat Hazards Risk. 1(2):95–114.
- GEBCO Digital Atlas. 2003. General bathymetric chart of the oceans, BODC [Internet]. Available from: http://www.gebco.net
- Gonzalez F, Bernard E, Meinig C, Eble M, Mofjeld H, Stalin S. 2005. The NTHMP tsunameter network. Nat Hazards. 35:25–39.
- Govers R, Meijer P. 2001. On the dynamics of the Juan de Fuca plate. Earth Plan Sci Lett. 189:115–131.
- Greenough G, McGeehin M, Bernard SM, Trtanj J, Riad J, Engelberg D. 2001. The potential impacts of climate variability and change on health impacts of extreme weather events in the United States. Environ Health Perspect. 109(2):191–198.
- Gregg CE, Houghton BF, Paton D, Johnston DM, Swanson DA, Yanagi BS. 2007. Tsunami warnings: understanding in Hawaii. Nat Hazards. 40:71–87
- Hainsworth J. 2012. Canada earthquake: British Columbia Hit, Tsunami warning for Alaska, Hawaii [Internet]. [2013 Feb 25]. Available from: http://www.huffingtonpost.com/2012/10/28/canada-earthquake-tsunami-alaska_n_2032416.html
- Igarashi Y, Kong L, Yamamoto M, McCreery CS. 2011. Anatomy of historical tsunamis: lessons learned for tsunami warning. Pure Appl Geophys. 168:2043–2063.
- Imamura F. 1995. Review of tsunami simulation with a finite difference method. In: Yeah H, Liu P, Synolakis C, editors. Long-wave run-up models. London: World Scientific; p. 25–42.
- Kobes M, Helsloot I, de Vries B, Post JG, Oberijé N, Groenewegen K. 2010. Way finding during fire evacuation: an analysis of unannounced fire drills in a hotel at night. Building Environ. 45:537–548.
- Lander JF, Lockridge PA. 1989. United States tsunamis (including United States possessions) 1690–1988. Boulder (CO): National Oceanic and Atmospheric Administration, National Geophysical Data Center.
- Leonard L, Bednarski J, Fine I, Cherniawsky J, Wright C. 2012. The Haida Gwaii Tsunami of October 27, 2012. Risky Ground. Simon Fraser Univ Dec. 21:10–11.
- Momani N, Salmi A. 2012. Preparedness of schools in the Province of Jeddah to deal with earthquakes risks. Disaster Prev Manage. 21(4):463–473.
- NHK Morioka. 2011a. On that day, on that time – an account from Tarou Kunimitsu san, age 52, at Yamada [ NHK Morioka online]. [ broadcasted on 2011 Jul 6]. Japanese.
- NHK Morioka. 2011b. On that day, on that time – an account from Komukai Aso san, age 60, at Tarou [ NHK Morioka online]. [ broadcasted on 2011 Jul 28]. Japanese.
- NHK Morioka. 2011c. On that day, on that time – an account from Koishi Koetsu san, age 64, at Otsuchi [ NHK Morioka online]. [ broadcasted on 2011 Jun 29]. Japanese.
- NHK Morioka. 2011d. On that day, on that time – an account from Oikawa Masami san, age 70, at Ofunato [ NHK Morioka online]. [ broadcasted on 2011 Aug 8]. Japanese.
- NHK Morioka. 2011e. On that day, on that time – an account from Tashiro Saiko san, Age 71, at Kamaishi [ NHK Morioka online]. [ broadcasted on 2011 Sep 5]. Japanese.
- NOAA. 2012. National climatic data center. [2013 Feb 25]. Available from: http://www.ncdc.noaa.gov
- Okada Y. 1985. Surface deformation due to shear and tensile faults in a half space. Bull Seismol Soc Am. 75(4):1135–1154.
- Osher W. 2012. UPDATE: Hawaii tsunami advisory cancelled. Maui Now [Internet]. [cited 2013 Feb 25]. Available from: http://mauinow.com/2012/10/27/breaking-tsunami-warning-issued-for-hawaii/
- Queirós M, Santos A. 2013. Fire safety in public buildings university: a reflection from a pilot exercise evacuation at the University of Lisbon. Livro de Homenagem ao Prof. Fernando Rebelo, Universidade de Coimbra. 3:543–553. Available from: riskam.ul.pt/images/pdf/ queiros_santos_2013.pdf
- Queirós M, Vaz T, Palma P. 2007. A reflection on the subject of risk. Paper presented at: Actas do VI Congresso da Geografia Portuguesa, Lisboa. Available from: http://riskam.ul.pt/images/pdf/comlivactnac_2007_reflexao_risco.pdf (in Portuguese)
- [SAAP] Star Advisor staff and The Associated Press. 2012. Advisory lifted, officials ‘grateful’ tsunami wasn't worse [Internet]. [cited 2013 Feb 25]. Available from: http://www.staradvertiser.com/news/breaking/176136301.html?id=176136301
- Santos A, Fonseca N. 2013. Tsunami numerical simulation at Fukushima Daiichi and Daini nuclear power plants due to the 2011 Tohoku Tsunami. Paper presented at: IGU Regional conference. Kyoto. Available from: http://riskam.ul.pt/images/pdf/igu_abstracts_fukushima.pdf
- Santos A, Koshimura S, Imamura F. 2007. Lessons from the 2004 Indian Ocean tsunami. Proceedings of the Tohoku Branch of the Japan Society of Civil Engineering. Japan.
- Santos A, Koshimura S, Imamura F. 2009. The 1755 Lisbon Tsunami: tsunami source determination and its validation. J Dis Res. 4(1):41–52.
- Santos A, Machado A, Fernandes P. 2013. Tsunami pamphlet for high school students (in Portuguese). Available from: https://sites.google.com/a/campus.ul.pt/tsurima/education
- Santos A, Queirós M. 2013. The 2011 Tohoku Tsunami: analyzing the evacuation of the survivors. Paper presented at: IGU Regional Conference. Kyoto. Available from: http://riskam.ul.pt/images/pdf/igu_abstracts_survivors.pdf
- Santos A, Zêzere JL, Agostinho R. 2011. The 1755 Tsunami and the tsunami hazard assessment in Portugal. Paper presented at: VIII Congresso da Geografia Portuguesa. Lisboa, 6 p. Available from: http://riskam.ul.pt/images/pdf/Risco_68-375-1.pdf
- Scheuring I, Meiers R. 2012. Tsunami blog: earthquake triggers tsunami warning in Hawaii [Internet]. [cited 2013 Feb 25]. Available from: http://www.hawaiinewsnow.com/story/19934505/breaking-state-civil-defense-issues-tsunami-warning-after-77-quake-off-british-columbia
- Tavares AO, Mendes JM. 2010. Risk prevention, risk reduction and planning policies: misunderstandings and gaps in a local context. Risk, models and applications – selected papers. Berlin: CODATA-Germany.
- Tavares AO, Mendes JM, Basto E, Cunha L. 2010. Risk perception, extreme events and institutional trust: a local survey in Portugal. In: Bris S, Guedes M, editors. Reliability, risk and safety: theory and applications, London: Taylor & Francis Group, pp. 1245–1252.
- Tavares AO, Santos P. 2014. Re-scaling risk governance using local appraisal and community involvement. J Risk Res. 17(7):923–949.
- Titov V, Gonzalez F, Bernard E, Eble M, Mofjeld H, Newman J, Venturato A. 2005. Real-time tsunami forecasting: challenges and solutions. Nat Hazards. 35:41–58.
- Woodcok B, Au Z. 2013. Human factors issues in the management of emergency response at high hazard installations. J Loss Prev Proc Indust. 26:547–557.
- Voss M, Wagner K. 2010. Learning from (small) disasters. Nat Hazards. 55:657–669.
- Xudong C, Heping Z, Qiyuan X, Yong Z, Hongjiang Z, Chenjie Z. 2009. Study of announced evacuation drill from a retail store. Building Environ. 44:864–870.
- Xue M, Allen R. 2007. The fate of the Juan de Fuca plate: implications for a yellowstone plume head. Earth Plan Sci Lett. 264:266–276.
- Zimmerman M. 2012. Pacific tsunami warning center miscalculated wave impact on Hawaii shores [ Hawaii air report online, 2012 Oct 30]. [cited 2013 Feb 25]. Available from: http://www.hawaiireporter.com/pacific-tsunami-warning-center-miscalculated-wave-impact-on-hawaii-shores/123