
ABSTRACT
The main advantage of using the Unmanned Aerial Vehicle (UAV) photogrammetry in a post-earthquake scenario is the ability to completely document the state of the structures and infrastructures, damaged by the earthquake, ensuring the safety of all operators during the data acquisition activities. The safety and accessibility aspect in the area is of crucial concern after an earthquake and sometimes many areas may be inaccessible, but, at the same time, it is necessary to collect data in order to monitor and evaluate the damage. The development of new algorithms in the field of Computer Vision drastically improved the degree of automation of the 3D point clouds generation using the photogrammetry techniques. In addition, data acquisition techniques using the UAV allow a complete 3D model with the highest possible resolution especially with respect to the conventional satellite or aerial photogrammetry to be produced. These advantages make the UAV photogrammetry highly suitable for surveys in a geo-hazard context as in a post-earthquake scenario. Some results from surveys carried out with the UAV photogrammetry after L'Aquila Earthquake occurred in 2009 will be presented and discussed.
1. Introduction
The 6.3 moment magnitude earthquake occurred on 6 April 2009, in L'Aquila (Central Italy), causing 309 deaths and more than 1600 injuries. In addition, many private and public buildings and cultural heritage were damaged with more than 50% of the buildings declared totally unsafe or partially unsafe (Civil Protection Citation2010).
Once the first phase of the relief operation was complete, it was necessary to perform a dedicated and extensive survey of the structures and infrastructures to properly evaluate the level of damage caused by the earthquake. This phase is extremely complex, especially in an historical city where the buildings are generally highly vulnerable and access is often neglected by narrow and potentially very dangerous streets.
The use of remote sensing in emergency situations offers several advantages, the first and foremost is the investigation and information acquisition in extremely dangerous zones. At first, for an ‘early damage assessment’, the high-resolution images are very useful to detect quickly the areas and structures that suffered the worst damages (Baiocchi et al. Citation2012; Tong et al. Citation2012), but for a complete and detailed survey of structures and infrastructures, useful for the following reconstruction phase, the Unmanned Aerial Vehicle (UAV) photogrammetry technique is more suitable (Xu et al. Citation2014).
The UAV photogrammetry provides very high-resolution data and the possibility to select different heights and view-points during the survey of buildings and surrounding areas. The processed data can provide orthophotos, 3D models or DTM, which offer the necessary metric base for correct damage assessment and the starting point for a suitable reconstruction plan. In the ‘L'Aquila post-earthquake’ phase, the UAV photogrammetry (Eisenbeiss Citation2009) was tested by using radio-controlled minicopters or microcopters.
Several case studies are presented in this paper, such as a square in the L'Aquila's historic town centre, the Collemaggio Basilica, which is a Unesco heritage and Fontecchio historical town centre, which belongs to the area affected by L'Aquila earthquake. The study and evaluation of the results allow guidelines to be established for the correct use of the UAV photogrammetry in such scenarios. In the first part of this work, the impact of Computer Vision on the photogrammetry is discussed, together with the evaluation and comparison of certain operation phases. In the second part, the results of direct field experiences are presented and discussed.
2. UAV photogrammetry: modern elaboration techniques
In this section, the theoretical aspects of the 3D modelling performed by the UAV photogrammetry is explained, taking into consideration flight planning and data analysis procedures required to obtain suitable metric precision.
After the mid-90s, Computer Vision introduced a high level of automation modifying the photogrammetry approach with respect to the past (Barazzetti et al. Citation2011; Westoby et al. Citation2012).
In fact, in order to solve the collinearity equations (Equationequation (1(1) )) (), that relate ‘image space’ with the ‘object space’ (Kraus Citation2000), the Computer Vision introduced several methods of automation (i.e. Structure from Motion ‘SfM’) that allow us to obtain the interior orientation parameters (c, η0, ξ0) and the camera position in a relative image-space coordinate system automatically. Classical photogrammetry needs the interior orientation parameters of the camera, the coordinates in the ‘object space’ of the sensor's position and/or the ground control points (GCPs) for the resolution of the equations system shown below (Equationequation (1
(1) )) (Westoby et al. Citation2012).
Figure 1. Image space and object space relationship.
With SfM instead, scene geometry, camera position, interior and exterior orientation are all extracted automatically, with high redundancy, using an iterative bundle adjustment (Triggs et al. Citation2000) on a sequence of images (multi-image approach).
The new algorithms are proposed in several software packages developed in recent years for the 3D reconstruction, combining SfM and bundle adjustment, like Pix4D (Pix4D Citation2013), Agisoft (Agisoft Photoscan Citation2011), Bundler (Snavely et al. Citation2007), APERO (Pierrot Deseilligny & Clery Citation2011), and VisualSFM (VIsualSFM Citation2011).
However, georeferencing and scaling of the models still remain a manual task.
This high degree of automation introduced by the Computer Vision is a clear advantage with respect to the classical photogrammetry approach (Westoby et al. Citation2012), enabling the photogrammetry as most accessible and suitable for many surveying applications like the three-dimensional modelling of the territory (DSM) and the documentation of structures and infrastructures (3D models).
Below, a brief workflow for a geometrically correct 3D model by UAV photogrammetry, from the image acquisition phase to data analysis, is summarized.
Initially, an adequate flight planning, useful to guarantee the proper overlap between the photograms and the ground sample distance (GSD) suitable for the purpose of the survey, is necessary.
Starting from the knowledge of the camera parameters (focal length and sensor size), and once established the GSD, it is possible to create a flight planning according to the classical photogrammetry relationships () (Kraus Citation2000) and ensure an adequate overlap between photograms that guarantee the stereoscopic vision. In the classical photogrammetric approach, in order to obtain a 3D model, two photograms were enough, with a minimum of 60% overlap; this is a typical approach of classical software suites like PCI Geomatics. Multi-image matching, instead, needs at least three photograms with 80% overlap. This multi-image matching is implemented in classical photogrammetric suites (ERDAS Imagine Hexagon Geospatial Citation2013) with a semi-automatic approach.
Flight planning allows the flight altitude to be defined () to guarantee the required GSD (Equationequation (2(2) )) (Leachtenauer & Driggers Citation2001); this represents the scale of the image and that is related to an initial estimate of the final model's precision. The detector pitch, p, is the distance between detector centres. The pixel pitch divided by the sensor focal length gives the angular distance between sensor samples. If this angular distance is projected to the ground, it defines the GSD ():
(2) where p is the detector pitch, f is the focal length and R is the range. EquationEquation (2)
(2) assumes that the field of view (FOV) is directed normally to the observed surface; where this is not the case, the GSD must be corrected for the look angle (the angle between the perpendicular to the object and the sensor line-of-sight):
(3) where θ is the look angle.
Figure 2. Ground sample distance.
Analyzing Equationequation (3)(3) , it is evident as the acquisitions are performed with the camera at an oblique angle and that the resolution will be lower with respect to the camera pointed perpendicularly to the object.
In addition, consideration has to be given to the image scale, which is not constant throughout the image; in fact, the GSD is smaller in the foreground than in the background (Grenzdörffer et al. Citation2008) ().
Figure 3. Geometry of oblique images.
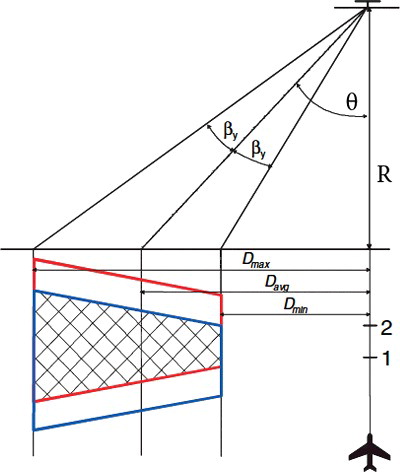
In flight planning, the altitude/range above the object and the viewing angle with respect to the perpendicular direction of acquisition have to be defined. The viewing angle of the lens βy defines the minimum Dmin and the maximum Dmax distances between the photograms and the perpendicular to the aircraft, as well as the photogram scale, m. The minimum mmin, average mavg, and maximum mmax image scale are calculated by the following equations:
(4)
The distance of the image foreground and background from the perpendicular line of acquisition, important for the computation of the waypoint position, is based on the following equations:(5)
To understand how the GSD affects the precision of the final model, the theoretical planimetrical (Equationequation (6(6) )) and vertical (Equationequation (7
(7) )) precisions (
,
of the coordinate obtainable by the final model are considered.
(6)
(7) with
that represents the measurement precision of the image,
the scale of the image and
the ratio focal length/base, where the base is the distance between two photograms (Arias-Pérez et al. Citation2012) and the GSD (Equationequation (8
(8) )) is a function of the image scale and the pixel.
(8)
Then, it is possible to relate and
to GSD (Equationequations (9
(9) ) and (Equation10
(10) )):
(9)
(10)
Once the acquisition phase is complete, the images can be processed. Here the principal steps that combine the SfM and the bundle adjustment are analyzed. For more details, please refer to Snavely et al. (Citation2007).
The first step regards the identification of feature points, or keypoints, in each image (Snavely et al. Citation2007) using the so-called detectors, namely operators that search the 2D locations in the images which are geometrically stable under different transformations and contain high information content (Remondino Citation2006). Each detector is associated with a descriptor that analyzes the image providing a 2D vector of pixel information for the keypoints (Remondino Citation2006). Several detectors and descriptors, like Sift (Lowe Citation2004) and Surf (Bay et al. Citation2008), are described and compared in Mikolajczyk and Schmid (Citation2005), Remondino (Citation2006) and Apollonio et al. (Citation2014).
According to the keypoints detected in each image, multi-image matching is performed in order to obtain the correlation between two images. An analysis of outliers, accomplished by robust estimators, is important to remove the mismatches (Barazzetti et al. Citation2011). The keypoints are used for image matching in order to identify the tie-points between images.
Bundle adjustment retrieves the camera position for all images and the interior orientation (calibration parameters) of the camera, allowing the generation of sparse 3D point clouds. Thanks to high number of tie-points on which the statistical adjustment is implemented, the values of camera calibration can be achieved in an automatic way (Fraser Citation1997) adjusting them as unknowns, during the resolution of the collinearity equations (Equationequation (1(1) )). The GCPs allow georeferencing and scaling of the 3D models obtained through the bundle adjustment.
The dense matching algorithm can finally improve the generated sparse point clouds obtaining dense point clouds from which the 3D models are derived. In general, it is possible to subdivide the matching algorithm in stereomatching (Hirschmüller Citation2008) used in stereo pairs and multi-stereo matching approach (Pierrot-Deseilligny & Paparoditis Citation2006; Furukawa & Ponce Citation2010). More details and comparison between algorithms are available in Seitz et al. (Citation2006) and Ahmadabadian et al. (Citation2013). The achievable accuracy of the final models depends from numerous variables involved in the workflow and several analysis are shown in the literature (Küng et al. Citation2011; Remondino et al. Citation2012; Kersten & Lindstaedt Citation2012; Ahmadabadian et al. Citation2013; Apollonio et al. Citation2014).
In this framework, it seems possible to conclude that, if the Computer Vision increases the level of automation of the photogrammetric process, at the same time, the results in terms of accuracy are generally not automatically certified and, consequently, when the results are used for metric purpose, as in case of the post-earthquake scenario, the comparison with ‘ground truth’ data is necessary.
3. Case studies in L'Aquila
The L'Aquila earthquake, as discussed in Section 1, caused death, injury and several damages to the historical centre's buildings and cultural heritage. contains the detailed data concerning the damage to private and public buildings and cultural heritage (Civil Protection Citation2010).
Table 1. L'Aquila earthquake damages.
Considering the typical scenario of a historical town affected by a strong earthquake, the authors would like to emphasize that several needs and problems generally arise:
A detailed documentation of the damage is necessary.
The operators engaged in the survey activities are exposed to risk.
The damaged area can be unreachable because of the precarious state of the buildings.
Considering these problems and needs, the advantages of UAV photogrammetry may be summarized as follows:
Safety: no risk for operators
Possible to survey inaccessible zones
High-resolution photograms
Speed of survey and elaboration
Repeatability and economical convenience.
The UAV photogrammetry is, therefore, expected to satisfy the needs and overcome the problems.
In order to verify and confirm this expectation, three different case studies were investigated, in different periods and different contexts ():
Palazzo Square (2012)
Collemaggio Basilica (2014)
Fontecchio built-up area (2015)
Figure 4. Case studies: (a) Palazzo Square, (b) Collemaggio Basilica, (c) Fontecchio.
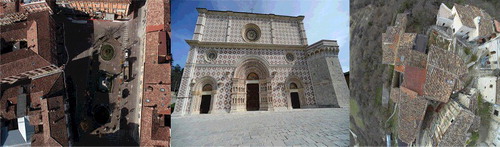
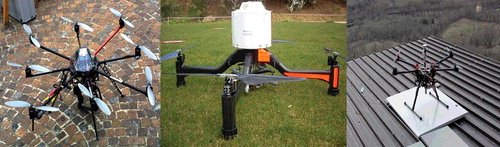
These case studies were selected in order to test the UAV photogrammetry for the survey of different elements like squares ((a)), buildings ((b)) and urban built-up area ((c)), which require different elaboration strategies both in terms of flight planning and GCP acquisition. For this research, different UAVs, such as the Octo, Quad, and Hexa copters () and sensors were used to gather a wide range of data to satisfy the different cases, and to make the research independent and useful to scrutiny of its advantages and limitations.
Figure 5. (a) Micro-octocopter, (b) Mini-quadcopter, (c) Mini-hexacopter.
2.1. Survey characteristics, instrumentations and data acquisition
As mentioned in the previous section, three main case studies were investigated and contains the main features of the survey in terms of measured object characteristics, UAV employed, type of sensors, flight planning activities, number of photograms to elaborate and number of GCPs.
Table 2. Case studies: survey characteristics.
Concerning the data analysis, the photograms were elaborated using software like PCI and ERDAS, which are based on a classical photogrammetric approach, and applying other software like Agisoft Photoscan and Apero-MicMac, based on the combination between the Computer Vision and the classical photogrammetric approach.
The attention was not mainly focused on the difference between the various software, as Dominici et al. (Citation2012) had already analyzed the entire photogrammetric process of data elaboration using the PCI software and, therefore, the authors refer the reader to a dedicated bibliography.
This study is instead focused on the data elaboration strategies pertaining to the photogrammetric algorithms that combine the Computer Vision and the classical approach that introduced a high level of automation and, in particular, the various steps of elaborations and the factors that affect the quality of the result, such as the distribution of GCPs and check points (CPs).
The following subsections cover the detailed information about the survey characteristics, instrumentation and data analysis.
3.1.1. Palazzo square
The first case study consisted of survey of the historical square ‘Piazza Palazzo’ approximately 60 metres long and 40 metres wide and enclosed by surrounding buildings. In this study, the micro UAV octocopter was used and the payload consisted of a reflex camera canon-EOS 550D with good resolution, focal length of 18 mm and sensor dimensions of 22.3 (mm) x 14.9 (mm). This camera provides a GSD equal to 2 cm with a flight altitude of about 80 m. These factors allow a flight to be performed safely because of the lack of obstacles along the flight trajectories and to obtain a ground extension of each photograms of about 100 m, which easily covers the area of interest with an average scale equal to 1:4444. In order to determine the number and position of the waypoints from which the photograms should be acquired, flight planning was generated using MK tool software. The geometric characteristics of the camera (sensor dimension, pixel dimension, focal length) and the overlap value between the various photograms were imposed and the position of 15 waypoints was obtained as output with a flight altitude of 80 m as shown in (a).
Figure 6. (a) Flight planning, (b) GCP network.
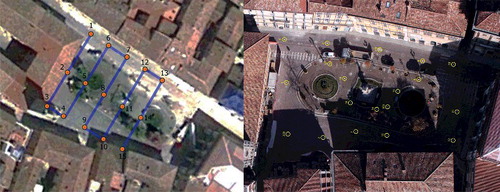
Furthermore, a network of 19 GCPs was materialized with the square target of 30 cm x 30 cm, in order to be visible in the photograms for the data elaboration step, and with the aim to gather an adequate number of geodetic coordinates of the object points and transform the relative orientation obtainable with the SFM and bundle adjustment.
The number of GCP, with their maximum relative distances of 15 m, guaranteed a homogeneous distribution on the entire area as shown in (b).
Once materialized, the GCPs network was measured using the GNSS receiver in NRTK and the coordinates were obtained with about a centimetre precision. The obtainable precision of the point cloud is generally greater than the GSD value; therefore, this level of precision may be considered adequate for this case study.
Once the photograms are acquired, the first data analysis step consists of image matching. Considering the characteristics of the available photograms with 18 MP of resolution, once resampled, the number of keypoints in each photogram was very high, typically close to 40,000 points. As a result of the image matching, performed with the algorithms previously described, the number of tie-points between one photogram and the adjacent ones was typically of the order of 10,000 units. This means that the redundancy to solve the bundle block adjustment was very high. Hence, in order to give the absolute orientation and to assign the proper scale to the photograms and to the sparse point cloud, it is necessary to add an adequate number of GCPs measured in a well-known reference system like the WGS84, in case of measurements performed using the GNSS technique. Then, the GCPs together with the tie-points, allow, through the bundle adjustment, the internal and external orientation to be refined, directly obtaining the georeferenced model.
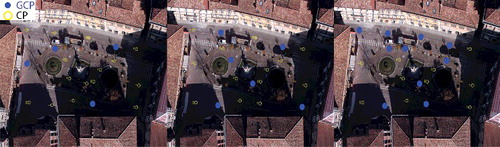
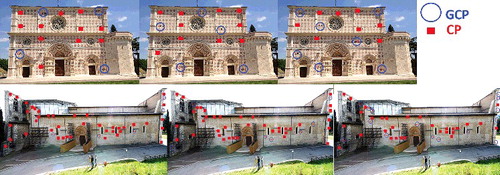
An important factor in the evaluation of the bundle adjustment result consists of the global residual value that represents the square root of the average weighted value of the residual's squares, which are commonly called the reprojection errors. However, the analysis of the bundle adjustment result, considering only the reprojection error value, is generally not exhaustive enough for the definition of the model's quality; in fact, it is possible to obtain a very good residual value, when the model is inaccurate. Thus, it is important to compare the bundle adjustment results with the ‘ground truth’ that may be performed excluding some GCPs as independent CPs from the bundle adjustment. The GCPs are affected by the adjustment that optimizes the photogrammetric model to those points, while the CPs are needed to compare the result with the ‘ground truth’. In order to evaluate how the distribution of the GCPs and CPs affect the adjustment solution, different distribution and number of GCPs and CPs were tested as shown in
Figure 7. Palazzo square: GCPs and CPs combinations.
Once the internal and external orientation phases are complete, the photogrammetric process can be completed, yielding the final model. These models can be created both as dense point cloud (Dense Matching) and as solid models, which may be analyzed and post-processed to extrapolate the required information like orthophotos, digital surface models, plants, and sections. These data represent important information in the post-earthquake scenario.
3.1.2. Collemaggio Basilica
In order to investigate the use of the UAV photogrammetry in a complete different scenario with respect to the historical square, the ‘Collemaggio Basilica’ was selected as a case study and the survey was performed using a quadcopter Anteos A2-Mini/B, equipped with a Canon S100. The site is characterized by a wide space in front of the main facade while the side, where the ‘Holy Door’ is located, is flanked by a road and the distance between the escarpment and the Collemaggio Basilica is of about 10 m. In this case, due to the different condition in terms of flight safety because of the narrow space on the side of the Basilica with respect to the facade, the flight activities and planning were separated in two different parts. For the first flight on the facade, the camera parameters were characterized by the sensor dimension of 7.6 mm x 5.7 mm and the focal length equal to 5.2 mm; the main parameters for the tie-point computation consisted in the GSD imposed to 1 cm and the overlapping between the adjacent photograms and strips equal to 90%. Considering these data, the positions of about 14 waypoints were obtained with the relative distance with respect to the facade equal to 30 m. For the second flight that involved the ‘Holy Door’ side of the Basilica, the main parameter imposed for flight planning was the distance from the Basilica, because a safety flight must maintain the same overlapping rate of the previous flight. As a consequence, noticing that the distance from the facade was less than 10 m, more waypoints with respect to the previous case were obtained. It is important to mention that, due to the particular structure of the Anteos A2-Mini/B, in case of horizontal acquisition like in this structural context, in order to exclude any part of the UAV from the acquired photograms, it was necessary to apply a FOV direction of 16.5° of inclination with respect to the horizontal direction. As mentioned in the theory, this means that different scales characterize the images and in this case, the difference between the minimum and maximum GSD due to the oblique acquisition for the side of the Basilica was about a millimetre, while in the facade, because of the larger distance, it was equal to 0.5 cm. Several other effects are described in Rupnik et al. (Citation2014) and in order to limit their influence on the dense point clouds, it is generally necessary to use a higher overlap between the photograms and to improve their redundancy. Consequently, overlapping was imposed equal to 90% and the UAV acquisitions were integrated with the ground once. The total number of images that were acquired and elaborated was equal to 291 and shows the position in planimetry of the various waypoints.
Figure 8. Collemaggio Basilica: waypoints distribution.
As in the previous case study, 60 natural GCPs easily identifiable and distributed on the entire structure () were measured in a local reference system using a Total Station TS30 obtaining the precision in the value of the coordinates equal to a few millimetres. In order to obtain the absolute georeference of the final model with respect to the WGS84 reference system, the local reference system was measured with the GNSS technique in static mode guaranteeing the highest possible value of precision with respect to the GNSS measurements.
Figure 9. Collemaggio Basilica: GCPs and CPs combination.
Concerning the elaboration step and considering the high number of photograms, it took about 24 hours to complete the whole elaboration steps with a pc station characterized by 3.4 Ghz Octa core processor with 16 GB of ram.
In order to evaluate the bundle adjustment results, three different combinations among GCPs and CPs were also considered, in order to analyze the residuals of GCPs with respect to the ‘ground truth’ CPs values.
3.1.3. Fontecchio built-up area
The last case study involved a built-up area in Fontecchio (AQ), a small village close to L'Aquila, also damaged by the earthquake in 2009. Fontecchio is a typical Italian historical urban centre, characterized by narrow streets and tall adjacent buildings, which make survey activities difficult, especially after an earthquake () because of the closed access due to the risk of building collapses.
Figure 10. Fontecchio built-up area overview.

The UAV photogrammetry, as described above, allows the access problem to be overcome and to perform the survey in safety, but even in this circumnstance, some problems still exist. For example, the lack of an adequate open space for the take-off and landing activities sets constraints about the dimensions and weight of the UAV. In addition, the narrow space surrounded by buildings causes the low/absence of GNSS signal that limits the execution of the automatic flight and makes it difficult to follow the waypoints computed with the flight planning activities. Moreover, the take-off and landing phases depend on the ability of the pilot. Concerning the UAV, for the survey of the built-up area (), a mini hexacopter ((c)) was tested and in terms of its dimension (900 mm), weight (3.3 kg) and the maximum hover time equal to 18 minutes, it was deemed suitable.
With respect to the previous case studies, in which the flight planning was performed using the classic automatic approach, in this case, due to the particular characteristics of the area in terms of alternation between areas with high slope, flat areas and area with different elevations, an alternative approach was followed. In fact, due to the lack of GNSS signal, it was necessary to verify the feasibility and safety of the flight; to accomplish this task, an approximate volume of the built-up area was calculated using the Total Station measurements and georeferencing the approximate model as shown in (a).
Figure 11. (a) Approximate volume of built-up area. (b) Waypoints distribution.
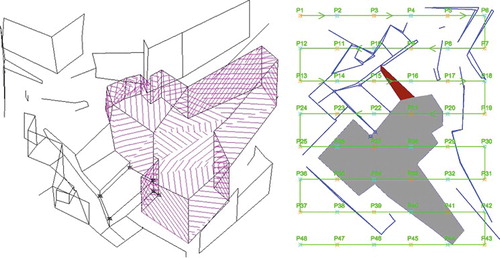
Using the approximated 3D model, it was possible to verify the difference in altitude in the area of interest and to compute the average slope in a way that the flight strips can follow it, guaranteeing a constant value of the GSD. Another important aspect concerns the possibility to verify the altitude of the various facades of the built-up area and of the surrounding buildings so that the intervisibility between the UAV and the pilot could be a priori verified and guaranteed. Regarding the waypoints detection, an overlapping value of 80% and 70% longitudinal and lateral, respectively, was imposed; considering the camera characteristics () and imposing a GSD of about 2 cm, the coordinates of 48 waypoints ((b)) and the flight altitude of about 30 m were obtained.
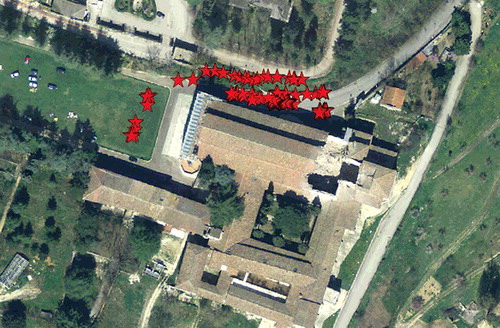
In this case, considering the low GNSS satellite visibility, in order to georeference the 3D model, only 4 GCPs were measured using the NRTK technique obtaining a precision of about 2 cm that may be considered adequate for the obtainable theoretical final precision of the model. In addition, due to the low number of GCPs, only 1 CP was used; as shown in , its position changed three times in the same number of different bundle adjustments in order to have a minimum comparison of the result with the ‘ground truth’.
Figure 12. Fontecchio: GCPs and CP distributions.
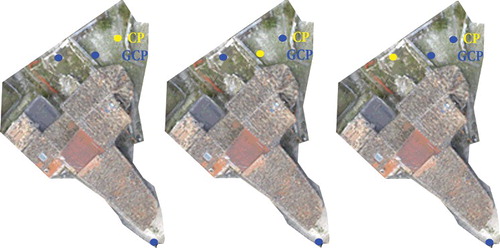
On the bottom of the built-up area, the GCP was used in any different combination, in order to guarantee a minimum of equilibrium in the GCPs distribution with respect to the area of interest.
4. Results and discussion
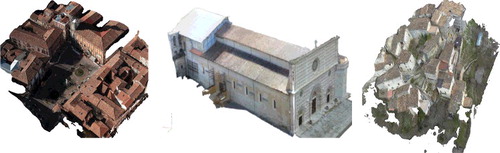
As a result of the field operations, the available data for elaboration consist of the acquired photograms and the measured GCPs/CPs. Following the elaboration strategies and data validation explained in Section 3, the main results are the georeferenced 3D models shown in and that, in order to be fit for the purpose of providing reliable and verified metric quantification, as in case of the post-earthquake damage assessment, these must be verified using ‘ground truth’ measurements.
Figure 13. 3D model: (a) Palazzo square, (b) Collemaggio Basilica, (c) Fontecchio.
Concerning the precision, contains the residual values of bundle adjustments considering both GCPs and CPs, subdivided by case study, and the different distribution combinations as described in the previous section. It is possible to see that the GCPs residuals are generally smaller with respect to the CPs ones. This is due to the high redundant adjustment's influence on GCPs coordinate values, which may induce an overestimation of the precision, but analyzing the values of the CPs residuals with respect to the various distributions, it seems possible to conclude that the values are quite stable and the precisions of the model have good values.
Table 3. Results of bundle adjustment.
Once obtained the metrically correct 3D models, several products as orthophoto, DSM, plans and sections, useful for the metrical analysis of the objects and required in a post-earthquake scenario for the damages assessment, can be gained. Some examples of orthophotos and DSM are shown in and
Figure 14. Orthophotos: (a) Palazzo square, (b) Collemaggio Basilica, (c) Fontecchio.
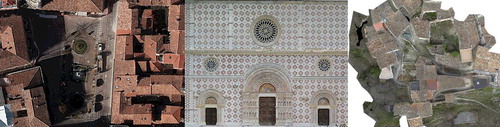
Figure 15. (a) DSM Palazzo square, (b) Depth scalar field Collemaggio Basilica, (c) DSM Fontecchio.
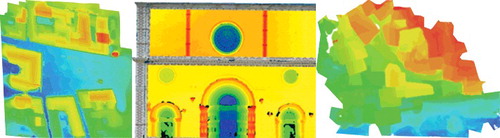
These models may be used to analyze the geometric anomalies of the structures and infrastructures caused by the earthquake as out of plumb walls, small deformations, collapses, etc. It is important to highlight that if the same models were available before the earthquake, the application of change detection techniques could have automatically allowed the scale of the effects due to the calamitous events.
5. Conclusions
In this work, the use of UAV photogrammetry in a post-earthquake scenario was presented. Through selected case studies, the technique's potential for critical area was analyzed.
The survey activities were intentionally organized by the authors in a way that different UAVs both in terms of structure (quad–hexa–octo copter) and camera were used. Different case studies that represent different scenarios with an increasing level of criticality were analyzed passing from a typical historical square ‘Piazza Palazzo’ to a structural heritage like the ‘Collemaggio Basilica’ or a small built-up area as Fontecchio. In the last case study, that represents a typical Italian historical centre, several problems concerning the flight planning and the autonomous flight management were encountered due to the lack of the GNSS signal. In order to succeed with the survey activities and validation of the results, a homogeneous network of GCPs/CPs was measured and the models were georeferenced using the GCPs and validated with respect to the ‘ground truth’ using the CPs.
The UAV photogrammetry certainly matches the expectation. The market is working on the sensor and vehicles improvement, both in terms of positioning and stability and image quality. With respect to the classical photogrammetric software, in order take into account new ways of acquisition born out of the introduction of UAVs as an instrument of survey, the algorithms and software are constantly evolving.
In addition, the legislation, which in Italy is imposed by the ENAC organization, is refining over time and currently two different scenarios, critical and non-critical, have been defined.
As future developments take place, the research will focus on the integration of the optical data and the data acquired with different sensors such as the multispectral and thermal camera. This integration could enable the extraction of useful data for the analysis of building and cultural heritage, structures and infrastructures and to provide verified data in order to update a georeferenced database useful for a smart management of the territory.
Acknowledgments
The authors would like to thank all the companies Iiptsat s.r.l., Aermatica and Superelctric who have realized the flights in the different critical scenarios.
Disclosure statement
No potential conflict of interest was reported by the authors.
References
- Agisoft Photoscan [ Internet]. 2011. [cited 2014 May 20]. Available from: http://www.agisoft.com/.
- Ahmadabadian AH, Robson S, Boehm J, Shortis M, Wenzel K, Fritsch D. 2013. A comparison of dense matching algorithms for scaled surface reconstruction using stereo camera rigs. ISPRS J Photogramm Remote Sens. 78:157–167.
- Apollonio FI, Ballabeni A, Gaiani M, Remondino F. 2014. Evaluation of feature-based methods for automated network orientation. Int Arch Photogramm Remote Sens Spatial Inform Sci. 5:47–54.
- Arias-Pérez B, González-Aguilera D, Gómez-Lahoz J, Hernández-López D. 2012. Assessment of stereoscopic precision – film to digital photogrammetric cameras, special applications of photogrammetry. Available from: http://www.intechopen.com/books/special-applications-of-photogrammetry/assessment-of-stereoscopic-precision-film-to-digital-photogrammetric-cameras
- Baiocchi V, Dominici D, Giannone F, Zucconi M. 2012. Rapid building damage assessment using EROS B data: the case study of L'Aquila earthquake. Ital J Remote Sens. 44:153–165.
- Barazzetti L, Forlani G, Remondino F, Roncella R, Scaioni M. 2011. Experiences and achievements in automated image sequence orientation for close-range photogrammetric projects. Proceedings SPIE 8085, Videometrics, Range Imaging, and Applications XI, 80850F; 2011 May 23; Munich.
- Bay H, Ess A, Tuytelaars T, Van Gool L. 2008. Speeded-up robust features (SURF). Comput. Vis Image Understand. 110:346–359.
- Civil Protection [ Internet]. Un anno in dieci punti: 6 aprile 2009–6 aprile 2010 [One year in ten points: 6 April 2009–6 April 2010; [updated 2010 March, cited 2015 Aug 29]. Available from: http://www.protezionecivile.gov.it/jcms/it/emergenza_abruzzo_unanno.wp#sopralluoghi
- Dominici D, Zavino A, Alicandro M, Elaiopoulos M, Baiocchi V. 2012, Micro UAV for post seismic hazards surveying in old city center of L'Aquila. Proceedings of the FIG Working Week; 2012 May; Roma.
- Eisenbeiss H. 2009. UAV photogrammetry. Zurich: ETH.
- Erdas Imagine Hexagon Geospatial [Internet]. 2013. [cited 2015 Jan 10]. Available from: http://www.hexagongeospatial.com/products/producer-suite/erdas-imagine
- Fraser CS. 1997. Digital camera self-calibration. ISPRS J Photogramm. Remote Sens. 52:149–159.
- Furukawa Y, Ponce J. 2010. Accurate, dense, and robust multiview stereopsis. Pattern Anal. Mach Intell. 32:1362–1376.
- Grenzdörffer GJ, Guretzki M, Friedlander I. 2008. Photogrammetric image acquisition and image analysis of oblique imagery. Photogramm Rec. 23:372–386.
- Hirschmüller H. 2008. Stereo processing by semiglobal matching and mutual information. Pattern Anal Mach Intell. 30:328–341.
- Kersten TP, Lindstaedt M. 2012. Image-based low-cost systems for automatic 3D recording and modelling of archaeological finds and objects. Progress in Cultural Heritage Preservation. Proceedings of 4th International Conference EuroMed; 2012 Oct–Nov 29; Lemessos.
- Kraus K. 2000. Photogrammetry, volume 1, Fundamentals and standard processes. Koln: Dummler.
- Küng O, Strecha C, Beyeler A, Zufferey JC, Floreano D, Fua P, Gervaix F. 2011. The accuracy of automatic photogrammetric techniques on ultra-light UAV imagery. In UAV-g 2011-Unmanned Aerial Vehicle in Geomatics. Proceedings of the International Conference on Unmanned Aerial Vehicle in Geomatics (UAV-g); 2011 Sep 14–16; Zurich.
- Leachtenauer JC, Driggers RG. 2001. Surveillance and Reconnaissance Imaging System: modeling and performance prediction. Boston (MA): Artech House
- Lowe DG. 2004. Distinctive image features from scale-invariant keypoints. Int J Comput Vis. 60:91–110.
- Mikolajczyk K, Schmid C. 2005. A performance evaluation of local descriptors. Pattern Anal Mach Intell. 27:1615–1630.
- Pierrot Deseilligny M, Clery I. 2011. Apero, an open source bundle adjustment software for automatic calibration and orientation of set of images. International Archives of the Photogrammetry, Remote Sensing and Spatial Information Sciences, Volume XXXVIII–5/W16. Proceedings of ISPRS Workshop; 2011 March 2–4; Trento.
- Pierrot-Deseilligny M, Paparoditis N. 2006. A multiresolution and optimization-based image matching approach: an application to surface reconstruction from SPOT5-HRS stereo imagery. IAPRS. Proceedings of ISPRS Workshop on Topographic Mapping from Space (With Special Emphasis on Small Satellites); 2006 Feb; Ankara.
- Pix4D [ Internet]. 2013. [cited 2014 Oct 7]. Available from: https://pix4d.com/.
- Remondino, F. 2006. Detectors and descriptors for photogrammetric applications. Int Arch Photogramm Remote Sens Spatial Inform Sci. 3:49–54.
- Remondino F, Del Pizzo S, Kersten TP, Troisi S. 2012. Low-cost and open-source solutions for automated image orientation – a critical overview. Progress in Cultural Heritage Preservation. Proceedings of 4th International Conference EuroMed; 2012 Oct–Nov 29; Lemessos.
- Rupnik E, Nex F, Remondino F. 2014. Oblique multi-camera systems–orientation and dense matching issues. In International Archives of Photogrammetry, Remote Sensing and Spatial Information Sciences, Volume XL-3/W1. Proceedings of European Calibration and Orientation Workshop; 2014 Feb 12–14; Castelldefels.
- Seitz SM, Curless B, Diebel J, Scharstein D, Szeliski R. 2006. A comparison and evaluation of multi-view stereo reconstruction algorithms. Computer vision and pattern recognition. Proceedings of IEEE Computer Society Conference; 2006 Jun 17–22; New York.
- Snavely N, Seitz SM, Szeliski R. 2007. Modeling the World from internet photo collections. Int J Comput Vis. 80:189–210.
- Triggs B, Zisserman A, Szeliski R. 2000. Bundle adjustment. A modern synthesis. Vision Algorithms: Theory and Practice. Proceedings of International Workshop on Vision Algorithms; 1999 Sep 21–22; Corfu. Springer-Verlag.
- Tong X, Hong Z, Liu S, Zhang X, Xie H, Li Z, Yang S, Wang W, Bao F. 2012. Building-damage detection using pre-and post-seismic high-resolution satellite stereo imagery: a case study of the May 2008 Wenchuan earthquake. ISPRS J Photogramm Remote Sens. 68:13–27.
- VisualSFM: A Visual Structure from Motion System [ Internet]. 2011. [cited 2015 Jun 3]. Available from: http://ccwu.me/vsfm/doc.html.
- Westoby MJ, Brasington J, Glasser NF, Hambrey MJ, Reynolds JM. 2012. Structure-from-motion’ photogrammetry: a low-cost, effective tool for geoscience applications. Geomorphology. 179:300–314. Available from: http://www.sciencedirect.com/science/article/pii/S0169555X12004217
- Xu Z, Yang J, Peng C, Wu Y, Jiang X, Li R, Zheng Y, Gao Y, Liu S, Tian B. 2014. Development of an UAS for post-earthquake disaster surveying and its application in Ms7.0 Lushan Earthquake, Sichuan, China. Comput Geosci. 68:22–30.