
 ?Mathematical formulae have been encoded as MathML and are displayed in this HTML version using MathJax in order to improve their display. Uncheck the box to turn MathJax off. This feature requires Javascript. Click on a formula to zoom.
ABSTRACT
Intermittent fires in Northeast Iran in the autumn of 2010 resulted in the burning of some valuable forest habitats. The objective of this study was to apply geographic information systems (GIS) to determine to what degree three key factors (environmental, climatic, and anthropogenic) influence the severity rating of fires in these forests. The forest fire sites were surveyed and imported into GIS. The severity of burnt areas was considered in relation to the three factors. Statistical functions were used to calculate the effect of the factors at each fire site. Logistic and stepwise regressions were used to determine the fire severity rating related to each factor. The results indicate that as the number of cumulative days after the onset of fire increased, the burnt areas also increased at a rate of 303.5 ha/day (R2 = 0.95). Consequently, forest density, daily mean wind speed, daily mean temperature and distance to roads were highly correlated with the daily severity rating of forest fires, and only daily temperature and forest density affected the size of the burnt areas. Prediction maps show that about 24% of the forests have high fire durability, amounting to 7% of the fire-sensitive area. The findings from this case indicate that GIS can be effectively employed in fire management to assess damage, and possibly to prevent future fires, thus assisting in the preservation of valuable forest resources.
1. Introduction
The prediction of forest fires constitutes a significant component of forest fire management. It plays a major role in resource allocation, mitigation and recovery efforts. Forest and grassland fires cause air pollution, extinction of rare floral and faunal species, devastating loss and irreparable damage to the environment and atmosphere, global warming, and threaten the lives of people who live near forests (Alkhatib Citation2014). Forest fires in Northeast Iran have become more common in recent years (). This phenomenon is of concern, since the likelihood of similar fires in the future is high. For example, in 2010, intermittent forest fires burnt more than 16,000 ha in these areas in just less than one month (Abdi et al. Citation2012). In the majority of forest fire reports, the causes of these fires are ‘unknown’, so there is a need for basic studies that assess the probability of forest fires and examine the main factors that affect its durability and severity.
Table 1. Statistics of forest fires occurring in Northeast Iran from 2001 to 2010.
Forest fires, based on their origin, can be divided into natural fires, or fires induced by humans. Finding the relationship between fire and weather factors, vegetation and human criteria is necessary, and different aspects can be probed (Pew & Larsen Citation2001). Substantial attempts have been performed for characterizing, anticipating, modelling, planning, and managing wildfires in various Mediterranean countries (Bonazountas et al. Citation2007; Duane et al. Citation2015). To determine the effects of anthropogenic, climate and environmental factors separately, different statistical methods, models and algorithms have been tested. Statistical methods have also been applied to visualize spatial and temporal variations in fire susceptibility as a function of predictors like vegetation, climate, relief, and anthropogenic activity by historical fire data (Cardille et al. Citation2001; Dickson et al. Citation2006; Syphard et al. Citation2008; Alvarez et al. Citation2013; Jung et al. Citation2013; Zarekar et al. Citation2013). Beverly et al. (Citation2009) developed a model for fire susceptibility in west central Alberta, Canada, in which multivariate statistical analysis was used to identify the key factors, and their results were carried out to establish a fire susceptibility index (FSI) that was significantly influenced by fuel composition, fuel organization and topographic of the earth's surface. Moreover, Beverly et al. (Citation2009) and Oliveira et al. (Citation2012) compared the application of multiple linear regression and random forest methods to identify the main structural factors that could describe the probability of occurrence of a fire at a European scale: the random forest model had a higher predictive capability than multiple linear regression. Furthermore, Oliveira et al. (Citation2012) applied some variables which were common to both models, and rainfall and soil wetness appeared to affect the occurrence of fire to a vast range, although unemployment rate, overgrazing and local road density were also constituted to be significantly affected by the multiple linear regression and random forest methods. For instance, a logistic model was used by Chou et al. (Citation1993) to identify areas with a high likelihood of fire occurrence based on environmental, anthropogenic and spatial variables in the San Bernardino National Forest, California, and also by Vega et al. (Citation1995) to forecast the sum of fire-days in the White Court Forest of Alberta, USA. In the region of Golestan forests of Northeast Iran, Abdi et al. (Citation2012) used a multiple regression model to identify the correlations between forest management factors and the frequency of forest fire occurrence, with a strong positive correlation (up to 70%) between fire duration and the low density of forest roads, fencing and channel excavation in forest management plans. In addition, the majority of burnt areas were affected by three factors: lack of skilled personnel, reduced forest management practices and fencing or channel excavation operations (about 90%). Furthermore, Mohammadi et al. (Citation2013) integrated logistic regression and geographic information systems (GIS) to study the risk of forest fires and to identify the factors that most influenced the occurrence of forest fires in the forests of western Iran. In this study, the correlation between forest fires and climatic variables, human factors and physiography were analyzed. Results indicated that the likelihood of fire occurrence was negatively correlated to slope percentage, altitude and distance from croplands, but was positively correlated to the amount of annual rainfall.
In order to rate the occurrence of wildfires, most industrialized countries use prediction systems that involve a large number of monitoring tools, including weather forecast algorithms. However, most of the developing countries cannot afford the use of these technologies because of weakness of their technical resources. New approaches are, thus, needed to predict the occurrence of forest fires while considering a reduced number of monitoring features. These can be classified into wildfire occurrence prediction systems and indices, and artificial intelligence (Sakr et al. Citation2011). Therefore, in countries such as Iran, identification of effective factors to control forest fires and the use of prediction probability maps can serve as a preventive or protective approach to improve fire management.
GIS and remote sensing, as two components of system-approach procedures, have been applied to evaluate fire susceptibility at distinctive spots based on spatial data for biophysical factors, the fire variations, and other attributes, or in composition with fire-behaviour models (Núñez-Regueira et al. Citation2000; Pew & Larsen Citation2001; de la Riva et al. Citation2004; Haight et al. Citation2004; Arkle et al. Citation2012). These two techniques have also been used to determine risk zones and probability maps of fire occurrence (Pew & Larsen Citation2001; Jaiswal et al. Citation2002; Xu et al. Citation2005; Portillo-Quintero et al. Citation2013). For example, a method based on spatial GIS analysis and logistic regression was used by Zhang et al. (Citation2010) to predict the probabilities of anthropogenically caused grassland fires in Inner Mongolia.
Since there is a lack of novel methods to monitor the early detection of forest fires in Iran, identifying induced factors and mapping fire susceptibility is very important. Therefore, the goal of this study was to use the spatial and statistical capabilities of GIS to determine the effect of environmental, climatic and anthropogenic factors on the temporal extension and area of forest fires. In addition, mapping forest fire susceptibility depended on the significant effect of factors on fire severity in the forests of Northeast Iran.
2. Materials and methods
2.1. Study area
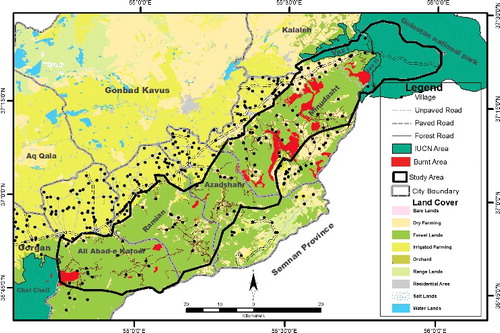
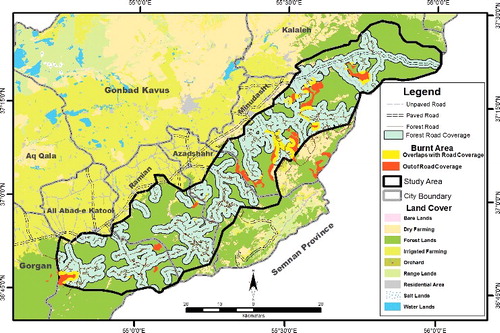
This study was performed in the northeast forests of Iran located in the Southeast of the Caspian Sea. The geographic coordinates of the study area are within 54° 43′ 55″ to 56° 01′ 09″ E and 36° 44′ 02″ to 37° 29′ 14″ N. It is approximately 116 km long, 30 km wide, and an area spanning of 2465 km2. The elevation ranges from 190 to 2500 m above sea level. The relief increases gradually with increasing elevation from South to North. According to reports by the Department of Natural Resources and Watershed Management (DNRWM) of Golestan Province, more than 14550 ha of these areas burnt during less than one month in October and November of 2010. In this period, the mean temperature amounted approximately to 22 °C (6 °C higher than the long-term average), and the average precipitation was 40 mm lower than long-term data. The average lowest relative humidity was 35% (20% less than long-term data). In those two months, there were only three rainy days versus 10 days for long-term data. The vegetation in the Golestan forest region has a diversity of plant communities, including beech (Fagus orientalis Lipsky), alder (Alnus subcordata C.A.Mey.), Caucasian oak (Quercus castaneifolia C.A.Mey.), Eastern hornbeam (Carpinus betulus L.), yew tree (Taxus baccata L.), common juniper (Juniperus communis L.), cypress tree (Cupressus sempervirens L.), and iron wood (Parrotia persica (DC.) C.A.Mey.) (Mozaffarian Citation2007). The study area consists of nine counties, including approximately 356 towns and villages. Paved roads, dirt roads and forest roads are common in this region (). Most forest roads were built to facilitate wood production and forest accessibility, and have a low density (4.53 m/ha), distributed unevenly throughout the area.
Figure 1. The distribution of towns and villages, paved roads, dirt roads and forest roads in the study area.
2.2. Digital fire data
The fire data were provided by the DNRWM of Golestan and established after our own field survey. The fire database is based on a data archive, including all reported forest fires from 16 November 2010 to 13 December 2010 (29 consecutive days), where a total of 135 fires occurred. The size of burned polygons were between 0.1 and 2927 ha. In most cases, the causes of fires were unknown. Each fire report contained different variables, including the fire's location, duration (minutes), day of ignition, final area burnt, weather and estimated cause. The boundaries of the forest fire polygons were surveyed using an Oregon 550 Garmin GPS device.
2.3. Digital map data
All digital data related to the factors affecting the forest study area were obtained from two- and three-dimensional digital topographic maps (scale of 1:25,000) of the National Cartographic Center of Iran (NCC), SPOT5 satellite imagery, and daily meteorological data from available synoptic-climatological stations in Golestan Province. All digital data and spatial analyses were performed using ArcGIS software. Geodatabase data were created for boundary lines, roads, residential areas and forests. All geo-data were available at a 1:25,000 scale, as a Universal Transverse Mercator projection and as WGS84 Datum.
2.4. Methods
2.4.1. Spatial analysis
Environmental factors including slope, aspect and plan curvature layers were derived using surface analysis functions from the Digital Elevation Model (DEM) with a 10-m cell size. Forest density was obtained using the normalized difference vegetation index (NDVI) from SPOT5 images for September and November 2009 with a 10-m spatial resolution, four spectral bands with orthorectification, corrected for terrain displacement, and also for atmospheric effects. The values of this index range from −1 to 1 (Jensen Citation2005). The common range for green vegetation is 0.2–0.8.
Climatic factors were mapped using different GIS functions. The historical meteorological data were obtained from available non-automatic weather stations. These data were extrapolated to calculate meteorological layers with a cell size of 10 m2. For this purpose, a multiple regression method was applied. Each variable, including mean temperature, average relative humidity, wind speed and precipitation, was related to corresponding coordinates and elevation data. In order to obtain the least-squared difference between observed data minus simulated data, different combinations were tested. Then, a 10 m2 DTM array was generated in order to extract X and Y coordinates as well as Z values in the centre of each cell. Finally, all meteorological variables were calculated by an algebraic function and interpolated by functions of the Spatial Analyst of ArcGIS10.1 software program.
Then, different anthropogenic-induced factors were assessed, including the distance from paved, dirt and forest roads; residential area maps were created by connectivity and spread functions, while the population density layer was created by the Kernel density function. From this set of data, different variables were selected as input data for the fire prediction model ().
Table 2. Environmental, climatic, and anthropogenic parameters used as factors affecting the occurrence and durability of forest fires.
The most commonly used metrics to describe the effectiveness of a forest road network included road density (RD), which is simply the length of roads divided by the forest area, and road network coverage (RCVR), which is obtained by dividing the average distance of road spacing by the forest area (Raafatnia Citation1988).
2.4.2. Statistical analysis
Forest fire severity was considered as the period from the start until the end of the fire against the total burnt area. Cumulative burnt areas were plotted against time (days). From this curve, the time to burn 50% of the total area was determined by fitting a logistic model to the cumulative burnt areas (G) versus time (t, hours), as indicated in equation (Equation1(1)
(1) ):
(1)
(1)
where Fx is the maximum burnt area, b is the time to reach 50% of all cumulative burnt areas and a is a value determined by an iterative optimization method to minimize the observed minus the predicted value. The times for 5%, 10%, 90% and 95% were also determined by interpolation and are designated as D5, D10, D90 and D95, respectively.
In order to calculate the mean values of three factors (environmental, climatic and anthropogenic) for each fire region, the zonal statistics function was used. Consequently, the stepwise multiple regression method (Rezai Citation2009) was carried out to find the relationship between dependent and predictors in SPSS software program; the variables of three factors (environmental, climatic and anthropogenic) were entered based on their correlation with the dependent variables (forest fire severity) in the model. Variables with a higher correlation were entered earlier, and variables with a lower correlation were eliminated. Eventually, numerical models of forest fire susceptibility were developed, and the maps of forest fire susceptibility, in a raster format, were generated based on these models and also the significant factors affecting fire severity in the study area. These maps were then classified into five categories with the equal interval method in ArcGIS.
3. Results and discussion
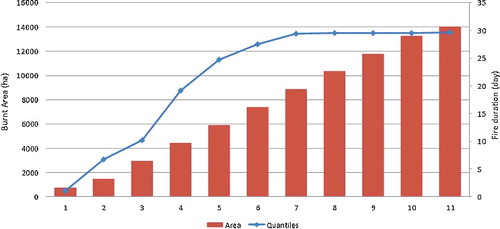
Forest fires present a real threat to precious forest resources in the northeast of Iran, almost 14,550 ha of this area burned during November and December of 2010. The size of fire patches was calculated as being between 1.13 and 2927 ha (). The duration of the fires was variable, from 2 h to 12.7 days with approximately 29 days in total. In other words, about 4% of the forests burned in less than one month. Results of the logistic model indicate that with increasing cumulative days after the onset of fire, the burnt areas also extended at a rate of 303.5 ha/day (; R2 = 0.95). The results also indicate that approximately 50% of the total area burned over 19 days, and that the remaining 50% only within the 10 remaining days (). The rate at which the fire spread increased at the end of this period, revealing that operations to suppress and prevent fire were not successful.
Figure 2. Logistic model between burned area and duration of fire in the study area.
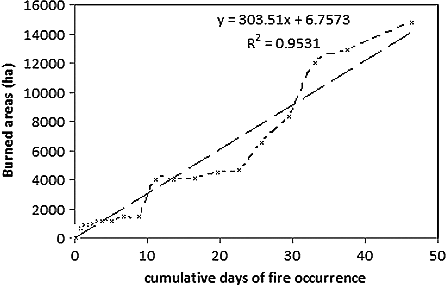
Figure 3. Cumulative days of fire occurrence against burnt area (cumulative days calculated based on cumulative hours of forest fire occurrence in all burnt areas divided by 24 to convert it to day terms).
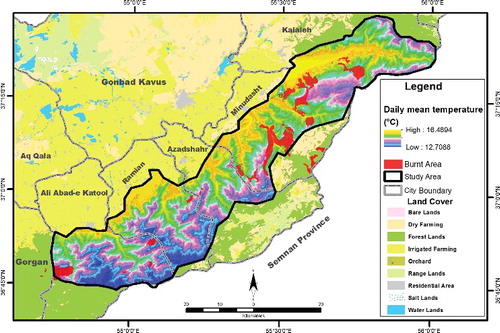
Stepwise regression results of the three key factors (environmental, climatic and anthropogenic) affecting the occurrence of fire are shown in . The start and extend of a fire are mainly affected by the water content of the surface fuels, by the moisture content of the trees, and by wind speed. Various limitations provide the litter moisture content to be evaluated: air temperature, moisture, and precipitation (FAO 2011). Extreme climate parameters were ripe for the occurrence of fire in the northeast of Iran during these forest fires, as the mean temperature was approximately 6 °C higher than the long-term average (1980–2010), average precipitation was 40 mm lower than the long-term mean, and average relative humidity was 20% less than long-term data. The wind speed was between 11.50 and 65.50 km/h with an average of 36.80 km/h in the fire patches (). Statistical analysis of climate factors indicates that daily mean temperature and wind speed significantly affected the duration of forest fires in the study area (R2 = 0.47; F = 10.4; P ≤ 0.05), but there was no significant correlation between the size of fires and these parameters. shows that the largest fire patches occurred in the regions with average wind speed. Furthermore, our analysis indicated that daily mean temperature was affected both by fire duration and fire spread (P ≤ 0.01), more so by fire duration than fire spread in all fire patches (). indicates that fires that occurred at high temperatures displayed more extreme severity than those that occurred at low temperatures. Some previous scholars have indicated that under extreme climate-change pressure, weather applies a significant control on fire severity and fire behaviour (Schoennagel et al. Citation2004; FAO Citation2007; Aldersley et al. Citation2011; Ireland et al. Citation2012; Duane et al. Citation2015). In this study, other climatic parameters (daily relative humidity and precipitation) showed fewer changes during wildfires and no significant effect on fire severity. In contrast, the results of earlier research indicate that the probability of fire occurrence is positively related to the amount of annual precipitation (Oliveira et al. Citation2012; Mohammadi et al. Citation2013).
Table 3. Stepwise regression results based on the factors affecting forest fire occurrence in the study area.
Table 4. Statistics of climatic parameters during times of forest fires compared with long-term data (1980--2010).
Figure 4. Spatial relationship between daily mean wind speed and burnt areas in the study area.
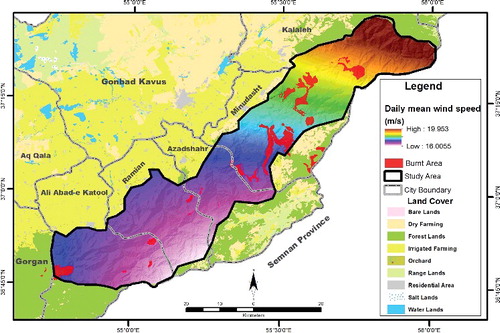
Figure 5. Spatial relationship between daily mean temperature and burnt areas in the study area.
Moreover, among all anthropogenically induced factors, only distance to roads had a high positive correlation with fire durability. When this factor was added to the regression model, the coefficient of determination (R2) for the model increased to 63.06% (F = 10.4; P ≤ 0.01). Furthermore, indicates that the forest road network did not comply with the standards of forest roads in the study area. The road density (RD) was 4.53 m/ha, and road network coverage (RCVR) was observed in 53.97% of the study area. Thus, optimum road density can decrease the occurrence and duration of fire because access to fire-prone zones is easier. This is consistent with other research findings in Iran (Abdi et al. Citation2012). The vicinity to the road is a known key factor in forest fire studies (Oliveira et al. Citation2012). A survey of the burned forests showed that the majority of fire spots were located in regions with low road density. Therefore, it is important to consider optimal road density (around 20 m/ha) and a reasonable road network coverage (as much as 65%) within forest districts (Raafatnia Citation1988). Access roads allow the movement of fire engines and reduce the travel time for fire crews to reach forest fires. In these forests, with low road density, tracks can be supplemented as primary forest roads. Tracks are very important for forest fire protection as they connect to the road network and also serve as a firebreak. They allow for wider and safer movements to fight a fire inside a forest or at its periphery (FAO Citation2001). Other anthropogenically induced factors had no significant effect on the duration of wildfires (P ≥ 0.05). Spatial analysis () shows that most wildfires occurred in areas with low population density and distant from public roads. The average distance of fire patches was 6 km from residential areas and 2.85 km from public roads. Other human activities might spark fires, including recreational activity, forest harvesting, mining and farming activities. This, in turn, suggests the need for carefully focused research into the patterns, seasonality, and locations of different types of anthropogenic activities in fire-sensitive areas, demographics of the populations involved in these activities, and risk perceptions.
Figure 6. Burnt areas that show overlaps with forest road network coverage and outside of it.
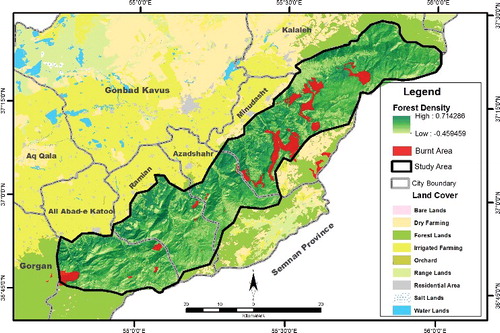
Regarding environmental variables, the regression model shows that forest density significantly affected fire severity (). Forest density not only affected the spread of fires more (R2 = 0.89; F = 130.01; P ≤ 0.01), but also significantly affected the duration of fire patches (P ≤ 0.01). shows that the maximum NDVI value was about 0.71 in the study area. As the value of NDVI increased, forest density increased. Specifically, forest with high density is characterized by a continuous structure of tree crowns, where fire is likely to spread as an active crown fire, thus leading to a greater accumulation of fuels and thus increase the severity of extreme fire (Alvarez et al. Citation2012; Lecina-Diaz et al. Citation2014). This notion is supported by , which shows that the percentage of forest was significantly higher in fire patches than in other areas. Furthermore, in forest structures with high canopy closure, the risk of crown fires is higher because there is an increase in vertical and horizontal continuity (Alvarez et al. Citation2013; Lecina-Diaz et al. Citation2014). Our study showed that there is no significant correlation between topographic parameters (slope, aspect and plan curvature) and fire severity in the study area (P ≥ 0.05). Nevertheless, the majority of fires occurred in southwestern and southeastern aspects. Nearly 52% of areas to which fires spread and 45% of fire duration were in the southwestern part, and these numbers were 33% and 31%, respectively, for the southeastern aspects, which tended to burn with greater intensity and thus with a resulting severity that was higher than in other parts because southern parts received more solar radiation and had less moisture (Alexander et al. Citation2006). Moreover, average slope was about 40% in the fire patches, i.e. not a steep forest slope. Therefore, slope had no significant effect on fire severity. Some research has shown that as slope increases, the distance and angle between flames and fuels decrease and result in more extreme fire severity (Lentile et al. Citation2006; Lee et al. Citation2008; Holden et al. Citation2009; Lecina-Diaz et al. Citation2014).
Figure 7. Burnt areas and fire spreading patterns in the study area. Forest density was based on NDVI.
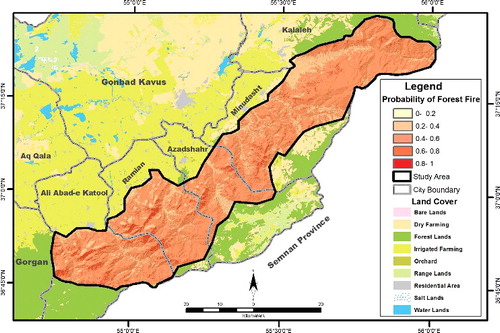
To apply these results to future forest fire management, susceptibility maps of forest fire severity were generated based on the significant factors in the regression results. This model incorporates environmental, climate and human factors, including vegetation, temperature, wind speed, and forest roads. , which describes the likelihood of a forest fire based on the important parameters in fire durability, and classifies the five hazard categories by the equal interval method with intervals of 0.2 increments, shows that 24% of forests are in the hazard class >0.6 (high and very high), 38% in the medium class (0.4–0.6), 31% with low severity (0.2–0.4), and 8% below 0.2 (very low severity). shows that the distance to the forest road was the strongest variable to affect the duration of the forest fire with a determination coefficient of 63.06%. Our findings show that total road density in all the forests was about 4.53 m/ha, while this digit was much lower in the fire patches, 1.03 m/ha (). Road density is far from the required standards (20 m/ha) in the study area. Related to the duration of fires, about two-thirds of the study area are in the hazard class of medium and above, so the development of a forest road network with reasonable density and strong coverage is deniable. Moreover, results of the probability map of fire spread showed that the vast majority (83%) of forests are located in the medium severity (76%), high severity (6%) and very high severity class (∼1%) (). Larger fire patches with longer burn times tended to happen in distant areas with poor road density that were primarily located at higher altitudes, and fewer road lines expands fuel continuity and results in a less fragmented landscape. As a result, there were larger and longer fires, particularly in the areas of lower road density and a weak road network coverage. Furthermore, larger fires tended to be in more distant forests with low accessibility for fire fighter crews in the ground-based operations), less fragmented by roads, and where there is a high continuous fuel connectivity (Price & Bradstock Citation2010; Narayanaraj & Wimberly Citation2012). Higher road densities provide easier access for fire crews, equipment and behave like firebreaks in fire suppression (Hann et al. Citation1997; Narayanaraj & Wimberly Citation2011). In contrast, in some studies, the distance to the forest road was a significant contributing factor in human-induced fires, and higher road densities reflect a higher level of human activity (Syphard et al. Citation2008; Yang et al. Citation2008; Narayanaraj Citation2011; Narayanaraj & Wimberly Citation2012). Our study provides novel information about the correlation between environmental, climatic and anthropogenic variables and fire durability and fire spread in Northeast Iran over a short time frame. Although fire severity is influenced by climate and forest density, forest roads are the single largest influencing parameter for extending the period of a fire, especially in forests with higher elevation, relatively lower road density and a weak road network coverage.
Figure 8. Susceptibility map based on the duration of forest fires in the study area.
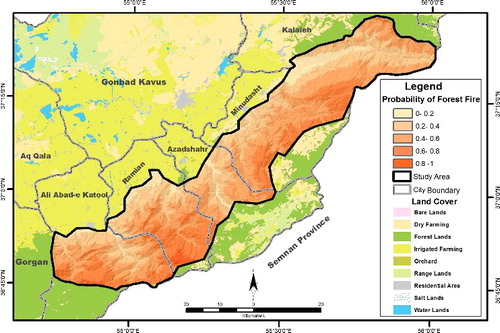
Figure 9. Susceptibility map based on the spread of forest fire in the study area.
4. Conclusion
Forest fires present a real threat to the forest resources of Northeast Iran. Our results indicate that with increasing cumulative days after the onset of fire, the burned areas also extended at a rate of 303.5 ha/day during November and December of 2010, finally burning about 4% of total forested area in less than one month. We compared the factors that influenced the duration and spread of those wildfires. Forest density had a significant influence on the duration and spread of wildfires among the environmental parameters, whereas topographic parameters (slope, aspect and plan curvature) did not. Spatial analysis showed that large fires occurred in those regions with high forest density, such as southwestern and southeastern parts of our study site. We also found an intriguing relationship between fire severity (durability and spread of fire) and daily mean temperature, while wind speed had a significant influence only on the duration of fire. There were no significant correlations between fire severity and other climate factors (daily precipitation and humidity) during the forest fire. In Iran, most forests have a weak forest road network, and thus access to the entire forest is impossible. There was a high proportion of forest fires in areas with low forest density and also a weak road network coverage. Spatial analysis showed that most wildfires occurred in areas with a low-density population and at a great distance from public roads, although it is likely that other anthropogenic activities may have affected the expansion of fires. We suggest that studies on the influence of anthropogenic activities such as recreation, forest utilization, mining and farming on fire severity would be useful. Susceptibility fire maps showed that the vast majority of forests are located in the medium-class severity of fire, or higher, where there is a serious risk of fire since the study area has low forest road coverage. The need for forest roads in commercial forests is obvious, but also in protective forests, where they provide access and line breaks to suppress fires.
Acknowledgments
The authors would like to thank the reviewers for helpful suggestions that allowed us to improve this paper.
Disclosure statement
No potential conflict of interest was reported by the authors.
References
- Abdi O, Shetaee SH, Shirvani Z, Naghavi MR. 2012. The impact of forest management on forest fires in 2010 of Golestan Province by using GIS. Iran J For Range Protect Res. 2:100–108.
- Aldersley A, Murray SJ, Cornell SE. 2011. Global and regional analysis of climate and human drivers of wildfire. Sci Total Environ. 409:3472–3481.
- Alexander JD, Seavy NE, Ralph CJ, Hogoboom B. 2006. Vegetation and topographical correlates of fire severity from two fires in the Klamath-Siskiyou region of Oregon and California. Int J Wildland Fire. 15:237–245.
- Alkhatib AA. 2014. A review on forest fire detection techniques. Int J Distrib Sens Network. 2014:1–12.
- Alvarez A, Gracia M, Castellnou M, Retana J. 2013. Variables that influence changes in fire severity and their relationship with changes between surface and crown fires in a wind-driven wildfire. For Sci. 59:139–150.
- Alvarez A, Gracia M, Vayreda J, Retana J. 2012. Patterns of fuel types and crown fire potential in Pinus halepensis forests in the Western Mediterranean Basin. For Ecol Manage. 270:282–290.
- Arkle RS, Pilliod, DS, Welty JL. 2012. Pattern and process of prescribed fires influence effectiveness at reducing wildfire severity in dry coniferous forests. J For Ecol Manage. 276:174–184.
- Beverly JL, Herd EPK, Ross Conner JC. 2009. Modeling fire susceptibility in west central Alberta, Canada. For Ecol Manage. 258:1465–1478.
- Bonazountas M, Kallidromitou D, Kassomenos P, Passas NA. 2007. Decision support system for managing forest fire casualties. J Environ Manage. 84:412–418.
- Cardille JA, Ventura SJ, Turner MG. 2001. Environmental and social factors influencing wildfires in the upper Midwest, United States. Ecol Appl. 11:111–127.
- Chou YH, Minnich RA, Chase RA. 1993. Mapping probability of fire occurrence in San Jacinto Mountains, California, USA. Environ Manage. 17:129–140.
- De la Riva J, Pérez-Cabello F, Lana Renault N, Koutsias N. 2004. Mapping wildfire occurrence at a regional scale. Remote Sens Environ. 92:288–294.
- Dickson BG, Prather JW, Xu Y, Hampton HM, Aumack EN, Sisk TD. 2006. Mapping the probability of large fire occurrence in northern Arizona, USA. Land Sci Ecol. 21:747–761.
- Duane A, Piqué M, Castellnou M, Castellnou M, Brotons L. 2015. Predictive modelling of fire occurrences from different fire spread patterns in Mediterranean landscapes. Int J Wildland Fire. 24:407–418.
- Eskandari S. 2015. Investigation on the relationship between climate change and fire in the forests of Golestan Province. Iran J For Range Protect Res. 13(1):1–10.
- FAO. 2001. International handbook on forest fire protection. Technical guide for the countries of the Mediterranean basin. Le Tholonet: Departement Gestion des territoires, Division Agriculture et Forêt Méditerranéennes, Groupement d'Aix en Provence; p. 149.
- FAO. 2007. Fire management – global assessment 2006. FAO Forestry Paper 151; [ cited 2016 Jan 17]. Available from: http://www.fao.org/docrep/009/a0969e/a0969e00.htm
- Haight RG, Cleland DT, Hammer RB, Radeloff VC, Rupp TS. 2004. Assessing fire risk in the wild land–urban interface. J For. 102:41–48.
- Hann W, Jones J, Karl M. 1997. Landscape dynamics of the basin. In: Interior Columbia Basin Ecosystem Management Project: scientific assessment. Portland (OR): USDA Forest Service, Pacific Northwest Forest and Range Experiment Station; p. 337–1055. (General technical report; GTR-PNW-405).
- Holden ZA, Morgan P, Evans JS. 2009. A predictive model of burn severity based on 20-year satellite-inferred burn severity data in a large southwestern US wilderness area. For Ecol Manage. 258:2399–2406.
- Ireland KB, Stan AB, Fulé PZ. 2012. Bottom-up control of a northern Arizona ponderosa pine forest fire regime in a fragmented landscape. Landsc Ecol. 27:983–997.
- Jaiswal RK, Mukherjee S, Raju KD, Saxena R. 2002. Forest fire risk zone mapping from satellite imagery and GIS. Int J Appl Earth Obs Geoinf. 4:1–10.
- Jensen JR. 2005. Introductory digital image processing: a remote sensing perspective. 3rd ed. Upper Saddle River (NJ): Pearson Prentice Hall.
- Jung J, Kim C, Jayakumar S, Kim S, Han S, Kim DH, Heo J. 2013. Forest fire risk mapping of Kolli Hills, India, considering subjectivity and inconsistency issues. J Nat Hazards. 65:2129–2146.
- Lecina-Diaz J, Alvarez A, Retana J. 2014. Extreme fire severity patterns in topographic, convective and wind-driven historical wildfires of Mediterranean pine forests. PLoS ONE 9:e85127.
- Lee B, Kim SY, Chung J, Park PS. 2008. Estimation of fire severity by use of Landsat TM images and its relevance to vegetation and topography in the 2000 Samcheok forest fire. J For Res. 13:197–204.
- Lentile LB, Smith FW, Shepperd WD. 2006. Influence of topography and forest structure on patterns of mixed severity fire in ponderosa pine forests of the South Dakota Black Hills, USA. Int J Wildland Fire. 15:557–566.
- Mohammadi F, Pir Bavaghar M, Shabanian N. 2013. Forest fire risk zone modeling using logistic regression and GIS: an Iranian case study. Small-scale For J. 13:117–125.
- Mozaffarian V. 2007. Dictionary of Iranian plant names Latin–English–Persian. 5th ed. Vol. I. Tehran: Moaser Publishing.
- Narayanaraj G, Wimberly MC. 2011. Influences of forest roads on the spatial pattern of wildfire boundaries. Int J Wildland Fire. 20:792–803.
- Narayanaraj G, Wimberly MC. 2012. Influences of forest roads on the spatial patterns of human- and lightning-caused wildfire ignitions. Appl Geogr. 32:878–888.
- Núñez-Regueira L, Rodriguez JA, Castiñeiras JP. 2000. Design of risk index maps as a tool to prevent forest fires. Continental high mountainous zone of Galicia (NW Spain). Bioresour Technol. 71:51–62.
- Oliveira S, Oehler F, San-Miguel-Ayanz J, Camia A, Pereira JMC. 2012. Modeling spatial patterns of fire occurrence in Mediterranean Europe using Multiple Regression and Random Forest. For Ecol Manage. 275:117–129.
- Pew KL, Larsen CPS. 2001. GIS analysis of spatial and temporal patterns of human-caused wildfires in the temperate rain forest of Vancouver Island, Canada. For Ecol Manage. 140:1–18.
- Portillo-Quintero C, Sanchez-Azofeifa A, Espirito-Santo MM. 2013. Monitoring deforestation with MODIS active fires in neotropical dry forests: an analysis of local-scale assessments in Mexico, Brazil and Bolivia. J Arid Environ. 97:150–159.
- Price OF, Bradstock R. 2010. The effect of fuel age on the spread of fire in sclerophyll forest in the Sydney region of Australia. Int J Wildland Fire. 19:35–45.
- Raafatnia NA. 1988. Design and forestry and mountain roads projects. 1st ed. Mazandaran: Academic Press. Farsi with English abstract.
- Rezai A. 2009. Concepts of probability and statistics. 7th ed. Mashhad: Academic Press. Farsi with English abstract.
- Sakr GE, Elhajj IH, Mitri G. 2011. Efficient forest fire occurrence prediction for developing countries using two weather parameters. Eng Appl Artif Intell. 24:888–894.
- Schoennagel T, Veblen TT, Romme WH. 2004. The interaction of fire, fuels, and climate across rocky mountain forests. BioScience. 54:661–676.
- Syphard AD, Radeloff VC, Keuler NS, Taylor RS, Hawbaker TJ, Stewart SI, Clayton MK. 2008. Predicting spatial patterns of fire on a southern California landscape. Int J Wildland Fire. 17:602–613.
- Vega GC, Woodard PM, Titus SJ, Adamowicz WL, Lee BS. 1995. A logistic model for predicting the daily occurrence of human caused forest fires. Int J Wildland Fire. 5:101–111.
- Xu D, Dai L-M, Shao G-F, Tang L, Wang H. 2005. Forest fire risk zone mapping from satellite images and GIS for Baihe Forestry Bureau, Jilin, China. J For Res. 16:169–174.
- Yang J, He HS, Shifley SR. 2008. Spatial controls of occurrence and spread of wildfires in the Missouri Ozark Highlands. Ecol Appl. 18:1212–1225.
- Zarekar A, Vahidi H, Kazemi-Zamani B, Ghorbani S, Jafari H. 2013. Forest fire hazard mapping using fuzzy AHP and GIS. Study area: Gilan Province of Iran. Int J Tech Phys Problems Eng. 4:47–55.
- Zhang ZX, Zhang HY, Zhou DW. 2010. Using GIS spatial analysis and logistic regression to predict the probabilities of human-caused grassland fires. J Arid Environ. 74:386–393.