
 ?Mathematical formulae have been encoded as MathML and are displayed in this HTML version using MathJax in order to improve their display. Uncheck the box to turn MathJax off. This feature requires Javascript. Click on a formula to zoom.
ABSTRACT
The state of Jammu and Kashmir in North India experienced one of the worst floods in the past 60 years, during the first week of September 2014. In the present study, multi-temporal synthetic aperture radar (SAR) satellite images acquired from Indian Remote Sensing (IRS) satellite RISAT-1 and Canadian satellite Radarsat-2 during the peak flood period (08th–23rd September 2014) are used for extraction of flood disaster footprints, mapping spatial and temporal dynamics of flood inundation and assessing the disaster impact. With the aid of pre- and post-flood satellite images, coupled with hydro-meteorological data, the unprecedented flood situation is analyzed. It is estimated that about 557 km2 of the Kashmir Valley's geographical area was inundated. Bandipora, Pulwama, Srinagar, Baramulla and Budgam were the worst flood affected districts, having more than 50 km2 of their area affected by flood waters. Of the total inundated area, about 80% of the area under agricultural activity was submerged, followed by built-up areas constituting about 12% of geographical area. About 22 lakh people in 287 villages were affected by floods. The flood waters persisted in the northern and central part of the valley for more than two weeks.
1. Introduction
Floods are among the most frequent and catastrophic natural disasters occurring around the globe (Berz et al. Citation2001) and seriously impacting human lives and infrastructure. Due to poor socio-economic conditions, inadequate warning systems and preparedness, floods have a greater impact in the developing countries. Natural hazards, in the form of floods and debris flows, are a major threat to the people living in the high mountain regions (Watson & Haeberli Citation2004). During the last few decades, there has been an increase in the frequency of catastrophic flood disasters in the mountainous regions of the world (Sepúlveda & Padilla Citation2008; Korup & Clague Citation2009). The Indian Himalayan region itself has witnessed some cataclysmic hydrological disasters in the recent past, which includes the Kosi Floods (2008), the Leh flash floods and unprecedented Ganga River floods (2010), Brahmaputra floods (2012), Kedarnath flash floods (2013) and Jhelum floods (2014). Floods have been singled out as a major physical threat to sustainable development in the Himalayas (Ives Citation2004). The assessment of extreme weather floods for understanding the land surface and hydrological interaction processes is often hindered in the Himalayan region because of the inadequacy of the long-term hydrological data from well-distributed gauge stations and the complex nature of the terrain (Mirza Citation2005; Chaponnière et al. Citation2008; Romshoo et al. Citation2012). During catastrophic hydrological events, when the weather is hostile, access to the area is cut and the communication system collapses, accessing quick information about the severity, persistence, the spatial extent of inundated areas and dynamics of the flood water in order to plan relief efforts is a major challenge. The availability of timely information on flood disaster footprint and its impact is essential for the authorities to take quick decisions (Miranda et al. Citation1988; Okamoto et al. Citation1998). During major flood disasters when the phenomenon is widespread, traditional methods of flood mapping based on ground surveys and aerial observations are time-consuming, expensive and aerial observations can be impossible due to prohibitive weather conditions (Brivio et al. Citation2002). Satellite images are a rich source of information which can provide disaster footprints of higher accuracy that are useful for assessing the disaster impact and taking up flood mitigation activities (Islam & Sado Citation2000a; Sanyal & Lu Citation2006; Bhatt et al. Citation2013; Bhatt & Rao Citation2014). Significant advances in geospatial technologies have given disaster managers more confidence in defining and implementing better flood disaster response, preparedness and mitigation activities. The integration of GIS and Internet technology has revolutionized the use and range of geo-spatial data and its applications, especially for disaster management.
Jammu and Kashmir experienced the worst floods in the past 60 years during the first week of September 2014. The Jhelum River and its tributaries were in spate causing havoc and huge damage in the Kashmir Valley (Tabish & Nabil Citation2014). The Decision Support Centre (DSC) at the National Remote Sensing Centre (NRSC) kept a close watch on the flood situation. Emergency programming of Indian Remote Sensing (IRS) satellites, as well as foreign satellites, in order to have repeat coverage of the impacted areas of the Kashmir Valley, was instigated. In addition, the International Charter for Space and Major Disasters was activated, to provide additional and more frequent coverage. Rapid mapping and monitoring of the flood inundation was carried out and flood inundation maps were produced using automated procedures. About 50 flood inundation maps, showing the extent, recession, persistence and maximum extent of the inundation, along with list of villages affected, were disseminated in near real time to the state agencies. Flood monitoring was carried out from 8th to 23rd September 2015 and with the availability of RISAT-1 descending (morning) and ascending (evening) coverages, in addition to coverage's from other satellites, NRSC provided 12-hourly updates. The flood layers were published continuously on to the Bhuvan web portal ‘Disaster Services’ (http://bhuvan-noeda.nrsc.gov.in/disaster/disaster/disaster.php) and value-added satellite images showing the flood situation were published on NRSC website and provided to state agencies. Subsequently, detailed damage assessment and analysis of flood event was carried out with support of the Department of Environment & Remote Sensing, Jammu & Kashmir.
The present paper is based on the integrated use of satellite remote sensing, geographic information system (GIS), coupled with hydro-meteorological data for understanding the unprecedented flood situation and assessing the impact of flood disaster with the aid of pre- and post-flood satellite images.
2. Environmental setting of the study area
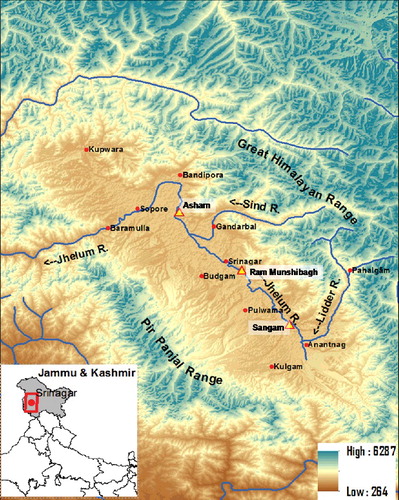
The Kashmir Valley is surrounded by the Pir Panjal range to the south and southwest, by Kashmir Himalaya to the north and by the Greater Himalayan range in north and northeast. It has an area of about 15,220 km2. The Kashmir Valley forms a part of Jhelum Basin, and has a fairly well-established drainage system, headed by the Jhelum River. The Jhelum Basin comprises 24 catchments having tributaries draining from the slope of the Pir Panjal range and joining the river on the left bank and others flowing from Himalayan range and joining the river on the right bank. The Jhelum River is the main river of the Kashmir Valley. It runs the entire length of the valley and most of the towns and villages are located on its bank. The valley is about 140 km long and 32 km wide. The average height of the valley is 1850 m above sea level, but the surrounding mountains, which are always snow-clad, rise from 3000 to 4000 m above sea level. The Kashmir Valley enjoys a more moderate climate, but weather conditions are unpredictable. The recorded high temperature is 33 °C and the recorded low temperature is −18 °C. shows the location of the Kashmir Valley.
Figure 1. Location map of the study area. Showing major settlements (filled dots), gauge stations (shown as triangles) located along Jhelum River and major drainage (thick line) overlaid over elevation data (background image).
3. Floods in Jammu and Kashmir
Jammu and Kashmir has had a long history of flooding, especially in the Kashmir Valley. Historically, the Kashmir Himalayan region has witnessed heavy casualties and loss of property due to flooding (Singh & Kumar Citation2013). The Kashmir Valley is one of the most flood hazard-prone Himalayan regions in India (Meraj et al. Citation2013). The unique geomorphologic set-up of the Jhelum Basin, with heterogeneous lithology and varied hydrological condition, renders the basin particularly vulnerable to flooding (Meraj et al. Citation2015). The area most affected by floods in the valley is the floor stretching from Anantnag in the south to Baramulla in the north. From the available literature and articles present on the Internet, it is observed that the valley witnessed significant flooding during 879 AD, 1841, 1893, 1903, 1929, 1948, 1950, 1957, 1959, 1992, 1996, 2002, 2006, 2010 and 2014.
Sir Walter Roper Lawrence mentions in his book, The Valley of Kashmir (Citation1895; p. 205), ‘Many disastrous floods are noticed in vernacular histories, but the greatest was the terrible inundation which followed the slipping of the Khadanyar mountains below Baramulla in AD 879.’ During 1841, a major flood affected Kashmir, causing much damage to life and property. A century later, in 1893, the state was affected by a flood of devastating proportions when 52 hours of continuous rainfall, beginning 18 July, caused what Lawrence describes as ‘a great calamity’ in which 25,426 acres of cropland was submerged, 2225 houses were wrecked and 329 cattle killed. There were major floods at the turn of the century, including the flood classified as the ‘greatest flood ever known,’ which came down the valley and inundated Srinagar on 23 July 1903, converting the city into ‘a whole lake.’ In 1929, another major flood hit the Kashmir Valley. Immediately after independence, the Valley was hit by a flood in 1948. Two years later, in September 1950, another major flood hit the state, with nearly 100 people losing their lives and more than 15,000 houses damaged. In August--September of 1957, another major flood was recorded in Jammu and Kashmir, with the Kashmir Valley being almost submerged. Two years later, in July 1959, the state witnessed yet another massive ‘glacial’ flood, perhaps the worst ever at the time, when four days of incessant rains lashed the valley and Srinagar, triggering floods in the Jhelum. Floods occurred again, due to heavy rainfall, in 1992 and were most devastating in terms of casualties. There were further floods in 1996, 2006, and 2007 and then in 2010 the region was affected by flash floods in the Leh--Ladakh region of Jammu and Kashmir, on 6 August 2010, causing severe loss of life and extensive damage to communication and infrastructure. During 2014, the Kashmir Valley witnessed one of the unprecedented flood situations in the last six decades.
4. Materials and methods
In the present study, synthetic aperture radar (SAR) satellite datasets operating in C-band (5.35 GHz) and HH (horizontal horizontal) polarization acquired from RISAT-1 (8, 9, 10, 11, 12, 17, 20 21, 22 and 23 September 2014) and Radarsat-2 (10 and 15 September 2014) were used for extraction of flood disaster footprints. To capture the extent of the flood in the valley and to have an overview of the flood situation, RISAT-1 data of Coarse Resolution (CRS) Scan SAR Mode and Radarsat-2 data from Scan SAR Wide Beam Mode, having a swath of about 220 and 500 km, respectively, and both having a moderate resolution of 50 m (pixel spacing), were used. In addition to the satellite data from SAR, cloud-free optical data acquired from high-resolution IRS Cartosat 2A satellite during floods (9 September 2014) were used to visually assess the flood situation and embankment breaches in the valley. Landsat 8 (30 m spatial resolution) data pre-flood (27 August 2014) and post-flood (10 September 2014), downloaded from USGS (http://earthexplorer.usgs.gov/), were used to analyze changes in snow cover. Analysis of precipitation data (0.25 × 0.25 degree) and its spatial distribution over the Jhelum Basin was carried out using Tropical Rainfall Measuring Mission (TRMM) 3-hourly TMPA-RT products (3–18 hours universal time coordinated [UTC]), downloaded from NASA website (http://trmm.gsfc.nasa.gov). The hourly hydrological (gauge and discharge) data received for Sangam, Ram Munshibagh and Asham gauge stations from Irrigation and Flood Control Department were also analyzed to study the discharge pattern during the flood event. Land use/land cover (1:50,000) maps generated under the ISRO Census Project were used to identify various categories of land use affected by floods. Administrative boundaries like the district, villages and municipal ward boundary were used for extraction of flood inundation statistics. All the raster-based analysis was carried out using ERDAS Imagine (version 9.3) and the GIS-based analysis was done using ARC GIS (version 9.3). Subsequent sections analyze the spatial distribution of rainfall, observed discharges, snow cover temporal changes, and flood inundation dynamics and affected land use.
4.1. Extraction of flood disaster footprints
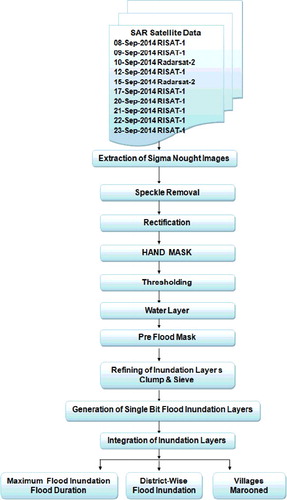
For extraction of flood disaster footprints and for generating the maximum spatial extent of flood inundation, 12 multi-temporal satellite images were used. shows the flowchart of the methodology adopted for extraction of flood inundation layer and generation of maximum spatial extent of flood inundation. SAR data is superior as compared to data from optical sensors for operational monitoring of flood disasters, due to the weather and illumination independence of their observations (Lu et al. Citation2004). HH-polarized data is better preferred than VV or cross-polarized data and shallow incidence angles (20°–49°) for better discrimination of inundated areas (Henry et al. Citation2006; Gstaiger et al. Citation2012; Pierdicca et al. Citation2013). SAR images were filtered to suppress speckle using a 3 × 3 median filter. The filtered images were converted into Sigma nought images in decibel (dB) using the following formula:(1)
(1) where SIGMAij is the output backscatter coefficient in decibels for scan line i, pixel j; log10() is the logarithm base 10 function; DN is the input image value for scan line i, pixel j; A0 is the gain offset from the first member of A0SEG; Aj is the expanded gain scaling table value for column j; sin () is the sine trigonometric function and; Ij is the expanded incident angle table value for column j.
Figure 2. Flowchart of the methodology adopted for extraction of flood inundation.
The speckle-suppressed sigma nought images were then geometrically co-registered with a master image in Lambert Conformal Conic projection and with Modified Everest as Spheroid for positional accuracy.
Furthermore, a mask using HAND (height above nearest drainage) model that expresses the height difference between a DEM cell and the closest cell of the drainage network (Rennó et al. Citation2008) was used to minimize potential misclassifications in non-flood-prone regions due to radar shadow in mountainous regions. The use of this mask eliminates areas from the satellite image that are above an empirically derived threshold from the flood classification, thereby reducing the processing time and misclassification. Martinis et al. (Citation2015) have observed that auxiliary data such as elevation information or the HAND index is more useful than slope information for classification improvement and is important to reduce water look-alike areas formed due to radar shadowing in mountainous regions. Following the use of HAND mask, a variable incidence angle threshold technique was used for the extraction of inundation layer. This is based on the principle that the radar backscatter from a feature decreases with increase in its incidence angle (Baghdadi et al. Citation2001). Backscatter response at river cross sections and areas adjacent to the river in near and far ranges are evaluated by drawing the transect lines, and an average backscatter range is chosen. Water-covered areas yield very low backscatter and appear dark in radar imagery (Zhou et al. Citation2000). Intensities within −18 to −25 range are suitable to classify water pixels. Intensities within these ranges were classified as water, whereas pixels with intensities above the threshold were classified as nonflooded. The inundation layer obtained with variable threshold technique is further masked using a pre-flood mask consisting water bodies, river channel and waterlogged areas extracted from the land use/land cover layer (Source: NRSC/ISRO) for removal of pre-flood water bodies. Further refining of the inundation layer is done by superimposing it over the shaded relief layer prepared from Cartosat-1 DEM to remove any misclassification over hills. The final layer is then refined by grouping and removing the stray pixels using the clump and sieve tools. Finally, using recode command, a single-bit flood inundation layer is generated containing flooded (grid code = 1) and nonflooded (grid code = 0) classes. The individual flood layers generated from the satellite data analysis of 8th to 23rd September 2014 were integrated to obtain the maximum spatial extent of inundation, flood persistence, land use affected and integrated with administrative boundaries to compute inundation statistics. A flood duration map was generated to identify the persistence of flood waters in the valley.
The spatial variation in rainfall over the Jhelum Basin for the flood event was analyzed using Tropical Rainfall Measuring Mission (TRMM) 3-hourly TMPA-RT products (3–18 hours UTC) data. The data in ASCII format were converted to grid format and the values were extracted for all 24 catchments using zonal statistics option in ARC GIS between 1st and 6th September 2014. The rainfall accumulation observed is reclassified into five categories: no rainfall, 1–20 mm, 21–50 mm, 51–100 mm and more than 100 mm.
5. Results and discussion
This section presents the results of the hydro-meteorological observations, snow cover changes, and flood dynamics, and provides an assessment of the factors that aggravated the flooding.
5.1. Rainfall analysis
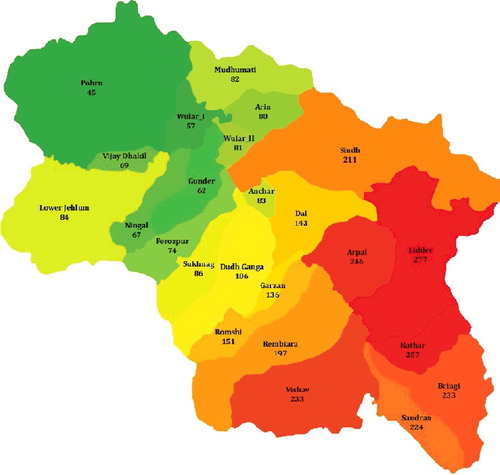
It is observed from the analysis that, between 1st and 2nd September, 2014, eight catchments (Sindh, Lidder, Bringi, Kuthar, Sandran, Vishaw, Rambiara, and Romshi) located in the southern and north-western part of the Kashmir Valley received rainfall in the range of 20–50 mm. Subsequently, the rainfall increased to 50–100 mm in these eight catchments and the remaining 16 catchments in the valley also received rainfall in the range of 20–50 mm. There was heavy precipitation in the Jhelum Basin on 4th September 2014. The Sindh, Lidder, and Arpal catchments received more than 100 mm of rainfall, 10 other catchments (Lower Jhelum, Bringi, Kuthar, Sandran, Vishaw, Rambiara, Romshi, Gazan Doodhganga, and Dal) received about 50–100 mm of rain, while the rest of the basin received 20–50 mm of rain. shows the spatial variation in rainfall over the Jhelum Basin between 1st and 6th September, 2014. The valley was under thick cloud cover for over a week (). Recession in the precipitation trend occurred from 5th September 2014 onwards. Between 1st and 6th September 2014, catchments in the southern part of the Jhelum Basin () received more than 200 mm of rain (Sindh 211 mm, Sundran 224 mm, Bringi and Vishav 233 mm, Kuthar 257 mm, Arpal 246 mm and Lidder 277 mm). Most of the catchments in the central part of the basin received between 100 and 200 mm of rain (Remibara 197 mm, Romshi 156 mm, Dal 143 mm, Garzan 136 mm, Dudh Ganga 106 mm) over the same period. Districts like Anantnag, Kulgam, Shopain, Srinagar and Pulwama located in the southern and central part of the Jhelum Basin experienced heavy to very heavy rainfall. Catchments in the northern part received relatively less precipitation, varying between 45 and 85 mm. The IMD (Indian Meteorological Department) also has similar observations, showing that Jammu and Kashmir had a rainfall deficit of 308 mm as on 3rd September 2014. However, the state received 250 mm rainfall in the next three days (3–6 September 2014) to feature in the category of excess rainfall.
Figure 3. Spatial variation in rainfall for Jhelum basin between 1 and 6 September 2014 (Source: TRMM data). Rainfall categories: 0 (green), 1–20 mm (yellow), 21–50 mm (light brown), 51–100 mm (pink) and more than 100 mm (red colour). To view this figure in colour, please see the online version of the journal.
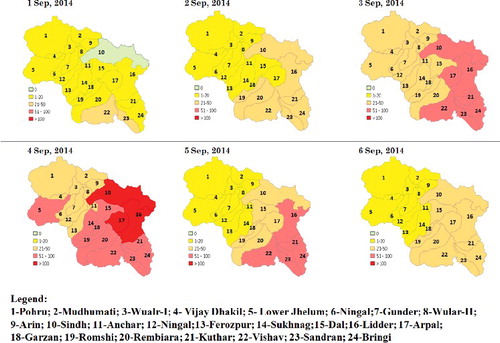
Figure 4. Dense cloud cover covering the entire valley observed from IRS Resourcesat AWiFS image of 07-Sep-2014. White colour represents clouds, cyan colour shows snow cover, and green colour shows vegetation. Dark blue colour represents the water body/river water layer overlaid over the image. To view this figure in colour, please see the online version of the journal.
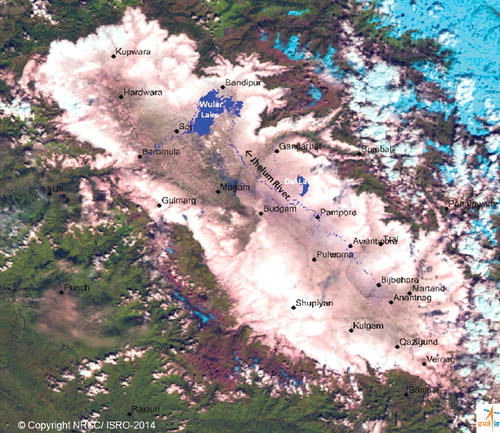
Figure 5. Cumulative precipitation over the Jhelum basin between 1 and 6 September 2014 (Source: TRMM data). To view this figure in colour, please see the online version of the journal.
5.2. Hydrological analysis
The analysis of hourly hydrological (gauge and discharge) data received for Sangam, Ram Munshibagh and Asham gauge stations from Irrigation and Flood Control Department shows that the Jhelum River was flowing above danger level from 3rd September 2014 to 11th September 2014 at all three gauge sites. At the Sangam gauge site, HFL (highest flood level) of 1595.28 m was recorded at 01.00 hours on 6 September 2014, which was 10.58 m above mean sea level (MSL) of zero at gauge station of 1584.70 m. At the Ram Munshibagh (Srinagar) gauge site, HFL of 1589.20 m was recorded at 02.00 hours on 8th September 2014, which was 9.0 m above MSL of zero at gauge station of 1580.20 m. The field survey carried out by the Irrigation and Flood Control Department revealed that, due to the flood waters, the average width of the river in the south Kashmir region increased to about 2–3 km compared with the ‘normal’ width of 100–200 m. At peak, the flood water was flowing about 1 m above the bunds for a length of 20 km (from Sangam to Kakapora). Discharge at Sangam was the highest (135,000 cusecs) ever recorded on 6th September 2014. There are no reliable discharge statistics available for the 1959 floods, although some reports suggest that the discharge was almost 100,000 cusecs at Sangam and about 80,000 cusecs was recorded during the 1928 floods. The carrying capacity of Jhelum in Srinagar city is about 35,000 cusecs and another 15,000 in the supplementary channel. The flood inflow was more than the combined carrying capacity of Jhelum and flood channel, despite the natural breaches.
5.3. Snow cover change before and after flood event
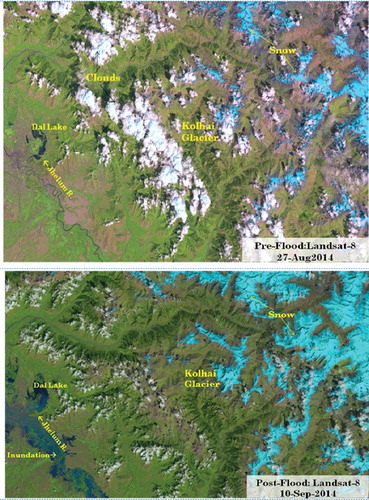
The temporal changes in snow cover were analyzed visually to evaluate the probable contribution of snow to the flood event. shows pre- and post-flood Landsat-8 natural colour images, in which the snow appears in cyan colour, water bodies and flood-inundated areas in shades of dark blue to light blue, clouds in white colour, vegetation in shades of green, with non-agricultural land and open areas in shades of brown colour. From the analysis of the pre- and post-flood images, it can be observed that the snow cover in the region appears to be less prior to the flood and more in the satellite image acquired after the flood event (). The snout of Kolhai Glacier is also almost intact in the post-flood image. These evidences support the fact that there was not much snow cover prior to the flood that could have melted and contributed to the runoff. The heavy rainfall itself was probably the major factor that contributed to the heavy inflows to the Jhelum River and caused the unprecedented flooding. However, there could have been contributions resulting from fresh snowfall occurring during flood days.
Figure 6. Pre- and post-flood event, changes in snow cover observed from Landsat-8 satellite images of 27 August and 10 September 2014 (Source: USGS). To view this figure in colour, please see the online version of the journal.
5.4. Flood inundation spatial extent and persistence
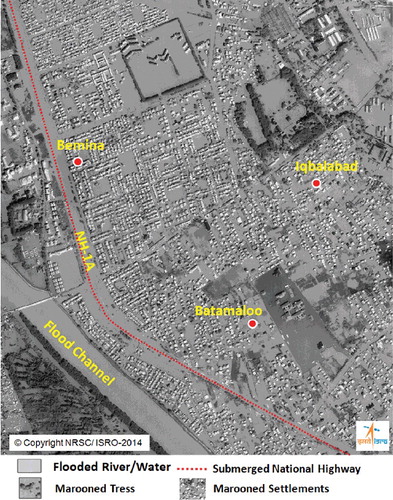
From the integrated analysis of multi-date-derived flood layers, about 557 km2, which constitutes about 3.5% of the Kashmir Valley's geographical area, was flooded (). Bandipora, Pulwama and Srinagar districts were severely affected, with more than 100 km2 of each submerged. shows the cumulative flood inundation map generated from satellite images acquired over the Kashmir Valley between 8th and 23rd September 2014. It can be seen that the entire valley was affected by the floodwaters. About 22 lakh people in 287 villages were affected by the floods as on 23rd September 2014. The integration of land use with the inundation layer shows that, out of the total inundated area, 444 km2 was agriculture land, 20 km2 was horticulture land, 67 km2 built-up area, 3 km2 forest area, 21 km2 wasteland and 2 km2 other category (). Satellite images show that the flood waters overflowing the banks of the Jhelum River breached its embankments at several places along the entire valley. The embankment breaches and inundation due to overflowing of Jhelum waters along the left and right banks in the Gandabal, Soitang and Batwara areas are captured on the high-resolution IRS Cartosat-2A image of 9th September 2014 (). From satellite image, it is clearly observed that the entire valley was surrounded by flood waters and only rooftops were visible, all the roads were totally submerged with water and flood channels constructed to divert excess water were also full and overflowing. shows the flood situation in parts of the Bemina, Iqbalabad and Batamaloo area, Srinagar from IRS Cartosat-2A image of 9th September 2014. From satellite images ( and ), it is also clear that the entire length of the Jhelum River is constricted by construction on both banks, leaving no space for the water to overflow onto the flood plains, but inundating the habitation.
Table 1. District-wise inundated area.
Figure 7. Cumulative flood inundation spatial extent (cyan colour) observed in Kashmir Valley between 8 and 25 September 2014.
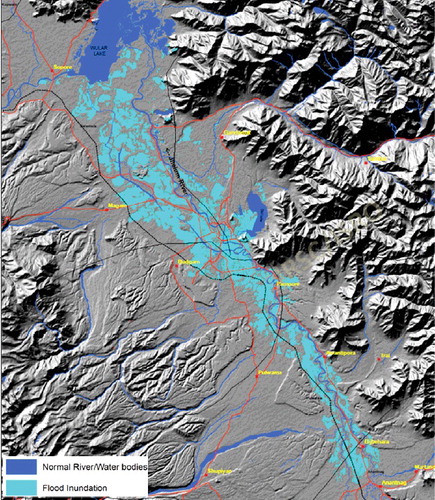
Table 2. Land use/land cover classes under flood inundation.
Figure 8. Flood inundation observed in parts of Gandabal, Soitang and Batwara area, Srinagar from high-resolution IRS Cartosat image of 9 September 2014.
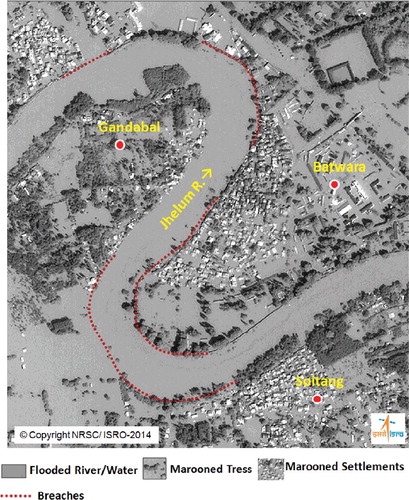
Figure 9. Flood inundation observed in parts of Bemina, Iqbalabad and Batamaloo area, Srinagar from high-resolution IRS Cartosat image of 9 September 2014.
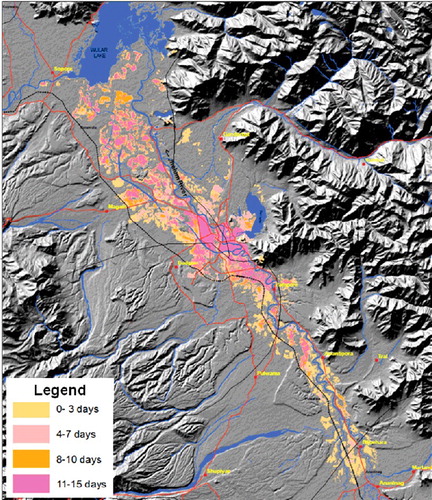
The flood duration map (), generated from satellite images acquired over Kashmir Valley between 8th and 23rd September 2015, shows that most of the northern and central of Kashmir valley, including Srinagar city, were under water for more than two weeks, while the southern parts of the Kashmir valley remained submerged for more than a week. Superimposition of the municipal ward boundaries over the inundation layer shows that about 998 colonies in 59 wards in Srinagar city were flooded.
Figure 10. Flood persistence within the valley based on the analysis of satellite images acquired during 8–25 September 2014.
5.4. Probable causes of the flood event
The Himalayan region is especially affected by hydrological disasters, as it has precipitous relief, witnesses heavy torrential rainstorms, frequent cloud bursts, and has a history of natural hazards aggravated by melting of snow and glaciers (Ebi et al. Citation2007). Heavy precipitation during the first week of September 2014 appears to be the major cause to trigger such massive flood devastation in the valley. The rainfall data figures of Indian Metrological department (IMD) from 28th August to 10th September 2014 for Jammu and Kashmir reveal that actual rainfall received (1645 mm) in South Kashmir area was way above normal (124.9 mm). TRMM data analysis has revealed that the southern catchments of the Jhelum River received heavy downpours between the 1st September and 6th September 2014. Around 650 mm of rainfall was recorded on 4th September 2014. The cumulative rainfall from 1st September to 6th September 2014 on a catchment basis shows that Lidder catchment received the maximum amount of rainfall, i.e. 277 mm, along with adjoining catchments in South Kashmir (Arpal, Bringi, Kuthar, Sandran, and Vishaw) also receiving rainfall above 200 mm. The heavy rainfall alone contributed to the severe floods and snowmelt had very little role to play as the post-flood image showed more snow cover than pre-flood image (). Due to the ongoing monsoon rains, followed by incessant high rainfall for four days during the first week of September 2014, the soil of the region which was already saturated generated high runoff with the Jhelum River and its tributaries running an all-time high at various places and causing unprecedented flood situation. The high runoff raised the flood level of Jhelum at Sangam to about 34.70 ft (danger level 21 ft) breaking all the previous records. This resulted in the abrupt increase in the flood level at Ram Munshi Bagh, which touched around 29.50 ft (danger level 18 ft). In addition to the heavy rainfall in the Jhelum Basin, the increased discharge was boosted by heavy rains in the Sindh Basin (105 mm), resulting in heavy discharge in Sindh Nallah which joins the Jhelum at Shadipora. The enormous flood inflow was more than the combined carrying capacity of Jhelum and flood channels. This caused an upward rush and limited the free flow of Jhelum water into Wular Lake that had the necessary detention capacity at that point of time. Moreover, the flat topography of the Jhelum basin also did not allow the excess water to drain out quickly and Jhelum flood waters overtopped its banks inundating the adjoining areas.
Various studies have shown that the main causes of flood disasters in mountainous regions are increasing global temperature, population growth, an increase in habitation in high slope zones, loss of wetlands, deforestation and unrestrained land-use changes (Berz et al. Citation2001; McBean Citation2004; Peduzzi et al. Citation2009; Meraj et al. Citation2012; Bhat et al. Citation2013, Citation2014; Romshoo & Rashid Citation2014). Although heavy precipitation may be the immediate cause of floods in the Kashmir valley, the problem has been aggravated by many factors including the concretization of the valley, encroachment of buildings on the land adjoining river banks and disappearance of wetlands. The dense settlement all along the banks of the Jhelum and within the valley, together with roads cross-cutting the valley, has blocked natural drainage network ( and ). This causes the water stagnate in local depressions, even after the water level in the Jhelum goes down and makes the situation worse until pumped out. This was exactly the situation during the September 2014 floods when the valley remained marooned by floodwaters for several days, even after the Jhelum waters had started to recede (). Srinagar city has experienced accelerated horizontal sprawl that has resulted in large-scale encroachment and degradation of productive agriculture/horticulture land, life-supporting wetlands, green spaces and forest areas, which could have absorbed the floodwaters (Kuchay & Bhat Citation2014).
The Kashmir Valley has a vast network of wetlands and waterways (Sheeshnag, Dallake, Anchar Lake, Hokersar, Nambal Narkura, Wular Lake Gangbal, Vaishan sar, Kishan sar, Kausarnag, Khanpur, and Waskur) locally called ‘Dembs’ to the Srinagar city which acted as sponges during the floods and shared the Jhelum waters. Rashid and Naseem (Citation2008), in their study (1911–2004), observed that 50 percent of the lakes and wetlands were lost in the suburbs of Srinagar city during the last century, which has affected the micro-climate of the city, besides exposing it to an increased flood threat. Analysis of the Hokersar wetland based on the multi-temporal, multi-source satellite and other thematic datasets has shown that the wetland has receded consistently and undergone tremendous land use/land cover change owing to siltation coupled with floods and human interference (Joshi et al. Citation2002; Rashid & Naseem Citation2008). The Hokersar wetland has experienced fragmentation and changes in land use/land cover due to excessive siltation and biotic interference over the last four decades (Joshi et al. Citation2002). The rapid urbanization of the city has encroached the wetlands like Littorals of Dal, Anchar, Hokrasar, and Narkara causing a substantial reduction in their size (Bhat Citation2008). Farooq and Muslim (Citation2014) have observed that the built-up area within Srinagar city limits during the last three decades (1972–2004) has grown by about 29.20% (from 18.10 to 84.50 km2), nearly three times the rate of population growth. These studies demonstrate unanimously that the depletion and degradation of these wetlands due to excessive siltation, rapid urbanization and encroachments has an adverse impact on the efficacy of the wetlands to retain floodwaters during peak discharge and flash floods, thus endangering the lives and property of the Srinagar city and suburban areas. The need for urgent restoration of these wetlands has been stressed repeatedly (Joshi et al. Citation2002; Bhat Citation2008; Romshoo et al. Citation2011).
There is an urgent need to assess the watershed characteristics holistically in order to analyze the hydrological response of watersheds, and to develop an understanding of the processes involved in the occurrence of floods (Simonovic & Li Citation2003). The physical (topography, geology, soil, and geomorphology) and morphometric characteristics (stream order, drainage density, stream frequency, and elongation ratio) control the hydrological response of a watershed and have a significant influence on the incidence and magnitude of floods (Chow Citation1964; Strahler Citation1964; Hudson & Colditz Citation2003; Romshoo et al. Citation2012; Zaz & Romshoo Citation2012; Meraj et al. Citation2015). A well-distributed network of hydro-meteorological and river discharge stations needs to be established over the whole of the Jhelum Basin to strengthen the flooding forecasting mechanism in the region. The integrated analysis of the morphometric, land cover, and topographic analysis for characterizing the hydrological behaviour of the Kashmir Himalayan watersheds needs to be undertaken with a focus on the watershed management activities required to absorb excess runoff.
6. Conclusions
Floods cannot be stopped, but with advanced technologies their impact can be minimized and during catastrophic flood disasters, like the Jhelum floods, satellites can play a major role in mapping and monitoring the flood situation. Indian Radar Imaging Satellite (RISAT-1) with C-band SAR has emerged as the major workhorse for space-based monitoring of flood disasters, because of the quick revisit and the ability to see through the clouds and observe the Earth at any time of the day. RISAT-1 has complemented and supplemented the operationally optical images obtained from the IRS class of satellites. RISAT-1 played a major role during the Jhelum floods in providing information to the state agencies on the flood situation and its severity in Jammu and Kashmir during September 2014. The maximum spatial extent of flood disaster footprints and persistence of flood waters captured through multi-temporal satellite images during the catastrophic Jhelum floods of 2014 have given an opportunity to understand the flood hazard in the valley and plan for future short- and long-term flood hazard management strategies in the region. The flood hazard information can be useful in identifying the flood risk and vulnerability, which in turn can help to plan future urbanization and formulate comprehensive land-use plan for the sustainable and balanced urban development in the region. The present study demonstrates that satellite images can be one of the most cost-effective ways of capturing flood disaster footprints, identifying areas vulnerable to flooding and understanding the flooding problem in a better way.
The study has highlighted the fact that cumulative effect of the heavy rainfall in the valley during 3rd to 6th September 2014 has led to the unprecedented flood situation. All the districts of Anantnag, Bandipora, Baramulla, Budgam, Ganderbal, Kulgam, Pulwama and Srinagar lying within the valley are vulnerable to flooding. The flat topography of the valley does not allow quick draining of flood waters. The floodwaters persistence is observed to be greater in the central and northern part of the valley, especially in Srinagar area which was inundated for more than two weeks. This event also highlights the inability of the existing drainage system to divert floodwaters and that it needs to be revamped and strengthened to handle heavy discharges. As observed from the satellite images, both banks of the Jhelum River are densely populated, constricting the flow of the river through a narrow channel. There is an urgent need to strengthen the existing embankments and construct more flood diversion channels.
For long-term flood management, an integrated approach is required considering the hydrological, geological and geomorphological aspects of the river basin. The hydrological response, based on the watershed characteristics, has a significant influence on the incidence and magnitude of the occurrence of floods and needs to be better understood. Non-structural measures, including watershed management practices, need to be implemented to absorb excess runoff. The valley has numerous natural wetlands but these are vanishing rapidly, which need to be revived so as to absorb the surplus floodwaters and act as ‘cushion’ to save the city. There is a strong need to strengthen the flood early warning systems supported by well-distributed network of hydro-meteorological (including Doppler Weather Radars) and river discharge stations to minimize the impact of such disasters in future.
Acknowledgments
The ground support and cooperation for the study provided by Shri Suresh Chugh, IFS, APCCF/Director, Department of Ecology Environment & Remote Sensing J&K and his team during the flood disaster is gratefully acknowledged. The authors are thankful to Sh. Tasaduq Hussain, Irrigation and Flood Control Department, Jammu and Kashmir for providing discharge-related information. We also gratefully acknowledge the support and co-operation provided by colleagues of Disaster Management Support Division in carrying out the study. We sincerely thank GESDISC Interactive Online Visualization and Analysis Infrastructure (Giovanni) for allowing utilization of the TRMM data. The Landsat-8 data available from USGS is also acknowledged.
Disclosure statement
No potential conflict of interest was reported by the authors.
Related Research Data
References
- Baghdadi N, Bernier M, Gauthier R, Neeson I. 2001. Evaluation of C-band SAR data for wetlands mapping. Int J Remote Sens. 22:71–88. doi:10.1080/014311601750038857
- Berz G, Kron W, Loster T, Rauch E, Schimetschek J, Schmieder J, Siebert A, Smolka A, Wirtz, A 2001. World map of natural hazards—a global view of the distribution and intensity of significant exposures. Nat Hazards. 23:443–465. doi:10.1023/A:1011193724026
- Bhat MS. 2008. Urban system in Himalayas – a study of Srinagar city region. New Delhi: Dilpreet Publishing Co.
- Bhat SA, Meraj G, Yaseen S, Bhat AR, Pandit AK. 2013. Assessing the impact of anthropogenic activities on spatiotemporal variation of water quality in Anchar lake, Kashmir Himalayas. Int J Environ Sci. 3:1625–1640. doi:10.6088/ijes.2013030500032
- Bhat SA, Meraj G, Yaseen S, Pandit AK. 2014. Statistical assessment of water quality parameters for pollution source identification in Sukhnag stream: an inflow stream of lake Wular (Ramsar Site), Kashmir Himalaya. J Ecosyst. 2014:18. Article ID 898054. doi:10.1155/2014/898054
- Bhatt CM, Rao GS. 2014. Ganga floods of 2010 in Uttar Pradesh, north India: a perspective analysis using satellite remote sensing data, Geomatics. Nat Hazards Risk. doi:10.1080/19475705.2014.949877
- Bhatt CM, Rao GS, Begum A, Manjusree P, Sharma SVSP, Prasanna L, Bhanumurthy V. 2013. Satellite images for extraction of flood disaster footprints and assessing the disaster impact: Brahmaputra floods of June–July 2012, Assam, India. Curr Sci. 104:1693–1700.
- Brivio PA, Colombo R, Maggi M, Tomasoni R. 2002. Integration of remote sensing data and GIS for accurate mapping of flooded areas. Int J Remote Sens. 23:429–441. doi:10.1080/01431160010014729.
- Chaponnière A, Boulet G, Chehbouni A, Aresmouk M. 2008. Understanding hydrological processes with scarce data in a mountain environment. Hydrol Proc. 22:1908–1921. doi:10.1002/hyp.6775
- Chow VT. 1964. Hand book of applied hydrology. New York: McGraw-Hill.
- Ebi KL, Woodruff R, von Hildebrand A, Corvalan C. 2007. Climate change-related health impacts in the Hindu Kush-Himalayas. EcoHealth. 4:264–270. doi:10.1007/s10393-007-0119-z
- Farooq M, Muslim M. 2014. Dynamics and forecasting of population growth and urban expansion in Srinagar City – a Geospatial approach. Int Arch Photogramm Remote Sens Spatial Inform Sci. 1:709–716.
- Gstaiger V, Huth J, Gebhardt S, Wehrmann T, Kuenzer C. 2012. Multi-sensoral and automated derivation of inundated areas using terraSAR-X and ENVISAT ASAR data. Int J Remote Sens. 33:7291–7304. doi:10.1080/01431161.2012.700421.
- Henry JB, Chastanet P, Fellah K, Desnos YL. 2006. Envisat multi‐polarized ASAR data for flood mapping. Int J Remote Sens. 27:1921–1929. doi:10.1080/01431160500486724
- Hudson PF, Colditz RR. 2003. Flood delineation in a large and complex alluvial valley, lower Panuco basin, Mexico. J Hydrol. 280:229–245. doi:10.1016/S0022-1694(03)00227-0
- Joshi PK, Rashid H, Roy PS. 2002. Landscape dynamics in Hokersar wetland, Jammu & Kashmir – an application of geospatial approach. J Indian Soc Remote Sens. 30:1–5.
- Islam MM, Sado K. 2000a. Development of flood hazard maps of Bangladesh using NOAA-AVHRR images with GIS. Hydrol Sci J. 45:337–355. doi:10.1080/02626660009492334
- Ives JD. 2004. Himalayan perceptions: environmental change and the well-being of mountain peoples. London: Routledge.
- Korup O, Clague JJ. 2009. Natural hazards, extreme events, and mountain topography. Quat Sci Rev. 28:977–990. doi:10.1016/j.quascirev.2009.02.021
- Kuchay NA, Bhat MS. 2014. Analysis and simulation of urban expansion of Srinagar city. Trans Inst Indian Geogr. 36:109–121.
- Lawrence WR. 1895. The Valley of Kashmir. New Delhi: Asian Educational Services.
- Lu Z, Rykhus R, Masterlark T, Dean KG. 2004. Mapping recent lava flows at Westdahl Volcano, Alaska, using radar and optical satellite imagery. Remote Sens Environ. 91:345–353. doi:10.1016/j.rse.2004.03.015
- Martinis S, Kuenzer C, Wendleder A, Huth J, Twele A, Roth A, Dech S. 2015. Comparing four operational SAR-based water and flood detection approaches. Int J Remote Sens. 36:3519–3543. doi:10.1080/01431161.2015.1060647
- McBean G. 2004. Climate change and extreme weather: a basis for action. Nat Hazards. 31:177–190. doi:10.1023/B:NHAZ.0000020259.58716.0d
- Meraj G, Romshoo SA, Yousuf AR. 2012. Geoinformatics approach to qualitative forest density loss estimation and protection cum conservation strategy – a case study of Pir Panjal range, J&K, India. Int J Curr Res Rev. 4:47–61.
- Meraj G, Shakil A, Romshoo SA, Yousuf AR, Altaf S, Altaf F. 2015. Assessing the influence of watershed characteristics on the flood vulnerability of Jhelum basin in Kashmir Himalaya. Nat Hazards. 77:153–175. doi:10.1007/s11069-015-1605-1
- Meraj G, Yousuf AR, Romshoo SA. 2013. Impacts of the geo-environmental setting on the flood vulnerability at watershed scale in the Jhelum basin [MPhil dissertation]. Srinagar: University of Kashmir. Available from: http://dspaces.uok.edu.in/jspui//handle/1/1362
- Miranda FP, Fonseca LEN, Carr JR. 1988. Semivariogram textural classification of JERS-1 SAR data obtained over a flooded area of the Amazon rainforest. Int J Remote Sens. 19:549–556. doi:10.1080/014311698216170
- Mirza MMQ. 2005. Hydrologic modeling approaches for climate impact assessment in South Asia. Climate change and water resources in South Asia. Leiden: Balkema Press; p. 23–54. doi:10.1201/9780203020777.ch2
- Okamoto K, Yamakawa S, Kawashima H. 1998. Estimation of flood damage to rice production in North Korea in 1995. Int J Remote Sens. 19:365–371. doi:10.1080/014311698216332
- Peduzzi P, Dao H, Herold C, Mouton F. 2009. Assessing global exposure and vulnerability towards natural hazards: the Disaster Risk Index. Nat Hazards Earth Syst Sci. 9:1149–1159. http://www.nat-hazards-earth-syst-sci.net/9/1149/2009/
- Pierdicca N, Pulvirenti L, Chini M, Guerriero L, Candela L. 2013. Observing floods from space: experience gained from COSMO-SkyMed observations. Acta Astronaut. 84:122–133. doi:10.1016/j.actaastro.2012.10.034
- Rashid H, Naseem G. 2008. Quantification of loss in spatial extent and wetlands in the suburbs of Srinagar city during last century using geospatial approach. In: Sengupta M and Dalwani R, editors. Proceedings of Taal 2007: The 12th World Lake conference; p. 653–658. http://www.indiaenvironmentportal.org.in/files/file/spatial%20extent%20of%20lakes%20and%20wetlands%20Srinagar.pdf
- Rennó CD, Nobre AD, Cuartas LA, Soares JV, Hodnett MG, Tomasella J, Waterloo MJ. 2008. HAND, a new terrain descriptor using SRTM-DEM: mapping terra-firme rainforest environments in Amazonia. Remote Sens Environ. 112:3469–3481. doi:10.1016/j.rse.2008.03.018
- Romsho SA, Ali N, Rashid I. 2011. Geoinformatics for characterizing and understanding the spatio-temporal dynamics (1969 to 2008) of Hokersar wetland in Kashmir Himalayas. Int J Phys Sci. 6:1026–1038. doi:10.5897/IJPS10.378
- Romshoo SA, Bhat SA, Rashid I. 2012. Geoinformatics for assessing the morphometric control on hydrological response at watershed scale in the Upper Indus basin. J Earth Syst Sci. 121:659–686. doi:10.1007/s12040-012-0192-8
- Romshoo SA, Rashid I. 2014. Assessing the impacts of changing land cover and climate on Hokersar wetland in Indian Himalayas. Arabian J Geosci. 7:143–160. doi:10.1007/s12517-012-0761-9
- Sanyal J, Lu XX. 2006. GIS based flood hazard mapping at different administrative scales: a case study in Gangetic West Bengal, India. J Trop Geogr. 27:207–220. doi:10.1111/j.1467-9493.2006.00254.x
- Sepúlveda SA, Padilla C. 2008. Rain-induced debris and mudflow triggering factors assessment in the Santiago cordilleran foothills, Central Chile. Nat Hazards. 47:201–215. doi:10.1007/s11069-007-9210-6
- Simonovic SP, Li L. 2003. Methodology for assessment of climate change impacts on large-scale flood protection system. J Water Resour Plan Manage. 129:361–371.
- Singh O, Kumar M. 2013. Flood events, fatalities and damages in India from 1978 to 2006. Nat Hazards. 69:1815–1834.
- Strahler AN. 1964. Quantitative geomorphology of drainage basins and channel networks, Sec. 4–11. In: Chow VT, editor. Handbook of applied hydrology. New York: McGraw-Hill.
- Tabish SA, Nabil S. 2014. Epic tragedy: Jammu & Kashmir floods: a clarion call. Emerg Med. 5:1–8. doi:10.4172/2165-7548.1000233
- Watson RT, Haeberli W. 2004. Environmental threats, mitigation strategies and high mountain areas. Mountain areas: a global resource. Ambio. 13:2–10.
- Zaz S, Romshoo SA. 2012. Assessing the geoindicators of land degradation in the Kashmir Himalayan region, India. Nat Hazards. 64:1219–1245. doi:10.1007/s11069-012-0293-3
- Zhou C, Luo J, Yang C, Li B, Wang S. 2000. Flood monitoring using multi-temporal AVHRR and RADARSAT imagery. Photogramm Eng Remote Sens. Special Issue. Geospatial Technol China. 66:633–638.