
 ?Mathematical formulae have been encoded as MathML and are displayed in this HTML version using MathJax in order to improve their display. Uncheck the box to turn MathJax off. This feature requires Javascript. Click on a formula to zoom.
ABSTRACT
It is an indisputable fact that wetlands in northern China are subject to increasing pressures from climate change and other human-mediated activities, including the wetland in the Ordos Larus relictus National Nature Reserve. Dynamic monitoring the wetland's state and changes have an irreplaceable role in its protection and management but have rarely been performed systematically. In this study, the wetland land-cover changes during 1991–2014 were analyzed using three land-cover components (vegetation, soil and water) acquired through linear spectral unmixing. Then, the temporal ecological changes were predicted for the next 5–100 years using cellular automata and Markov chain models. The results showed that, under the natural and anthropogenic effects, the wetland is suffering continuous degradation. From 2000 to 2005, a dramatic change characterized by a rapid reduction in water area and a significant increase in vegetation coverage occurred. The water area decreased to its historic minimum of 1.74 km2 in 2010. The prediction results indicated that the water area will further decrease to less than 0.1 km2 over the next 35 years. Considering the steady decline in precipitation over the past 50 years, halting destructive human activities and artificially intervening with wetland management are reasonable alternatives to prevent additional degradation.
1. Introduction
Wetlands are areas where water is the primary factor controlling the environment and its associated plant and animal life (Finlayson Citation2012). Although the global area of wetlands accounts for only 6.2%–7.6% of the Earth's land surface (Lehner & Döll Citation2004), the role of wetlands is prominent in provisioning a wide range of ecosystem services, including freshwater and groundwater supplies, food and building materials, biodiversity, flood and drought mitigation, erosion control and water pollution mitigation (Bolund & Hunhammar Citation1999; Zedler & Kercher Citation2005; RAMSAR Citation2007; Halabisky et al. Citation2011). However, 64%–71% of the wetland losses in the world have occurred during the twentieth and early twenty-first century (Davidson Citation2014). In China, over half the wetlands have declined over the past 50 years; and between 1990 and 2000, nearly 30% of China's natural wetlands disappeared (Guo et al. Citation1990; Ren et al. Citation2007; Cyranoski Citation2009).
These changes to wetlands have been seriously affected by both climate change and by water abstraction from the anthropogenic activities. Climate change such as continuous drought will lead to a broad decline in wetland areas in southwest China (Cao et al. Citation2012) and the Yangtze River system (Tian et al. Citation2016). In addition, human-mediated activities such as mismanagement and misuse also subject wetlands to damage and degradation – particularly in regions with low or irregular precipitation – because these areas experience significant conflicts between water use and wetland maintenance (Melendez-Pastor et al. Citation2010). Considering the important benefits of healthy wetland ecosystems, many policies have been created and funded with the intention of protecting or restoring degraded wetlands (An et al. Citation2007), particularly natural wetlands in arid and semi-arid regions that are more vulnerable to low precipitation and high evaporation.
The basis for developing appropriate policies is accurate monitoring and reasonable analysis of wetland changes. With the development of remote sensing technology, methods that allow diagnosis and evaluation of ecological environmental health through remote sensing have been developed (Cao Citation2013). For example, multi-temporal and multi-spectral images have been widely used to monitor wetland changes because they are the advantage of being able to assess spatio-temporal variations in land cover quickly and with high accuracy even in the face of disasters such as droughts (Cao et al. Citation2012) and floods (Hereher Citation2010; Tian et al. Citation2016). Considering the complexity of the composition of wetland ecosystems, much land cover information within a mixed pixel is lost when using traditional per-pixel classification methods from medium-resolution remote sensing images (Schmidt & Schoettker Citation2004; Pignatti et al. Citation2009). Linear spectral unmixing (LSU) can address the problem of mixed pixels. LSU has been widely used for identification, mapping and monitoring changes in wetlands (Schmid et al. Citation2004; Li et al. Citation2005; Schmid et al. Citation2005; Shanmugam et al. Citation2006).
Many studies have been conducted to monitor wetland changes from the perspectives of components and structures, but few studies have focused on simulating and predicting future wetland trends. The CA–Markov model, a combination of cellular automata (CA) and the Markov model, allows simulations of spatio-temporal patterns by integrating the powerful spatial-computing capability of the CA model with the temporal simulation and predictive ability of the Markov model (Sang et al. Citation2011). This model has been applied to landscape ecology for simulating and forecasting changes in land use and land cover (Lee and Chang Citation2011; Sang et al. Citation2011; Zhang et al. Citation2011; Lai et al. Citation2013). Here, the CA–Markov model is used to analyze and forecast wetland degradation.
In this paper, a wetland in Ordos Larus relictus National Nature Reserve was chosen as the study site, because it has high ecological value as the habitat for Relict Gulls (Larus relictus) whose endangered state is negatively impacted by climate change and human activities. The main objective of this study is to monitor wetland degradation in the Ordos Larus relictus National Nature Reserve during the period between 1990 and 2014 by detecting three types of environmental changes based on multi-temporal and multi-spectral remote sensing data. These three elements include soil, vegetation and water and were selected not only because these are basic elements of wetland ecosystem (Cui & Yang Citation2006) but also because the three-element (based on substrate, vegetation and dark surfaces) linear unmixing model provides an excellent first-order representation of the primary triangular mixing space and has previously been widely used in remote sensing and ecology (Small Citation2004; Melendez-Pastor et al. Citation2010). Specially, this paper focuses on two issues in detail: (Equation1(1)
(1) ) mapping the components of the wetland elements (water, soil and vegetation) using the LSU method to assess wetland degradation over time and (Equation2
(2)
(2) ) simulating the land-cover changes of the wetland during previous years and predicting the spatio-temporal wetland degradation for the next 5–100 years using the CA–Markov model.
2. Data and methodology
2.1. Study area
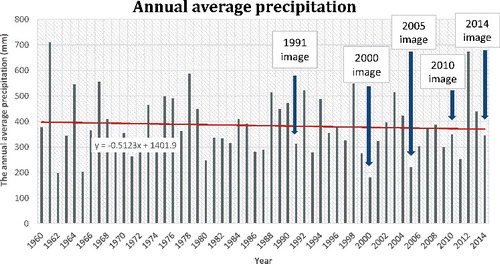
The Ordos Larus relictus National Nature Reserve is located in Ordos City, Inner Mongolia Autonomous Region, China, near the Mu Us Sandy Land at 109°14′–109°23′ E and 39°43′–39°51′ N (). The reserve is situated in the Ordos Plateau, with has an elevation ranging from 1360 to 1520 metres. This natural reserve, with a total area of 147 km2, aims to protect the plateau's inland wetland ecosystem. The core, covering 47.53 km2, includes two main lakes: Bojiang Lake (or Taoli Temple-Alashan Bay Lake) and Houjia Lake. Wetland water is supplied by both local rainfall and seasonal runoff triggered by rainfall within the basin. The reserve has a typical temperate continental climate; the mean annual precipitation is 325.88 mm, and the precipitation in July and August accounts for 65% of the annual precipitation (Liu Citation2009). The mean annual temperature is 5.2 °C, and the annual evaporation is 2501 mm, most of which occurs in spring and summer (Liu et al. Citation2008). According to the local precipitation data collected from the Meteorological Station, the rainfall in the reserve declined from 1960 to 2014, as trend line showed in . In the rainy season, rainfall within the Bojiang Lake basin forms seasonal rivers. The multi-year average annual runoff depth is 16 mm, and the volume is 229.73 × 10⁶ m3 (Xing et al. Citation2009). Groundwater derived from precipitation and lateral runoff in the closed basin (Liang et al. Citation2011) is another water source for Bojiang Lake, accounting for 22% of total recharge from 1996 to 2005. The vegetation consists mainly of Salix cheilophila and Salix psammophila.
Figure 1. Location of the Ordos Larus relictus National Nature Reserve with field survey points in 2014 and random validation points in 2010. Landsat OLI image (acquired on 7 September 2014) provides background image.
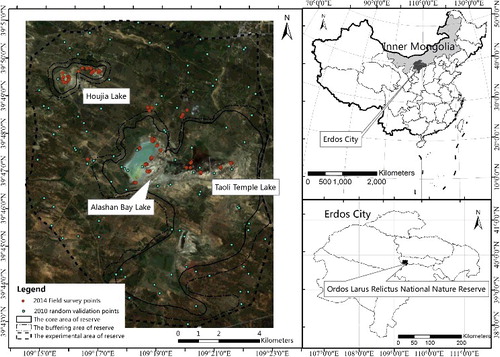
Figure 2. Annual average precipitation histogram of the study area and acquisition dates of Landsat images used in this study.
Because it is located in the Ordos Plateau and the significance and value of this wetland to the Ordos Larus relictus National Nature Reserve, it should be given more attention. This is the only wetland in the semi-arid and arid regions in China included in the Ramsar list of wetlands of global importance.
It is also the sole nature reserve that aims to protect Relict Gulls, one of the species most recently recognized as needing protection (listed in the ‘Convention on International Trade in Endangered Species of Wild Fauna and Flora’ (CITES) and in the ‘Convention on the Conservation of Migratory Species of Wild Animals’ (MSC)) (Liu et al. Citation2008).
2.2. Data
Three types of data were used in this study: remote sensing satellite imagery, field validation data and ancillary data.
To monitor the wetland degradation over the long term, five multispectral Landsat images were selected (as listed in ) by the following principles: (Equation1(1)
(1) ) three images (obtained in 1990, 2000 and 2010) were selected as 10-year interval for long-term detection; (Equation2
(2)
(2) ) all the images satisfy the quality standards (no cloud cover or radiometric problems), or images from an adjacent year were used as alternatives (e.g. the image obtained in 1991 was selected instead of the image from 1990); (Equation3
(3)
(3) ) the image from 2005 was chosen to provide more detailed change information between 2000 and 2010 because, since 2000, the wetland has faced increased threats and environmental changes (He et al. Citation2008; Xing et al. Citation2009); (Equation4
(4)
(4) ) the 2014 image was chosen to determine the recent wetland status. All images were obtained from July to September (the rainy season), when the water level is typically the highest. Radiometric calibration and atmospheric correction were performed using Landsat calibration and the FLAASH module in the ENVI software (version 5.0) (Deng Citation2010). The images were co-registered, and the overall position error was less than 0.5 pixels.
Table 1. Acquisition dates of Landsat images used in the study.
Additionally, a field survey in the Ordos Larus relictus National Nature Reserve was conducted from 16 to 19 June 2014 to collect information to validate the classification results. Making a complete field survey of the entire wetland was hindered by water and bad roads; therefore, 129 sample points were chosen. Of these, 121 sample points were located in the core area of the wetland close to Bojiang Lake and Houjia Lake, and 8 points were located outside the core area (). The sample points were selected to represent three land cover types: 49 points for bare soil, 53 points for vegetation and 27 points for water. The size of all the sample points was defined so they would contain at least one pure pixel from the Landsat imagery (30 m × 30 m). These points were located using a GPS (Trimble Juno SB, whose horizontal error is less than 5 m).
Finally, for the auxiliary data, meteorological data were collected from the Dongsheng Meteorological Station (50 km east of the wetland), which is the closest national meteorological station to the reserve. This station has recorded the annual average precipitation, wind velocity and temperature data since 1961. These data were used to analyze dynamic changes in rainfall. The 30 m spatial resolution Digital Elevation Model (DEM) data were selected, derived from the Advanced Spaceborne Thermal Emission and Reflection Radiometer Global Digital Elevation Model (ASTER GDEM). These images were downloaded from the National Aeronautics and Space Administration (NASA) website (http://asterweb.jpl.nasa.gov/gdem.asp). A slope map was calculated using the 3D Analyst module in ArcGIS (version 10.2). Based on the DEM data, the spatial resolution is also 30 m (Tang & Yang Citation2006). These data were used as parameters to predict the wetland change using IDRISI Selva (version 17.00) software under the CA–Markov module, because elevation and slope determine the water distribution patterns.
2.3. Methodology
2.3.1. Linear spectral unmixing
The LSU method assumes that the spectral reflectance response of a mixed pixel is a linear and weighted combination of the reflectance of all end-members (a pure surface feature) (Adams et al. Citation1995; Magendran & Sanjeevi Citation2014; Zhang et al. Citation2014). The weight, or the proportion of a component, is restricted in that the sum of all the components within a pixel must be 1. The calculation is based on the spectral characteristics of the end-members (Shimabukuro & Smith Citation1991). The combination and restriction can be expressed mathematically by Equationequation (1(1)
(1) ):
(1)
(1)
where Li,j,λ is the radiation reflectance at band λ for the pixel (i, j), for which the column pixel number is i and the line pixel number is j. Here, fij,k is the fraction of end-member k contributing to the image spectrum of the pixel (i, j), n is the total number of end-members, Rk,λ is the spectral reflectance of end-member k at band λ; and ϵi,j is the estimated proportion-associated error for each pixel.
A wetland, which is the transition zone between water and land, provides favourable growing conditions for vegetation. Therefore, water, soil and vegetation are the three main elements of wetlands. The proportional variations in these three elements (soil, water and vegetation) can effectively reflect changes to wetlands (degradation), particularly for wetlands in arid and semi-arid regions (Small Citation2004; Melendez-Pastor et al. Citation2010). Therefore, the linear spectral unmixing (LSU) method was used to classify the images.
In this study, the land-cover fractions of the three primary elements (vegetation, soil and water) in the wetland, normalized from 0 to 1, were calculated using the LSU method. The fractional images could be further transformed to a hard classification map (a land-cover type within a pixel). By comparing the proportions of the three elements within each composite pixel, the element with the highest proportion was chosen as the land-cover type. Hard classification results have advantages for change detection because they easily and directly demonstrate dynamic changes in the three elements through comparisons of the classification results from the study years (1991, 2000, 2005, 2010 and 2014) and by applying grid algebra and statistical methods. The integrated interpretation of the proportional images of the end-members and hard classification maps is a powerful tool for understanding wetland dynamics (Melendez-Pastor et al. Citation2010).
2.3.2. Markov chain and cellular automata
Markov model
A Markov model is based on Markov random process simulation and prediction theories. Markov models have been used widely in geographic studies (Islam & Ahmed Citation2011; Sang et al. Citation2011). In the Markov model, a transition probabilities matrix represents the probability of transitioning from one state to another. In this study, it expresses the likelihood that a pixel of a given class will change to any other class (or remain the same) over the next time interval (Gong et al. Citation2015). Under the assumption that the Markov model has no aftereffects (Li & Cheng Citation2006; Zhang et al. Citation2011), the simulation and prediction of land-cover changes can be calculated by Equationequations (2(2)
(2) )–(Equation4
(4)
(4) ):
(2)
(2)
(3)
(3)
(4)
(4)
where Pi,j is the transition probability of a land cover from type i to type j, and St(n) is the state during the n period.
Given that the national natural reserve would not be subject to a large range of destruction over a short period and that during the study periods (1990–2000 and 2005–2010) no sudden severe human activities such as planting vegetation occurred, the wetland's internal composition was relatively stable and was appropriate for the assumptions required by a Markov chain model.
Cellular automata
A CA model is a spatially dynamic model that has been widely used for land-use and land-cover change studies from temporal and spatial perspectives (Subedi et al. Citation2013). A CA model simulates dynamic processes based on a conceptual assumption that a cell will have a higher probability of changing to land-cover class ‘A’ than of changing to ‘B’ if the cell is closer to ‘A’ (Memarian et al. Citation2012). Thus, the transition rules of the CA model use not only the previous state information (driven by a Markov model) but also the state of neighbouring cells (Adhikari and Southworth Citation2012). Thus, a CA model can add spatial character to a Markov model and make it a dynamic spatial model.
CA–Markov model
In essence, both the Markov and CA models are discrete dynamical models of time and status. The CA model has a powerful ability to simulate dynamic spatio-temporal evolutions of complex spatial systems (Sang et al. Citation2011). The Markov model focuses on the simulation and prediction of the amount of land-cover change, but the spatial characteristics such as spatial distribution obvious (Wickramasuriya et al. Citation2009). Therefore, this study used the CA–Markov model, which is an integrated model that combines the spatial simulation ability of CA model and the temporal prediction ability of the Markov model. This combined model was used to monitor and predict environmental changes in the reserve from both the temporal and the spatial perspectives.
In this study, based on the Markov model and CA theory, environmental changes in the reserve were simulated and predicted using IDRISI Selva (version 17.00) software under the CA–Markov model (Eastman JR Citation2003) according to the following procedures, yielding: (Equation1(1)
(1) ) potential maps of computed land-cover transition based on observed historical changes, (Equation2
(2)
(2) ) computed transition probabilities using the Markov model and (Equation3
(3)
(3) ) spatially allocated simulation land-cover probabilities based on the CA model.
2.3.3. Normalized difference water index
Because the normalized difference water index (NDWI) images made use of reflected near-infrared and green radiation to improve the performance of the water feature while reducing the impact of soil and vegetation, they can better illustrate the distribution of water content (McFeeters Citation1996), as presented by Equationequation (5(5)
(5) ). In this study, NDWI images were also calculated, and through comparing the NDWI results with the water content calculated using LSU, to validate the LSU result.
(5)
(5)
3. Results
3.1. Detecting surface changes
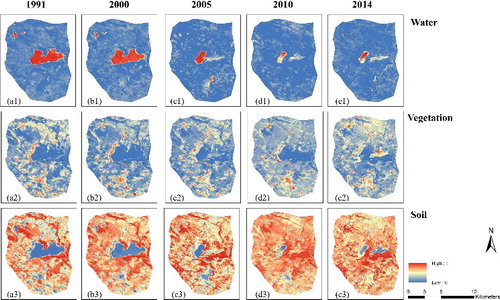
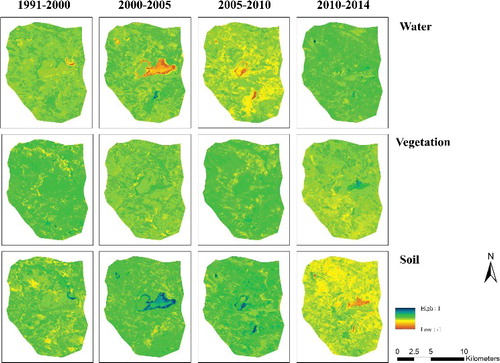
The most dramatic change detected by the LSU method was the decrease in the water component content in the reserve. The change is immediately apparent by observing . Based on the images shown in , the water fraction reduction can be visually observed, on which pixel value closer to 1 (red pixels) indicate a higher component content. In the normalized figures of 1991 and 2000 ((a1) and (b1)), there were many pixels with high values (red pixels) in the water content images, particularly near the central area of the reserve (Bojiang Lake). However, in the figures for 2005, 2010 and 2014 ((c1), (d1) and (e1)), some pixel values in the water content images decreased (became blue), while the soil and vegetation contents increased (became red). The pixel values in the five soil content images are generally high (red), illustrating that soil elements dominated the arid and semi-arid wetland ecosystem in the reserve. The pixel values (brightness) in the five vegetation images show the changes corresponding to irrigated crops in farmland or sandy vegetation such as Salix (Xing et al. Citation2009).
Figure 3. Fraction images for water, vegetation and soil derived from linear spectral unmixing in 1991, 2000, 2005, 2010 and 2014. The colour scale ranges from 0 (blue) to 1 (red). To view this figure in colour, see the online version of the journal.
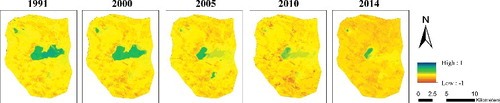
To clearly demonstrate the change of water content, NDWI images for 1991, 2000, 2005, 2010 and 2014 were calculated using Equationequation (5(5)
(5) ). The results are shown in . By comparing the results of NDWI with the water content calculated using LSU, the same change trend – in which water content decreased across the entire reserve – can be clearly detected, particularly the sharp reductions in the Bojiang Lake area. The NDWI result also strengthened the LSU result.
Figure 4. The normalized difference water index (NDWI) images based on Landsat images for 1991, 2000, 2005, 2010 and 2014. The colour scale ranges from −1 (brown) to 1 (blue). To view this figure in colour, see the online version of the journal.
To demonstrate the dynamic changes in the component contents from 1991 to 2014, the content (fractional) change images for water, vegetation and soil were analyzed (). From , the changes in the content of the three elements are clearly visible. The change in water content is immediately obvious; the water content exhibited a continuous reduction from 1991 to 2010 and then a slight increase. During the period from 1991 to 2000, the decrease occurred mainly in the northeast of Bojiang Lake. Then, from 2000 to 2005, a large degradation occurred at the east side of the lake and in Houjia Lake. Between 2005 and 2010, there are some reductions near the centre of Bojiang Lake and with all of Houjia Lake. Finally, from 2010 to 2014, the water content increased in Houjia Lake and in the eastern portion of Bojiang Lake. Although this increase did not expand the water surface area greatly, it still indicates that water content was increasing. The vegetation content of some parts in the northern portion of the reserve increased slightly during 1991–2000, but the most significant changes occurred during 2000–2005. This increase in vegetation content generally continued during 2005–2010, but the increases during this period were not as obvious. From 2010 to 2014, vegetation content generally decreased – but it increased around Bojiang Lake, the vegetation increased. The soil content changes were the opposite of the water content, rising sharply in the centre of the reserve. During 1991–2000, soil content rose in the northeast portion of Bojiang Lake, and increased continuously from 2000 to 2005 and from 2005 to 2010, reflecting the sharp reduction in water content especially in Houjia Lake and east of Bojiang Lake. There was a general reduction in soil content from 2010 to 2014, particularly in Houjia Lake and Bojiang Lake.
Figure 5. The change images of water, vegetation and soil fraction for 1991–2000, 2000–2005, 2005–2010 and 2010–2014 in Ordos Larus relictus National Nature Reserve. The colour scale ranges from −1 (brown) to 1 (blue). To view this figure in colour, see the online version of the journal.
The hard categorical land-cover maps with three classes (water, vegetation and soil) for 1991, 2000, 2005, 2010 and 2014 were produced using the dominant component within the mixed pixels as the land-cover type according to the LSU results ().
Figure 6. The classified land-cover maps of soil, vegetation and water based on the LSU results for 1991, 2000, 2005, 2010 and 2014 in Ordos Larus relictus National Nature Reserve.
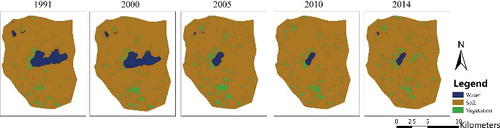
Based on these land-cover maps, the most significant land-cover change from 1991 to 2014 was the disappearance of water. The soil area was the largest component of the three classes in the reserve, and did not show obvious changes, the vegetation coverage area increased significantly in 2005, and then decreased slightly; however, it was still growing compared to the period before 2005.
quantitatively shows the coverage area and changes in the three land-cover types in the reserve in 1991, 2000, 2005, 2010 and 2014. The overall classification accuracy for the 2014 land-cover maps was 85%, based on field survey points. The overall classification accuracy for the 2010 land cover was 87%, validated by 120 random points (selected by creating random points module in ArcGIS software) in image from Google Earth screenshots (obtained on 22 August 2010 with a resolution of 0.6 metres). One hundred and twenty randomly selected points were selected, 2 points for water, 23 for vegetation and 95 for soil (). The error matrix is shown in
Table 2. Surface area of soil, vegetation and water covers in Ordos Larus relictus National Nature Reserve for 1991, 2000, 2005, 2010 and 2014, and magnitude of change during these periods (km2).
Table 3. Three land-cover type classification confusion matrix by LSU classification using 120 ground truth points in 2010.
The water area classification accuracies for 2000 and 2005 were validated by comparing the Bojiang Lake area (9.19 km2 in 2000 and 2.49 km2 in 2005) with research results by Wang et al. (Citation2009), who used remote sensing images (Landsat TM images) to measure the Bojiang Lake's area; their results were 9.03 km2 in 2000 and 2.63 km2 in 2005.
This significant 8.57 km2 decline in the water area (83%) was simultaneously coupled with a significant 2.90 km2 increase in the vegetation coverage area (58%) and a steady increase in the soil coverage area of 5.67 km2 (4%). Therefore, the change in the water area emphasizes the dramatic impacts of droughts and human activities on the reserve. The water surface area continued to decrease rapidly (from 10.31 km2 in 1991 to 1.68 km2 in 2010) but increased slightly in 2014 (to 1.74 km2, an increase of only 0.06 km2 compared with 2010). These changes may be the result of unusually large amounts of rainfall in 2012 (673.1 mm) and 2013 (439.4 mm) that alleviated the water surface reduction trend. The water surface area decreased greatly between 2000 and 2005; 7.00 km2 of water transitioned to other land-cover types, mostly soil (shown in ).
Table 4. Land-cover types area transition matrix during 1991–2014 in Ordos Larus relictus National Nature Reserve (km2 (percentage)/23 years).
Meanwhile, the change in the soil area indicated how drought affected the reserve. Soil area had steadily increased by 5.67 km2 since 1991, but suddenly increased to 3.39 km2 in 2000–2005. The vegetation area showed a significant upward trend since 1991 (from 4.99 km2 in 1991 to 7.88 km2 in 2014). Then, between 2000 and 2005, a significant increase of approximately 3.61 km2 occurred due to extensive planting of vegetation.
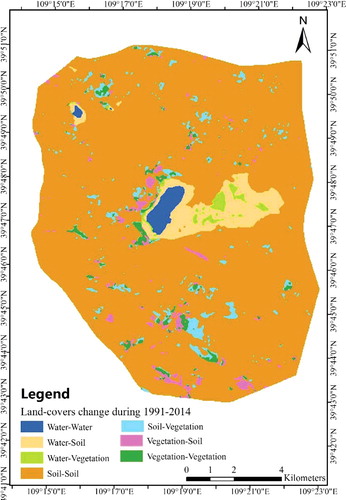
The land-cover type transition matrix from 1991 to 2014 shown in was used to analyze the change in environmental dynamics from 1991 to 2014. During this period, 7.36 km2 (71%) of the water area was converted into soil, while only 1.21 km2 (12%) was converted to vegetation. None of the vegetation and soil areas was converted into water between 1991 and 2014. As the dominant land-cover type, 127.52 km2 (96%) of the soil area remained unchanged, while 4.66 km2 (4%) was converted into vegetation. Meanwhile, the mutual transformations between vegetation and soil included the following: 4.66 km2 (4%) of soil area was converted into vegetation; 2.97 km2 (60%) of the vegetation was converted into soil. The land-cover type change dynamics map from 1991 to 2014 is shown in . The most significant change was the conversion of water to soil and vegetation, especially around Bojiang Lake, which is a clear indication of wetland degradation. In addition, mutual changes between vegetation and soil occurred in the west and south of the reserve; in the north, considerable soil was converted to vegetation. However, no changes from vegetation or soil to water occurred at the reserve during the study period.
Figure 7. Spatial distribution of land-cover type dynamic change between 1991 and 2014 in Ordos Larus relictus National Nature Reserve.
3.2. Prediction
Land-cover prediction map for 2005 based on maps for 1991 and 2000
The extensive environment changes were demonstrated by comparing the predicted land-cover map in 2005 with the hard categorical land-cover map.
According to Markov model theory, the predicted land-cover map in 2005 ((a)) was based on the observed changes in the land-cover types, given the impacts of climate and human impacts on the reserve from 1991 to 2000. The predicted land-cover map in 2005 indicated that the water area would be 9.30 km2. This result was verified using the ground truth classification land-cover map from 2005 by comparing it to the predicted map using the accuracy values of the normal kappa coefficient (Kno), location kappa coefficient (Klocation) and standard kappa coefficient (Kstandard) (shown in ). After masking the water change area, the verification accuracy of the predicted land-cover map was greatly improved; the results reflected that the dramatic change in the water from 2000 to 2005 occurred because of an abnormal climate or from excessive human activities.
Predicted land-cover maps after 2014 based on maps in 2005 and 2010
Figure 8. Predicted land-cover maps by the CA-Markov model for 2005 (a), 2020 (b), 2050 (c) and 2100 (d) in Ordos Larus relictus National Nature Reserve.
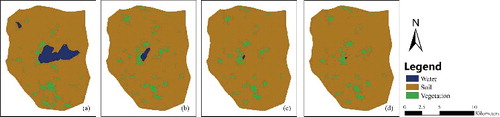
Table 5. The verification accuracies of predicted land-cover map and predicted map mask of water body change area using classification land-cover maps for 2005 in Ordos Larus relictus National Nature Reserve.
Because of the drought and human activities from 2000 to 2005, the reserve dramatically changed in terms of the three land-cover types, particularly water. The extremely heavy precipitation from 2012 to 2013 (the mean annual precipitation was 556.25 mm, which is much higher than the precipitation from 1960 to 2014 with 384.00 mm) was unusual; therefore, the land-cover type changes matrix from 2005 to 2010 was chosen to predict future land-cover maps.
First, the land-cover map in 2014 was predicted by taking the land-cover map in 2010 as an initial condition and verifying the prediction model accuracy against the ground truth classification map in 2014. The accuracies were: Kno = 0.93, Klocation = 0.88, Kstandard = 0.86, showing that the model accuracy was high enough to be used for additional predictions.
According to the predicted land-cover maps using the CA–Markov model, if the climate and wetland change characteristics in the reserve from 2005 to 2010 persist, the water surface area would continue to decrease. In 10 years, the water area would be reduced by half and would become less than 0.1 km2 in another 35 years. The land-cover type area predicted using the CA–Markov model would essentially reach a steady state in the reserve in 100 years, but the water area would decrease from 1.74 to 0.01 km2, with a concomitant increase in soil area from 137.85 to 141.18 km2 and a slight reduction in the vegetation area from 7.88 to 6.12 km2 in the relatively stable state ().
Table 6. Land cover types area predicted by using the CA–Markov model (from 2020 to 2100) and stable state in Ordos Larus relictus National Nature Reserve (unit: km2).
4. Discussion
4.1. Driving factors from climate change
As a self-enclosed wetland ecosystem located in an arid to semi-arid region, precipitation and natural seasonal runoff derived from rainfall within the basin area are the main water sources for the wetland (Xing et al Citation2009). A review of regional annual rainfall from 1960 to the present showed a decrease in precipitation in this area ().
Figure 9. The mean annual precipitation in the Ordos Larus relictus National Nature Reserve from 1960 to 2014 (including all study periods), trend line of precipitation and acquisition dates of Landsat images.
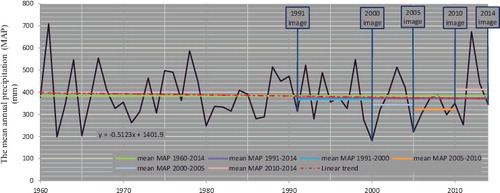
A quantitative description shows that the mean annual precipitation from 1960 to 2014 was 384.00 mm, while the mean value from 1991 to 2014 decreased by nearly 10 mm (373.54 mm). This reflects the general trend of rainfall reduction over the past 20 years. From 1991 to 2014, the mean annual precipitation has a trend that first declined and then rose. From 1991 to 2000, the mean annual precipitation was 366.63 mm, while the mean value during 2000–2005 declined nearly 24 mm (342.87 mm). The value dropped again by nearly 20 mm from 2005 to 2010 (322.15 mm), making that period the driest to date. Consequently, it is clear that climate change is one of the most important causes of wetland degradation over the long term.
However, from 2010 to 2014, the mean annual precipitation was 411.94 mm – far greater than the mean precipitation from 1960 to 2014. The reserve benefited from this unusually large amount of precipitation during 2012–2013; the water area reduction was alleviated and the water area even increased slightly in 2014. Unfortunately, such extremely high precipitation is unusual.
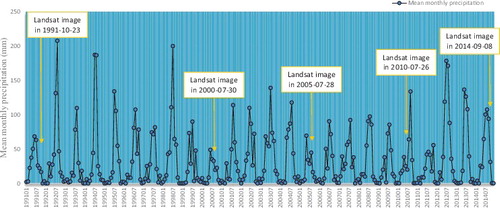
The mean monthly precipitation data from 1991 to 2014 were analyzed and are shown in . The figure shows that the five remote sensing images used in this study were taken during the period of maximum precipitation, to ensure that the water in the reserve was plentiful. Overall, the precipitation exhibits a sustained reduction trend from 1991 to 2010, with a sharp increase after 2010. The precipitation was high from 1991 to 2000, in which the maximum monthly precipitation in 1991, 1994 and 1998 was nearly 200 mm. In contrast, during 2000–2005, precipitation generally decreased, and the maximum monthly precipitation in these 5 years never exceeded 150 mm, especially in 2000 and in 2005, in which the maximum monthly precipitation was only approximately 50 mm. Then, during 2005–2010, the precipitation remained lower than in other study periods; the maximum mean monthly average precipitation did not exceed 100 mm except in 2010; while precipitation increased and was higher than other periods during 2010–2014. Every year during that period contained more than 3 months with a maximum precipitation higher than 100 mm except 2011. This extended period of heavy rainfall was undoubtedly beneficial for the wetland's water storage.
Figure 10. The mean monthly precipitation in the Ordos Larus relictus National Nature Reserve from 1991 to 2014, and acquisition dates of Landsat images used in this study.
4.2. Driving factors from human-mediated activities
According to social and economic statistics, the Dongsheng District of Ordos, which is located in the catchment of Bojiang Lake basin approximately 50 km from the reserve, experienced extensive urbanization. From 1991 to 2013, the population increased from 145,100 to 268,908 (an increase of 85%), while the GDP rapidly increased from 0.47 billion to 88.03 billion RMB (Inner Mongolia Statistics Bureau (Citation1992) and Inner Mongolia Statistics Bureau (Citation2014)). Built-up areas also increased from 14 to 78 km2 (a growth of 457%) (National Bureau of Statistics of China (Citation1992) and National Bureau of Statistics of China (Citation2014)). The growth in population, GDP and built-up areas increased the stress on the water resources in this region and increased the long-term consumption of groundwater.
Considering that the previous drought lasted from 2000 to 2010, the main cause for the sharp reduction in the water area in the reserve from 2000 to 2005 may be human activities. Since 2000, humans have planted abundant vegetation such as Poplar and Salix to prevent desertification in the Ordos Larus relictus National Nature Reserve, which is near the Mu Us Sandy Land (Xing et al. Citation2009). The vegetation area increased dramatically from 2000 to 2005. However, the planted vegetation also increased wetland water consumption because of the depleted state of the groundwater, and it hindered the runoff from seasonal rivers.
Many studies (Xing et al. Citation2009; Liang & Wang Citation2010; Liang et al. Citation2011) have focused on the effects of human activities on the water balance of the Bojiang Lake Basin catchment, which has a total area of 665.8 km2 and vitally affects water resource in the reserve. Over the catchment area, three land-cover types (water, soil and irrigated land) changed dramatically (by more than 1 km2) from 1999 to 2005, and the area of other land-cover types remained mostly constant (Liang et al. Citation2011). Irrigated lands, mainly corn, were developed after 2003. Irrigated land both consumes water and loses it through evaporation from corn and other crops; thus, the water consumption of irrigated land is three times greater than the normal vegetated land in the same area. From 2002 to 2005, the increase in water consumption due to irrigated land was more than 3.78 × 10⁶ m3. Since 2002, grazing on enclosed vegetation has been forbidden in Ordos City to prevent desertification. Excessively lush vegetation may impede as much as 2.40 × 10⁶ m3 of runoff.
During 2002–2005, hydraulic engineering was implemented in the catchment, including six projects that cut off underground streams and seven wells (small reservoirs). These hydraulic engineering projects concentrated the shallow water and improved the water levels, resulting in an increase in evaporation. The total water consumption of the engineering projects was 0.09 × 10⁶ m3. Since 2000, water-retaining projects such as dams resulted in a significant reduction in surface runoff, seasonal rivers and surface runoff. This runoff loss amounts to 1.74 × 10⁶ m3. Artificial mining is another reason for the loss of wetland water and is responsible for nearly 30% of the water loss in Bojiang Lake (Liang et al. Citation2011). Furthermore, frequent human visits and tourism also negatively influence and harm wetland ecology. Tourism in the reserve should not exceed 96,200 (visitors/year) for sustainable development (Feng Citation2006); however, by 2003, tourism figures were already over 260,000 visitors per year (Zhang et al. Citation2009).
5. Conclusion
The wetland in the Ordos Larus relictus National Nature Reserve has experienced degradation attributable to both drought and human activities. Based on medium-resolution multi-spectral remote sensing (Landsat TM) images obtained in 1991, 2000, 2005, 2010 and 2014, the changes in the three primary elements of wetlands (water, vegetation and soil) were assessed. The LSU method was used to obtain the content of these three elements and to analyze their changes over the past 20 years. The results accurately reflect that the water content in the reserve has continuously decreased, while vegetation and soil content have increased. Land-cover maps calculated from the component contents quantitatively show the changes in the land-cover types during each of the five study periods.
Future changes in the wetland environment of the reserve were simulated and predicted using a CA–Markov model. The land-cover map of 2005 was predicted based on the land-cover maps of 1991 and 2000 and compared to the classified ground truth land-cover map from 2005. The wetland changes, particularly the significant reduction in water area during 2000–2005, are likely due to extensive human-mediated activities and abnormal climate conditions. Using the same CA–Markov model, and the land-cover changes from 2005 to 2010, based on a starting classified land-cover map of 2014, wetland land-cover type maps for the next 5–100 years were predicted. The results show that, under the current climatic conditions, the water area in the reserve will continue to diminish, shrinking to less than 0.1 km2 over the next 35 years. The wetland will be continuous degradation, unless long-lasting heavy rainfall occurs or water is artificially supplied to the reserve.
Acknowledgements
This paper was supported by the National High Technology Research and Development Programme of China (863 Program) (Grant no. 2013AA12A302); Comprehensive Survey of China Marshes Wetland Resource and Ecological and Environmental Benefits (Grant no. 2013FY111800); Special Fund for Forest Scientific Research in the Public Welfare (Grant no. 201504323); evaluation of wetland ecosystem funded by the State Forestry Administration of the People's Republic of China.
Disclosure statement
No potential conflict of interest was reported by the authors.
Additional information
Funding
Related Research Data
References
- Adams JB, Sabol DE, Kapos V, Almeida Filho R, Roberts DA, Smith MO, Gillespie AR. 1995. Classification of multispectral images based on fractions of endmembers: application to land-cover change in the Brazilian Amazon. Remote Sens Environ. 52:137–154.
- Adhikari S, Southworth J. 2012. Simulating forest cover changes of Bannerghatta National Park based on a CA-Markov model: a remote sensing approach. Remote Sens-Basel. 4:3215–3243.
- An S, Li H, Guan B, Zhou C, Wang Z, Deng Z, Zhi Y, Liu Y, Xu C, Fang S. 2007. China's natural wetlands: past problems, current status, and future challenges. AMBIO: JHum Environ. 36:335–342.
- Bolund P, Hunhammar S. 1999. Ecosystem services in urban areas. Ecol Econ. 29:293–301.
- Cao C. 2013. Diagnosis of environmental health by remote sensing. Beijing: Science Press. Chinese.
- Cao C, Zhao J, Gong P, Ma G, Bao D, Tian K, Tian R, Niu Z, Zhang H, Xu M. 2012. Wetland changes and droughts in southwestern China. Geomat Nat Haz Risk. 3:79–95.
- Cui B, Yang Z. 2006. Wetland science. Beijing: Beijng Normal University Publishing Press. Chinese.
- Cyranoski D. 2009. Putting China's wetlands on the map. Nature. 458:134.
- Davidson NC. 2014. How much wetland has the world lost? Long-term and recent trends in global wetland area. Mar Freshwater Res. 65:934–941.
- Deng S. 2010. Remote sensing image processing method using ENVI. Beijing: Science Press. Chinese.
- Eastman JR. 2003. IDRISI Kilimanjaro: guide to GIS and image processing. Worcester (MA): Clark Labs, Clark University.
- Feng Y. 2006. Study on the ecological safety and development model of tourism resources in arid and semi-arid region [dissertation]. Shanghai (China): Shanghai Normal University. Chinese.
- Gong W, Yuan L, Fan W, Stott P. 2015. Analysis and simulation of land use spatial pattern in Harbin prefecture based on trajectories and cellular automata—Markov modelling. Int J Appl Earth Obs. 34:207–216.
- Guo H, Wu D, Zhu H. 1990. Land restoration in China. Acta Ecol Sin. 10:24–26. Chinese.
- Halabisky M, Moskal LM, Hall SA. 2011. Object-based classification of semi-arid wetlands. J Appl Remote Sens. 5: 053511–053513.
- He F, Xing X, Bai Z, Ren Y. 2008. Factor threatening wetlands and sustainable use of water resources in the Ordos Plateau. Wetland Sci Manage. 4:56–58. Chinese.
- Hereher ME. 2010. Vulnerability of the Nile Delta to sea level rise: an assessment using remote sensing. Geomat Nat Haz Risk. 1:315–321.
- Inner Mongolia Statistics Bureau. 1992. Inner Mongolia Statistical Yearbook. Beijing: China Statistics Press. Chinese.
- Inner Mongolia Statistics Bureau. 2014. Inner Mongolia Statistical Yearbook. Beijing: China Statistics Press. Chinese.
- Islam MS, Ahmed R. 2011. Land use change prediction in Dhaka city using GIS aided Markov chain modeling. J Life Earth Sci. 6:81–89.
- Lai T, Dragićević S, Schmidt M. 2013. Integration of multicriteria evaluation and cellular automata methods for landslide simulation modelling. Geomat Nat Haz Risk. 4:355–375.
- Lee Y, Chang H. 2011. The simulation of land use change by using CA-Markov model: a case study of Tainan City, Taiwan. Proceedings of the 2011 19th International Conference on Geoinformatics; 2011; Shanghai (China): IEEE.
- Lehner B, Döll P. 2004. Development and validation of a global database of lakes, reservoirs and wetlands. J Hydrol. 296:1–22.
- Li L, Ustin S, Lay M. 2005. Application of multiple endmember spectral mixture analysis (MESMA) to AVIRIS imagery for coastal salt marsh mapping: a case study in China Camp, CA, USA. Int J Remote Sens. 26:5193–5207.
- Li S, Cheng Y. 2006. A hidden Markov model-based forecasting model for fuzzy time series. WSEAS T Syst. 5:1919–1924.
- Liang K, Lou H, Cheng C. 2011. Characteristics of groundwater flow in the Ordos Larus relictus Reserve wetland. Res Sci. 33:1089–1098. Chinese.
- Liang L, Wang F. 2010. Simulation of water resources evolution driven by vegetation construction and control of eco-hydrological processes in Ordos Larus relictus Nature Reserve. Acta Ecol Sin. 30:109–119. Chinese.
- Liu W. 2009. Protection and study on the breeding and habitat of Larus relictus in the salt marsh wetland, Ordos Plateau [dissertation]. Hohhot (China): Inner Mongolia Agricultural University. Chinese.
- Liu W, Zhang L, Xing X, Bao X, Su Y, Bai Z, Ren Y, Gao R. 2008. The relationship between the zoobenthos and Larus relictus’ foraging behavior in saline-alkaline wetland of Ordos Plateau. J Arid Land Resour Environ. 22:185–192. Chinese.
- Magendran T, Sanjeevi S. 2014. Hyperion image analysis and linear spectral unmixing to evaluate the grades of iron ores in parts of Noamundi, Eastern India. Int J Appl Earth Obs. 26:413–426.
- Max Finlayson C. 2012. Forty years of wetland conservation and wise use. Aquat Conserv. 22:139–143.
- McFeeters SK. 1996. The use of the Normalized Difference Water Index (NDWI) in the delineation of open water features. Int J Remote Sens. 17:1425–1432.
- Melendez-Pastor I, Navarro-Pedreño J, Gómez I, Koch M. 2010. Detecting drought induced environmental changes in a Mediterranean wetland by remote sensing. Appl Geogr. 30:254–262.
- Memarian H, Balasundram SK, Talib JB, Sung CTB, Sood AM, Abbaspour K. 2012. Validation of CA-Markov for simulation of land use and cover change in the Langat Basin, Malaysia. J Geogr Inf Syst. 4:542–544.
- National Bureau of Statistics of China. 1992. China City Statistical Yearbook. . Beijing: China Statistics Press. Chinese.
- National Bureau of Statistics of China. 2014. China City Statistical Yearbook. Beijing: China Statistics Press. Chinese.
- Pignatti S, Cavalli RM, Cuomo V, Fusilli L, Pascucci S, Poscolieri M, Santini F. 2009. Evaluating hyperion capability for land cover mapping in a fragmented ecosystem: Pollino National Park, Italy. Remote Sens Environ. 113:622–634.
- RAMSAR. 2007. What are wetlands? In: The RAMSAR convention of wetlands information paper no. 1. Available from: http://www.ramsar.org.
- Ren H, Shen WJ, Lu HF, Wen XY, Jian SG. 2007. Degraded ecosystems in China: status, causes, and restoration efforts. Landscape and Ecological Engineering. 3:1–13.
- Sang L, Zhang C, Yang J, Zhu D, Yun W. 2011. Simulation of land use spatial pattern of towns and villages based on CA–Markov model. Math Comput Model. 54:938–943.
- Schmid T, Koch M, Gumuzzio J. 2005. Multisensor approach to determine changes of wetland characteristics in semiarid environments (Central Spain). IEEE T Geosci Remote. 43:2516–2525.
- Schmid T, Koch M, Gumuzzio J, Mather P. 2004. A spectral library for a semi-arid wetland and its application to studies of wetland degradation using hyperspectral and multispectral data. Int J Remote Sens. 25:2485–2496.
- Schmidt M, Schoettker B. 2004. Sub-pixel analysis in combination with knowledge based decision rules to optimise a land cover classification. In: Goossens R, editor. Remote sensing in transition. Rotterdam: Millpress; p. 53–59.
- Shanmugam P, Ahn YH, Sanjeevi S. 2006. A comparison of the classification of wetland characteristics by linear spectral mixture modelling and traditional hard classifiers on multispectral remotely sensed imagery in southern India. Ecological Modelling. 194:379–394.
- Shimabukuro YE, Smith A. 1991. The least-squares mixing models to generate fraction images derived from remote sensing multispectral data. IEEE T Geosci Remote. 29:16–20.
- Small C. 2004. The Landsat ETM+ spectral mixing space. Remote Sens Environ. 93:1–17.
- Subedi P, Subedi K, Thapa B. 2013. Application of a Hybrid cellular automaton–Markov (CA-Markov) model in land-use change prediction: a case study of Saddle Creek Drainage Basin, Florida. Appl Ecol Environ Sci. 1:126–132.
- Tang G, Yang X. 2006. GIS spatial analysis experimental course using ArcGIS. Beijing: Science Press. Chinese.
- Tian R, Cao C, Peng L, Ma G, Bao D, Guo J, Yomwan P. 2016. The use of HJ-1A/B satellite data to detect changes in the size of wetlands in response in to a sudden turn from drought to flood in the middle and lower reaches of the Yangtze River system in China. Geomatics, Natural Hazards and Risk. 7:287–307.
- Wang F, Liang L, Zhang Y, Gao R. 2009. Eco-hydrological model and critical conditions of hydrology of the wetland of Ordos Larus relictus Nature Reserve. Acta Ecol Sin. 29:307–313.
- Wickramasuriya RC, Bregt AK, Van Delden H, Hagen-Zanker A. 2009. The dynamics of shifting cultivation captured in an extended constrained cellular automata land use model. Ecol Model. 220:2302–2309.
- Xing X, Yu X, Bai Z, Jia L. 2009. Analysis of water balance of the wetland in Ordos Larus Relictus Nature Reserve. J Arid Land Res Environ. 23:100–103. Chinese.
- Zedler JB, Kercher S. 2005. Wetland resources: status, trends, ecosystem services, and restorability. Annu Rev Environ Resour. 30:39–74.
- Zhang R, Tang C, Ma S, Yuan H, Gao L, Fan W. 2011. Using Markov chains to analyze changes in wetland trends in arid Yinchuan Plain, China. Math Comput Model. 54:924–930.
- Zhang X, Shang K, Cen Y, Shuai T, Sun Y. 2014. Estimating ecological indicators of karst rocky desertification by linear spectral unmixing method. Int J Appl Earth Obs. 31:86–94.
- Zhang Z, Jia T, Feng Y. 2009. Study on impacts of tourism development to ecological environment of Ordos Relict Gull Reserve. Res Dev Market. 25:340–341. Chinese.