
 ?Mathematical formulae have been encoded as MathML and are displayed in this HTML version using MathJax in order to improve their display. Uncheck the box to turn MathJax off. This feature requires Javascript. Click on a formula to zoom.
ABSTRACT
The aim of this study is to build a flood simulation model for the city of Hafr Al-Batin catchment area. The model consists of a hydrologic model, a hydraulic model and pre- and post-processing tools. A geographic information system-based modelling interface was used to pre-process the terrain and rainfall data and generate input files for hydrologic and hydraulic models. Soil map data, land cover map, land use map and digital elevation model was used to delineate the physical watershed's characteristics. The runoff estimation was based on the widely known Soil Conservation Service curve number approach. The hydrologic/hydraulic model simulations simulated the runoff hydrograph corresponding to different design storms and helped to delineate the resulting flood inundation maps. The results indicate good agreement between the delineated inundation map and the hazard map developed by the municipality. They also show that the location of the city complicates the runoff response for small storms creating two distinct peaks. The results of this study can be utilized for planning purposes and in the design of flood control structures as the study has estimated the runoff corresponding to different design storms and used hydraulics and geospatial data in delineating the flood zones.
KEYWORDS:
| Abbreviations |
The following abbreviations are used in this manuscript:
| A | = | watershed area |
| D | = | time interval |
| CFSR | = | Climate Forecast System Reanalysis |
| CN | = | curve number |
| DEM | = | digital elevation model |
| DEMs | = | digital elevation models |
| GDMS | = | Saudi General Directorate of Military Survey |
| GIS | = | geographic information system |
| HEC | = | Hydrologic Engineering Center |
| HEC-HMS | = | HEC hydrologic modeling system |
| HEC-RAS | = | HEC river analysis system |
| I | = | inflow |
| K | = | parameter depending on the channel and flow characteristics |
| L | = | hydraulic length of the watershed |
| MOWE | = | Saudi Ministry of Water and Electricity |
| NCEP | = | National Centers for Environmental Prediction |
| NRCS | = | Natural Resources Conservation Service |
| O | = | outflow |
| P | = | total precipitation |
| Pe | = | effective precipitation (precipitation that is transformed to runoff) |
| Qp | = | peak flow of the unit hydrograph |
| S | = | maximum potential for soil retention |
| SCS | = | Soil Conservation Service |
| t | = | time |
| tl | = | lag time between the centre of mass of excess rainfall and the peak of the unit hydrograph |
| tp | = | time to peak of the unit hydrograph |
| WMS | = | watershed modeling system |
| X | = | parameter depending on the channel and flow characteristics |
| Y | = | average watershed land slope |
Introduction
Floods can be defined as high water flow, which exceeds the capacity of natural or artificial banks of the stream. Excessive rain, precipitation duration, snow melt, stream overflowing channels, inadequate drainage systems and the saturation of the soil are the main causes of floods. There are several flood types, such as urban floods, flash floods, coastal floods and river floods. In arid and semi-arid regions, rainfall usually comes for short durations but with high intensity (Pilgrim et al. Citation1988; Wheater et al. Citation1991; Lázaro et al. Citation2001).
Flooding caused by storm events becomes a major concern in many parts of the world (Horritt & Bates Citation2002; K.S. Lee & S.I. Lee Citation2003; WMO Citation2003). According to the statistics of the International Disaster Database, floods have the greatest damage potential of all natural disasters worldwide and affect the greatest number of people (IDD Citation2015). Doocy et al. (Citation2013) estimated the deaths due to floods worldwide between 1980 and 2009 to be about 539,881.
With more extreme weather patterns predicted in the future, more frequent floods are expected to occur. Although no work could offer a full protection from floods, this does not conflict with the fact that flood modelling gains its importance since it gives a vision of the risk that might threaten lives and properties and gives a clear view for the protection of hydraulic structures which must be constructed.
In the Kingdom of Saudi Arabia, the most frequent natural hazard occurring event is due to flood. summarizes the natural disasters that occurred in Saudi Arabia during the past 15 years (2000–2015). The table indicates that floods have been the most frequently encountered natural disasters in the country (IDD Citation2015). It has been estimated that the frequency of flood occurrences in Saudi Arabia will be on an average of seven times per year. The risk of flooding in Saudi Arabia is expected to increase in the future due to urbanization, climate change and expansion of cities without proper planning. Recently, extreme floods occurred in major cities in the Kingdom of Saudi Arabia. For example, in 2009, a flood event occurred in Jeddah causing catastrophic consequences, which resulted in 161 deaths and damaged approximately 8000 homes and more than 7000 vehicles (Abosuliman et al. Citation2014).
Table 1. Natural disasters that occurred in Saudi Arabia from 2000 to 2015 (IDD Citation2015).
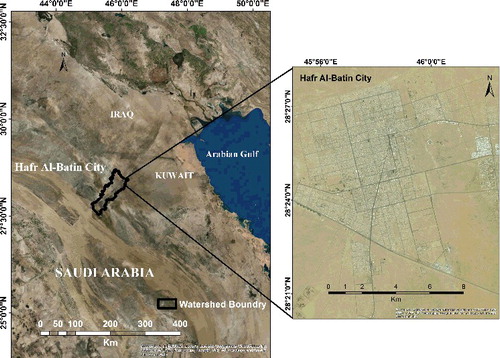
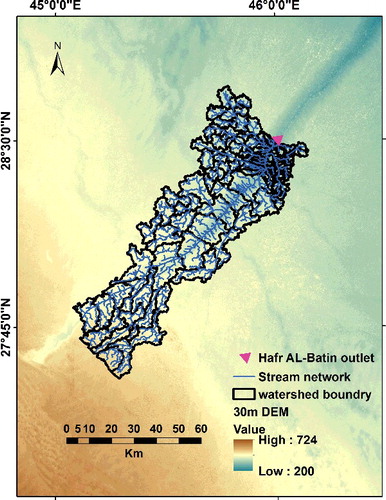
There is a need to conduct studies on the flooding potential in rapidly urbanizing cities in Saudi Arabia, such as the city of Hafr Al-Batin with a population of more than 300,000. Hafr Al-Batin is located in the north-eastern region, 480 km north of Riyadh, 90 km from the Kuwaiti border and about 70 km from the Iraqi border. Historically, the city survived on the shallow groundwater fed by Wadi Al-Batin intermittent stream. Wadi Al-Batin is part of the much larger, now-dry, Wadi Al-Rimmah. Extending across north-eastern Saudi Arabia, Kuwait and south-eastern Iraq, the Rimmah-Batin Wadi is the longest wadi system in the Arabian Peninsula (Edgell Citation1997). Wadi Al-Batin and Wadi Al-Rimmah were connected during the Quaternary wetter phases (until about 5500 years ago), forming a major river system in the region (El-Baz Citation2010). Wadi Al-Batin is highly carved, indicating the prevalence of a very rainy period at that time (McClure Citation1978). shows the location of Hafr Al-Batin. The city of Hafr Al-Batin is located in an area where two other smaller wadis join Wadi Al-Batin, making the city under high risk of flood, especially when intense short-duration rainstorms occur as the case in arid and semi-arid regions. In 2009, an extreme flood occurred as a result of intense and sudden rainfall, which caused flood water to flow from all wadis towards the city, causing serious damage to public and private properties. Therefore, it is necessary to develop a hydrologic/hydraulic model for the city of Hafr Al-Batin that can be used as a tool by city planners to identify appropriate actions that can be done to minimize the impact of the flood as well as to warn people in advance in case of severe storm events.
Figure 1. Hafr Al-Batin catchment area.
Recently, flood forecasting has greatly improved with the rapid advancement in technology. The availability of high speed computers and high performance software packages provides engineers with an excellent tool to perform flood modelling and simulation. Also, advancement in geographic information system (GIS) and availability of high-resolution digital elevation models (DEMs) and radar-based models have great improvement in flood modelling. Integration between GIS software and hydrologic/hydraulic models can aid engineers and planners in investigating the risk of floods and presenting the results in a suitable format. The GIS has the ability to capture, store, manipulate, analyse and visualize the diverse sets of geo-referenced data (McDonnell Citation1996; Noman et al. Citation2001). The hydraulic model, on the other hand, which is based on the physical representation of the natural phenomena, has the ability to simulate the dynamic behaviour of flow in the channel which can be used as input for GIS to generate flood maps.
The aim of this study is to develop a flood simulation model for the city of Hafr Al-Batin catchment area that can be used to understand the flood hazard it faces, especially in light of the rapid urbanization it is witnessing. Three ephemeral streams (wadis) meet in the city. The city represents about 5% of the area of the delineated catchment. Design storms for the catchments were constructed from reanalysis rainfall data. The model will provide estimates of the predicted runoff from areas and wadis surrounding the city and delineate the flood zones corresponding to design storms. The flood simulation and analysis developed in this study can help to provide relevant information that can guide future expansion of the city and flood protection measures.
Study area
A portion of Wadi Al-Batin catchment that encompasses the city of Hafr Al-Batin was selected for this study, with a drainage area of 1669 km2 and an outlet just outside the city.as shown in . The residential area of the city of Hafr Al-Batin represents about 4% of the delineated catchment. Three main ephemeral streams are distinguished in Hafr Al-Batin city. The main stream is Al-Batin stream, which runs from south-east to north-west. The second stream is the North Fleaj stream which runs from north to south, and the third stream is the South Fleaj stream which runs from south to north. These three streams are characterized with alluvial channels ranging in width from 3 to 10 km. The outlet elevation is approximately 200 m above sea level, while the highest point of the delineated catchment is located at an elevation of 640 m. The dominant soil type is a combination of sand and gravel with weathered and fractured sandstone and limestone and permeable sediments over the alluvial fans of wadis.
Rainfall frequency analysis
Rainfall is the primary input in the hydrologic model, but in arid and semi-arid regions, rainfall is characterized by high temporal and spatial variability with short and intense rainfall bursts causing localized flash flooding. Due to scarcity of rainfall, many cities in these regions lack typical flood control hydrologic and hydraulic structures, which further exacerbates the impacts of these rare flood events. Moreover, the lack of records of high quality rainfall data in some of these regions does not allow the use of standard statistical techniques for estimating frequency storms needed for the design of flood control structures.
Saudi Arabia is among the driest countries in the world (Köppen Citation1936). Two regions of the country have the highest annual rainfall: the south-western region and the north-western region, including Hafr Al-Batin (Hasanean & Almazroui Citation2015). The average annual rainfall over the country ranges between 5 and 230 mm with Hafr Al-Batin receiving an average of about 125 mm. There is no detailed high-quality rainfall data for Hafr Al-Batin. The Saudi Ministry of Water and Electricity (MOWE) operates a rain gauge (EP 107) in Hafr Al-Batin. There is a lot of missing data in EP 107 records, including daily rainfall data – no data for the years 2006 and 2007. The Saudi Presidency of Meteorology and Environment operates a rain gauge in the catchment that suffers from similar deficiencies. Another challenge regarding rainfall data is the relatively large size of the catchment (1669 km2), which makes it difficult to justify the use of information from a single rain gauge to perform flood frequency analysis over the catchment. For these reasons, it was decided to use rainfall data estimated by the National Centers for Environmental Prediction Climate Forecast System Reanalysis (CFSR) project for the grid that includes the entire catchment after performing homogeneity tests to ensure agreement with the rain gauge data. The CFSR rainfall data is based on data assimilation techniques of rain gauge and satellite data and atmospheric model results (Saha et al. Citation2010). CFSR products were used in several hydrologic modelling studies, and the results demonstrated the high quality of the data and good agreement with ground observations (e.g. (Najafi et al Citation2012; Wei et al Citation2013; Dile & Srinivasan Citation2014). Homogeneity of mean and variance between the MOWE station and CFSR grid was tested using the t-test and F-test. The two tests failed to reject the null hypothesis that the means and variances of the two samples are equal.
The maximum recorded annual daily rainfall for Wadi Al-Batin CFSR grid is shown in . Based on this data, the Log-Pearson Type III distribution (LPT III) (Chow Citation1951) was used to estimate the frequency of the daily rainfall over the catchment. LPT III requires computing logarithms of the data, then estimating the mean, standard deviation and skewness coefficient of these logarithms. The skewness coefficient is used to estimate K coefficients for different return periods that are used together with the means and standard deviations to estimate frequency rainfall values. shows the frequency distribution of the CFSR grid rainfall data as it is fitted to the LPT III distribution. The LPT III estimated maximum daily rainfall values for the return periods between 2 and 500 years are shown in
Figure 2. Maximum annual daily rainfall for Wadi Al-Batin.
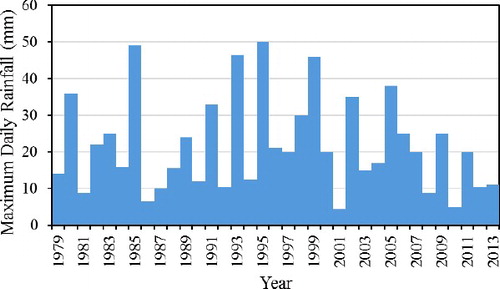
Figure 3. Fitted Log-Pearson III distribution.
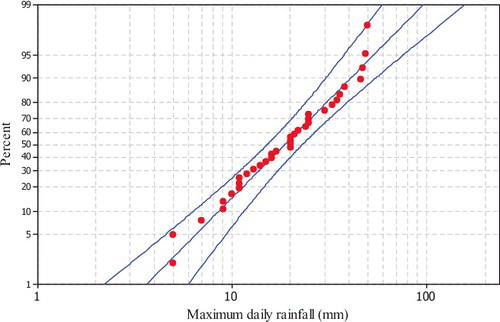
Table 2. Maximum daily rainfall (mm) for different return periods for Wadi Al-Batin.
Methodology
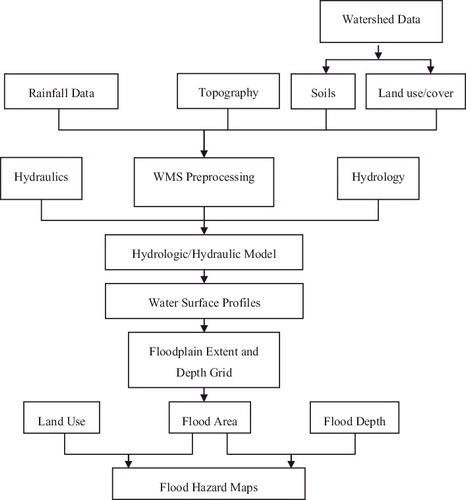
The main goal of this study is to estimate the flooding risk for the city of Hafr Al-Batin. Based on the available meteorological and spatial watershed data, it was decided to use hydrologic and hydraulic models forced by frequency storm data. There are several well-known watershed models which are currently in use in flood studies all over the world. These models vary significantly in terms of capabilities and data needs (Singh & Frevet Citation2006). Two of the Hydrologic Engineering Center (HEC) models were selected: the HEC hydrologic modelling system (HEC-HMS) (USACE Citation2000) and the HEC river analysis system (HEC-RAS) (USACE Citation2000). The watershed modelling system (WMS) (EMRL Citation2015), ArcGIS and AutoCAD were used for processing model input and output. The major steps followed in the study include the following: generate a DEM for Wadi Al-Batin watershed; delineate the watershed and prepare hydrologic model input using WMS, ArcGIS and AutoCAD; use HEC-HMS to estimate the runoff hydrographs for different storms; use WMS to prepare input for the hydraulic model; develop a hydraulic model for Wadi Al-Batin and use HEC-RAS and ArcGIS to generate flood risk maps for Hafr Al-Batin city. summarizes the steps of the proposed methodology.
Figure 4. Schematic diagram of the proposed flood model.
Watershed data
The watershed data needed for the flood risk study included DEM data, stream network data and soil and land cover data. The DEM data was needed for delineating the catchment and its sub-basins and computing model parameters, such as sub-basin slope and time of concentration. The stream network was superimposed on the network generated through delineation to make adjustments when necessary. The soil and land use/cover data were necessary for computing model parameters, most importantly, the curve numbers (CNs) and flood risk estimation. The Saudi General Directorate of Military Survey (GDMS) national DEM data at 30-m resolution was used. These DEMs were generated from photogrammetry and ground control data (El Hassan et al. Citation2014). shows Hafr Al-Batin catchment as delineated from GDMS 30-m resolution DEMs. Land use/cover data were obtained from Spot 5 and Landsat remote sensing imagery. Soil and geologic data were obtained from the Saudi Geological Survey maps. Soil properties and parameters were derived from the digital soil map of the world (FAO Citation1998).
Figure 5. Hafr Al-Batin digital elevation model (DEM).
Modelling tools
Watershed modelling system (WMS)
The WMS is used for processing digital watershed data, watershed delineation, preparation of input data for the hydrologic and hydraulic models and analysis of the model output. WMS has the capability of automating watershed delineation and parameter calculation from digital elevation data, importing GIS data, extracting important watershed information from the GIS database, running hydrologic modelling programs and viewing the results of these programs. Moreover, WMS supports several well-known river hydraulic and storm drain models, such as HEC-1, HEC-HMS, HEC-RAS, TR-55, TR-20, NFF, HSPF, Rational MODRAT, GSSHA, CE-QUAL-W2, EPA SWMM, SMPDBK and other models (Noman et al. Citation2003; Erturk et al. Citation2006; Smemoe et al. Citation2007).
Hydrologic model: HEC-HMS
HEC-HMS is a comprehensive hydrologic modelling tool developed by the U.S. Army Corps of Engineers and the HEC. The model is designed to simulate rainfall-runoff processes for a wide range of watershed types. HEC-HMS uses several sub-models to represent different components of the runoff process with the choice of numerous infiltrations, unit hydrograph and flood routing methods (USACE Citation2010a). The Soil Conservation Service (SCS) (currently the Natural Resources Conservation Service (NRCS)) CN method (SCS Citation1986) is the main approach used for estimating the infiltration capacity and runoff for various combinations of soil and land/use cover type. Newer versions of the models included major enhancements, such as Green and Ampt infiltration, grid-based runoff calculation and the use of radar-based gridded rainfall estimates.
The CN method was used in this study. The method proves to be applicable on different environments, reliable and gives appropriate results despite its simplicity and similar results obtained compared to much complex models (Ponce & Hawkins Citation1996; Shrestha Citation2003). The CN is determined by most of the characteristics of the watershed related to runoff production, such as land use, antecedent moisture, hydrologic conditions and soil type (Mishra & Singh Citation2004). According to SCS, the effective precipitation is computed by(1)
(1) where Pe is the effective precipitation (precipitation that is transformed to runoff); P is the total precipitation and S is the maximum potential for soil retention.
EquationEquation (1)(1)
(1) assumes that 20% of the rain is absorbed before the start of the surface runoff and the remaining 80% is absorbed during runoff due to soil, which depends on land usage, vegetation, soil permeability and initial soil moisture (Ghahroudi Citation2006). The surface storage of soil (S) is computed by
(2)
(2)
In EquationEquation (2)(2)
(2) , CN is the curve number, which is a dimensionless variable between 0 and 100. At a CN of 100, the soil loses its ability to absorb rainfall and the runoff is equal to rainfall.
To transform effective precipitation into a runoff hydrograph, the SCS unit hydrograph method option was selected in this study. In this method, the peak flow hydrograph (Qp) and the time to the peak of the unit hydrograph (tp) are estimated from the following equations:(3)
(3)
(4)
(4)
(5)
(5) in which, L is the hydraulic length of the watershed; Y is the average watershed land slope; A is the watershed area; D is time interval; tp is the time to the peak of the unit hydrograph; tl is the lag time between the centre of mass of excess rainfall and the peak of the unit hydrograph and Qp is the peak flow of the unit hydrograph.
From among the five channel routing methods in HEC-HMS, the Muskingum-Cunge hydraulic routing method was selected. The method has been documented in many textbooks and research papers. (e.g. (Ponce Citation1989)). The continuity equation and the relationship between outflow, channel reach storage, and inflow are combined to develop the following equation:(6)
(6) where O is the outflow; I is the inflow; t is time and K and X are parameters depending on the channel and flow characteristics. Cunge (Citation1969) developed equations to estimate K and X from hydraulic properties of the reach. In this method, the discharge versus area relationship for regular cross sections (e.g. trapezoidal) is fitted by a power curve function. The flood wave celerity concept and Manning equation are used in the solution of EquationEquation (6)
(6)
(6) . The numerical solution of the equation is straightforward for regular and more natural channels, but becomes more complex from cross sections with channel and floodplain.
Hydraulic model: HEC-RAS
HEC-RAS is a windows-based hydraulic model also developed by the U.S. Army Corps of Engineers and the HEC. The model uses output hydrograph from HEC-HMS as an input to calculate and analyse the floodplain hydraulics (USACE Citation2010b). Generally, water elevation at a location in a floodplain is a more direct interest for flood analysis than magnitude of discharge. Water elevation is determined by a hydraulic analysis, which is oftentimes performed subsequent to a hydrologic analysis. The model is used to simulate steady, gradually varied, rapidly varied and unsteady one-dimensional flow and to delineate flood zones, which is the most common application of the model. Continuity, momentum, energy and Manning equations are used for these computations.
Simulation results and discussion
WMS was used to delineate Al-Batin catchment and its sub-catchments from the 30-m DEM. The DEM was imported to WMS after being reprojected into Universal Transverse Mercator (UTM) coordinates. The TOPAZ tool in WMS was used to compute flow directions and flow accumulations. The catchment was divided into 182 sub-catchments to account for variability in the land use, soil type and the catchment topography. The large number of sub-basin can help to estimate flooding over the whole catchment and not only at the catchment outlet. Sub-catchments in the city were much smaller to accurately represent the runoff generation parameters and to provide hydrographs at more locations for flood zone delineation. Those parameters are sub-catchment area, CN, time of concentration, lag time and slope. WMS automatically computes the sub-catchment SCS CN from the soil type and land use maps and a table that specifies CNs for different soil hydrologic group and land use/cover combinations (). The CN values for different sub-catchments ranged between 55 and 84. Impervious area fractions for urban sub-catchments were estimated from aerial photography maps. The Muskingum-Cunge routing method was used to route the hydrograph estimated at the outlet of each sub-catchment. The standard Natural Resources Conservation Service (NRCS) lag method was also applied.
Table 3. Curve number (CN) values.
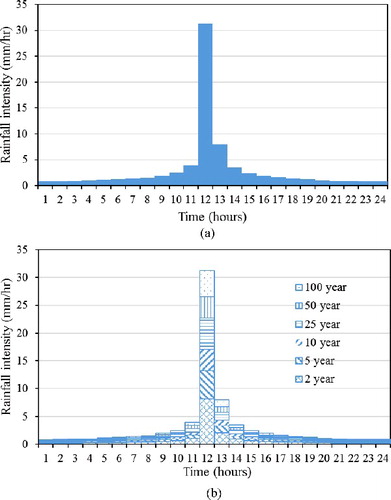
Rainfall data is the most important input for event-based HEC-HMS simulations. The 100-year, 50-year, 25-year, 10-year, 5-year and 2-year 24-hour storms were used as input. The 6-minute distribution of these storms based on the Natural Resources Conservation Service (NRCS) Type II storm was adopted. Type II rainfall distribution was assumed for Al-Batin catchment area which is suitable for arid and semi-arid regions. The distribution of 100-year 24-hour storm is shown in . Although the storm lasts for a whole day, it can be seen in that most of the rainfall occurs over the middle six hours. The 6-minute time intervals were used to input the rainfall data into HEC-HMS because they offer the highest possible level of detail.
Figure 6. Rainfall hyetograph: (a) 6-minute hyetograph for 100-year storm and (b) 6-minute hyetograph of the 2-, 5-, 10-, 25-, 50- and 100-year storms.
The HEC-HMS data described above was used to construct the basin and meteorological module of the model as shown in . shows the HEC-HMS hydrograph at the catchment outlet just outside the city of Hafr Al-Batin for different return periods. The peak discharges and runoff volumes for the 2-, 5-, 10-, 25-, 50- and 100-year return periods are summarized in . It can be seen in that the sharp contrast in runoff generation between the urban portion near the outlet and the rest of the catchment has great influence on the shape of the hydrograph. For small events when the runoff ratio in the barren portion of the catchment is small, most of the runoff comes from the urban portion. For larger events, the barren portion of the catchment contribution to the hydrograph becomes significant, but results in a delayed peak, making the hydrograph bimodal. As the event rainfall increases, the delayed peak starts to dominate the hydrograph and completely masks the first peak for events larger than the 100-year event.
Figure 7. HEC-HMS basin model of Hafr Al-Batin watershed.
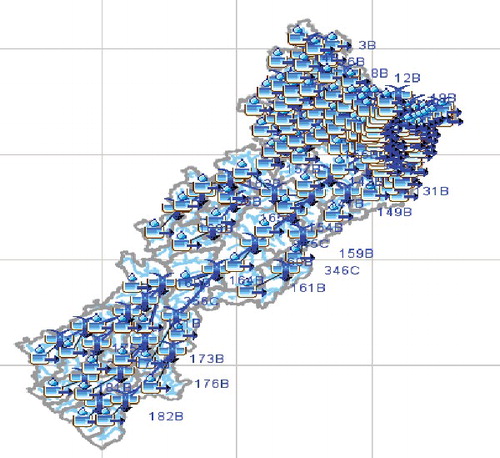
Figure 8. Outlet hydrograph of Hafr Al-Batin watershed for a return period of: (a) 2 years, (b) 5 years, (c) 10 years, (d) 25 years, (e) 50 years and (f) 100 years.
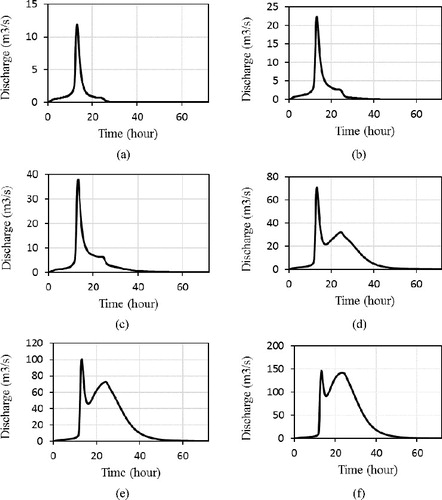
Table 4. Peak discharge, runoff volume and estimated inundated area for different return periods.
HEC-RAS water surface computation
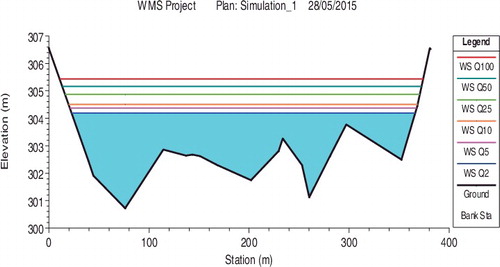
Hydraulic model (HEC-RAS) requires a definition of channel and floodplain geometry and Manning's roughness values. In this study, HEC-RAS input data were prepared using WMS and HEC-GeoRAS. The structure of the channel network in HEC-RAS is represented by a series of interconnected reaches. The channel centrelines and the flood plains were extracted from the DEM. Cross sections perpendicular to the flow lines were constructed manually to divide the channel network into 282 reaches with well-defined junctions (). Similar to the sub-catchment arrangement, the density of the reaches was much higher in the urbanized portion of the catchment. HEC-RAS uses only two-dimensional data for hydraulic computations. However, three-dimensional data extracted from the DEM was used for display purposes. The materials and land use data were also inputted into HEC-RAS to describe roughness variability. The channel network layout and cross-sectional details were exported from WMS into HEC-RAS. The network schematic construction was the most time-consuming task in the model development. HEC-RAS model was run with channel networks of increasing detail until the observed effect on the resulting inundation maps was deemed minimal. HEC-RAS computes the depths corresponding to the maximum discharge computed by HEC-HMS at the defined cross sections and performs interpolations along the reaches. shows the maximum water surface elevations at the watershed outlet for different return periods.
Figure 9. Main reaches and sections along the main channel of Hafr Al-Batin watershed.
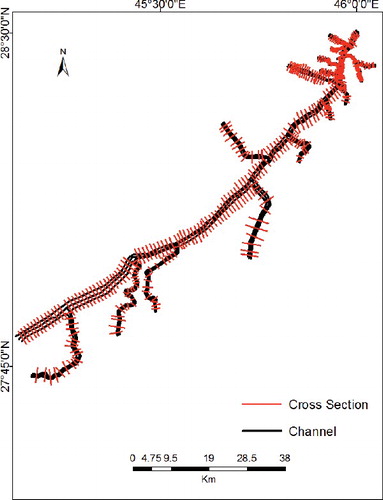
Figure 10. Water surface elevations at the outlet for different return periods.
To develop the flood hazard map, the peak flows for each sub-catchment simulated by HEC-HMS were inputted into HEC-RAS and the solution generated by HEC-RAS model was imported and read by WMS. The process was repeated for all return periods. Each time, a new scatter point file containing the water depths resulting from the HEC-RAS simulation was read into WMS as two-dimensional scatter points that are connected to delineate the flood inundation. These scatter points, which contain the water surface elevations, were interpolated at a 60-m spacing along the main channel centreline where cross sections were extracted in the urban area to achieve more accurate floodplain delineation. The inundated areas were represented as flood polygons in the developed flood hazard map, as shown in (a), for the 100-year design storm. Hafr Al-Batin municipality has developed a flood risk map indicating the city divisions that are subject to frequent flooding. The map, which is based on observations, includes three categories: high risk, low risk and no risk ((b)). Visual comparison indicates that the municipality map agrees well with the indication delineated for the 2-year storm. The inundated area intersects with several major and minor roads in the city, indicating the risk of driving through these roads during flood events. Media images from recent flooding in the city of Hafr Al-Batin (November 2015) showed flooded streets and high water rescue operations. The flooding led to school closures for several days.
Figure 11. Flood hazard maps developed by (a) WSM and (b) Hafr Al-Batin municipality.
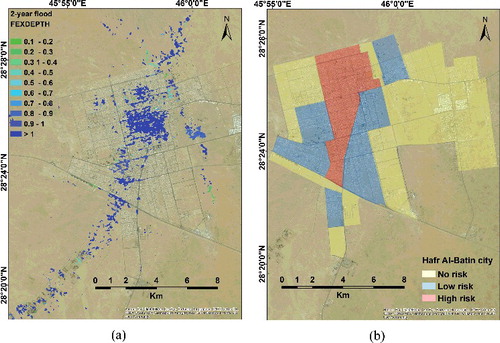
shows estimates of the inundated area of Hafr Al-Batin for different frequencies. The inundated area for the 2-, 5-, 10-, 25-, 50- and 100-year return periods are 9.21, 10.11, 10.72, 11.3, 12.51 and 13.41 km2, respectively. Hafr Al-Batin city has an area of 122 km2 and the results indicate that the percentages of the city that is expected to be inundated by the 2-, 5-, 10-, 25-, 50- and 100-year return periods are 7.5%, 8.3%, 8.8%, 9.3%, 10.3% and 11.0%, respectively. The results also show that as the return period increases there is no significant increase in the inundated area. Due to the location of the city and the topography of Hafr Al-Batin watershed, it is expected that the city will experience flooding even for events with small return periods.
Conclusions
This paper performed rainfall frequency for Wadi Al-Batin, Saudi Arabia and examined flood hazards in the city of Hafr Al-Batin, located near the outlet of the catchment. Due to the discontinuity of rain gauge data and the large size of the catchment, reanalysis gridded rainfall was used in the development of frequency storms. Homogeneity of mean and variance of the reanalysis data was checked against observations from a rain gauge located at the city of Hafr Al-Batin. A GIS-based modelling interface was used to pre-process the terrain and rainfall data and generate input files for hydrologic and hydraulic models. The runoff estimation was based on the widely known SCS CN approach. The catchment was divided into sub-catchments to improve runoff estimation with smaller sub-catchment in the urban portion of the catchment. The hydrologic/hydraulic model simulations simulated the runoff hydrograph corresponding to different design storms and helped to delineate the resulting flood inundation maps. The delineated inundation maps agree with the hazard map developed by the municipality. This information can be used by city officials as basis for rough estimates of indicative infrastructure/houses/buildings losses corresponding to design storms by superimposing updated detailed land use maps on the delineated flood zones.
The present study was performed using existing urbanization levels and design storms based on the relatively short rain record. Although the rainfall record for this region does not show any increasing trend, future changes are possible. Nevertheless, even under current dry climate, the change in urbanization can significantly increase the runoff resulting from all storms. Sharif et al. (Citation2014) demonstrated that urbanization would substantially increase runoff in similar catchments and that the increase would be more pronounced for small rainfall events (e.g. the 2-year storm). Another problem associated with small events for this catchment is that the hydrograph is bimodal, which is a delayed peak from the barren part of the catchment that might not be expected by residents, which may increase the flood risk. There is also a possibility of localized storms over the large catchment that cannot be felt by residents until the flood arrives in the city.
The results of this study can be utilized for planning purposes and in the design of flood control project as it has estimated the runoff corresponding to different design storms and used hydraulics and geospatial data in delineating the flood zones. The constructed model can be used for traffic safety purposes flowing the methodology proposed by (Nanía et al. Citation2014); in the improvement of road protection against floods and road closures; and for traffic redirection during flood events. Future expansions of the urbanized area should consider the impact on runoff generation and flood hazard. Flooding impact in the residential areas is not restricted to property damage, but can lead to drowning and electrocution caused by contact with unprotected wiring. Two such incidents were reported during the recent floods in the city.
The same methodology used in this study can be used to develop flood zones corresponding to flood of different return periods. The study is focused on design storms that are assumed to be uniform. Given the size of the catchment and the wadis that meet in the city, actual storms may create much more hazardous situations. To study the flood hazard in depth, it is recommended to use actual storms and different urbanization scenarios using a model that can fully incorporate the spatiotemporal variability of rainfall and provide runoff predictions at high resolutions. Ground observations, such as high water marks after flood event, should be collected, which will help in hydrologic and hydraulic model validation. The authors are aware that Hafr Al-Batin is rapidly urbanizing and is acquiring new data regarding future development plans. To provide detailed recommendations regarding mitigation measures and accurate estimates of potential risk, another study using a two-dimensional hydrologic/hydraulic model and more detailed land use data is being conducted.
Acknowledgment
The authors would like to acknowledge the support provided by the Deanship of Scientific Research (DSR) at King Fahd University of Petroleum and Minerals (KFUPM) for funding this work through project No. RG1305-1&2.
Disclosure statement
No potential conflict of interest was reported by the authors.
Additional information
Funding
Related Research Data
References
- Abosuliman S, Kumar A, Alam F. 2014. Flood disaster planning and management in Jeddah, Saudi Arabia – a survey. In: Proceedings of the 2014 International Conference on Industrial Engineering and Operations Management; January 7—9; Bali: IEOM; p. 2380–2387.
- Chow VT. 1951. A general formula for hydrologic frequency analysis. Trans Am Geophys Union. 32:231–237.
- Cunge JA. 1969. On the subject of a flood propagation computation method (Muskingum method). J Hydraul Res. 7:205–230.
- Dile YT, Srinivasan R. 2014. Evaluation of CFSR climate data for hydrologic prediction in data-scarce watersheds: an application in the Blue Nile River Basin. J Am Water Resour Assoc. 50:1226–1241. doi: 10.1111/jawr.12182.
- Doocy S, Daniels A, Murray S, Kirsch TD. 2013. The human impact of floods: a historical review of events 1980–2009 and systematic literature review. PLoS Curr. 5. doi: 10.1371/currents.dis.f4deb457904936b07c09daa98ee8171a.
- Edgell HS. 1997. Aquifers of Saudi Arabia and their geological framework. Arab J Sci Eng. ( Water Resources in the Arabian Peninsula: Part I) 22:3–31.
- El Hassan IM, Algarni DA, Dalbouh FM. 2014. Flood risk prediction using DEM and GIS as applied to Wijj Valley, Taif, Saudi Arabia. J Geomat. 8:86–89.
- El-Baz F. 2010. Arab environment: Water. Remote Sensing: Generating Knowledge about Groundwater. AFED. 201–222. Available from: http://www.afedonline.org/report2010/pdf/en/specialstudy.pdf.
- [EMRL] Environmental Modeling Research Laboratory. 2015. Watershed modeling system (WMS) version 10.0 tutorial. Utah: Brigham Young University.
- Erturk A, Gurel M, Baloch MA, Dikerler T, Varol E, Akbulut N, Tanik A. 2006. Application of watershed modeling system (WMS) for integrated management of a watershed in Turkey. J Environ Sci Health A. 41:2045–2056.
- [FAO] Food and Agriculture Organization of the United Nations. 1998. World reference base for soil resources. World Soil Resources Report, #84. Rome: FAO; p. 88.
- Ghahroudi M. 2006. SCS model assessment in runoff estimation: case study: watershed of AmirKabir Dam (Karaj). Geogr Dev. 4:9–16.
- Hasanean H, Almazroui M. 2015. Rainfall: features and variations over Saudi Arabia, a review. Climate. 3:578–626.
- Horritt MS, Bates PD. 2002. Evaluation of 1D and 2D numerical models for predicting river flood inundation. J Hydrol. 268:87–99.
- [IDD] International Disaster Database. 2015. Center for research on the epidemiology of disasters. Country profile: natural disasters; Available from: http://www.emdat.be.country-profile/index.html.
- Köppen W. 1936. Das geographisca system der klimate. In: Köppen W, Geiger G editors. Handbuch der Klimatologie [Handbook of Climatology]. 1.C. Gebr, Stuttgart: Borntraeger; p. 1–44.
- Lázaro R, Rodrigo F, Gutiérrez L, Domingo F, Puigdefabregas J. 2001. Analysis of a 30-year rainfall record (1967–1997) in semi-arid SE Spain for implication on vegetation. J Arid Environ. 48:373–395.
- Lee KS, Lee SI. 2003. Assessment of post-flooding conditions of rice fields with multi-temporal satellite SAR data. Int J Remote Sens. 24:3457–3465.
- McClure HA. 1978. Ar Rub' Al Khali. In: Quaternary period in Saudi Arabia, Vol. 1. Vienna; Springer-Verlag; p. 252–263.
- McDonnell RA. 1996. Including the spatial dimension: using geographical information systems in hydrology. Prog Phys Geogr. 20:159–177.
- Mishra SK, Singh VP. 2004. Long-term hydrological simulation based on soil conservation curve number. J Hydrol Process. 18:1291–1313.
- Najafi MR, Moradkhani H, Piechota TC. 2012. Ensemble streamflow prediction: climate signal weighting methods vs. climate forecast system reanalysis. J Hydrol. 442–443:105–116.
- Nanía LS, León AS, García MH. 2014. A hydrologic-hydraulic model for simulating dual drainage and flooding in urban areas: application to a catchment in the metropolitan area of Chicago, IL. J Hydrol Eng. 20. doi: 10.1061/(ASCE)HE.1943-5584.0001080.
- Noman N, Nelson E, Zundel A. 2003. Improved process for floodplain delineation from digital terrain models. J Water Resour. 129:427–436.
- Noman NS, Nelson EJ, Zundel AK. 2001. Review of automated floodplain delineation from digital terrain models. J Water Resour Plan Manag. 127:394–402.
- Pilgrim H, Chapman T, Doran D. 1988. Problems of rainfall-runoff modelling in arid and semiarid regions. Hydrol Sci J. 33:379–400.
- Ponce VM. 1989. Engineering hydrology – principles and practices. Englewood cliffs (NJ): Prentice-Hall.
- Ponce VM, Hawkins R. 1996. Runoff curve number: has it reached maturity? J. Hydrol Eng ASCE. 1:11–19.
- Saha S, Moorthi, S, Pan H-L, Wu X, Wang J, Nadiga S, Tripp P, Kistler R, Woollen J, Behringer D, et al. 2010. The NCEP climate forecast system reanalysis. Bull Am Meteorol Soc. 91:1015–1057.
- [SCS] U.S. Soil Conservation Service. 1986. Technical release 55: urban hydrology for small watersheds. Washington (DC): USDA (US Department of Agriculture).
- Sharif HO, Al-Juaidi FH, Al-Othman A, Al-Dousary I, Fadda E, Jamal-Uddeen S, Elhasssan A. 2014. Flood hazards in an urbanizing watershed in Riyadh, Saudi Arabia. Geomat Nat Hazards Risk. 7: 702–720.
- Shrestha MN. 2003. Spatially distributed hydrological modelling considering land-use changes using remote sensing and GIS. In: Proceedings of Map Asia Conference; Kuala Lumpur, Malaysia. Available from: http://citeseerx.ist.psu.edu/viewdoc/download?doi=10.1.1.542.3756&rep=rep1&type=pdf
- Singh V, Frevet D. 2006. Watershed models. London: Taylor & Francis.
- Smemoe C, Nelson E, Zundel A, Miller A. 2007. Demonstrating floodplain uncertainty using flood probability maps. J Am Water Resour Assoc. 43:359–371.
- [USACE] United States Army Corps of Engineers. 2000. Hydrologic modeling system HEC-HMS, technical reference manual. Davis, CA: USACE Hydrologic Engineering Center.
- [USACE] United States Army Corps of Engineers. 2010a. Hydrologic modeling system HEC-HMS, technical reference manual. Davis, CA: USACE Hydrologic Engineering Center.
- [USACE] United States Army Corps of Engineers. 2010b. HEC-RAS river analysis system, hydraulic reference manual 4.1. Davis, CA: USACE Hydrologic Engineering Center.
- Wei W, Jilong C, Ronghui H. 2013. Water budgets of tropical cyclones: three case studies. Adv Atmos Sci. 30:468–484.
- Wheater H, Butler A, Stewart E, Hamilton G. 1991. A multivariate spatial-temporal model of rainfall in southwest Saudi Arabia. I. Spatial rainfall characteristics and model formulation. J Hydrol. 125:175–199.
- [WMO] World Meteorological Organization. 2003. Our future climate (Publication WO-952). Available from: http://climateofourfuture.org