
ABSTRACT
The Grand Ethiopian Renaissance Dam (GERD) is constructed in a mountainous area where limited information has been collected on key environmental factors and which is lacking of information about site condition, hazards and environmental impacts. To deal with problems, the Shuttle Radar Topographic Mission (SRTM) DEM and Advanced Land Observation Satellite Phased Array type L-band Synthetic Aperture Radar (ALOSPALSAR) were used to map factors that can lead to the GERD failure and predict the flooded area in Sudan and seawater intrusion in the Nile Delta, Egypt. The results showed that the Nubian Block and the GERD site are structurally controlled by sets of faults. Their trends are in the NNE–SSW, NE–SW, and NNW–SSE directions and share the similar trends with the shear stress and African Rift, which created some alarm. The results indicated that the maximum extent of the Sudanese inundation area, as estimated from a DEM using a flood basin model, was about 667,228 km2 along the Blue Nile River and was at high risk. The results also showed that one-third of the Nile Delta will experience seawater intrusions when the groundwater table depletes 5 m below sea level.
1. Introduction
The Nile River flows through very diverse climatic regions and its basin () is characterized by water scarcity, rapid population growth and poverty, the difficulty and complexity of which will probably be compounded for the foreseeable future (Batisha Citation2011).
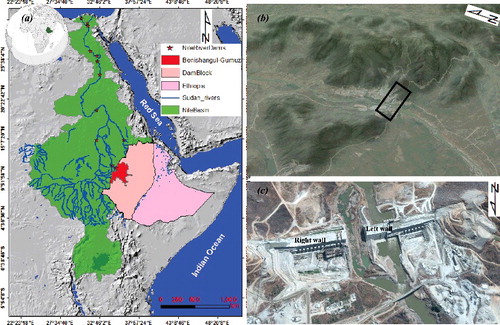
Figure 1. Nile River Basin map (a), 3D perspective view (b), and a zoom of Quickbird Image with a spatial resolution of 0.6 m (c) of the GERD, showing the GERD located between two hard rock hills. The red stars and red polygon highlight dam locations that are constructed on the Nile River and study area, respectively. (To view this figure in colour, see the online version of the journal.)
In April 2011 and during the Egyptian Revolution, Ethiopia announced that it intended to build one of the largest dams in the world, the Grand Ethiopian Renaissance Dam (GERD). This GERD will flood 1700 square kilometres of forest in north-western Ethiopia – approximately 811 km from Addis Ababa and 14 km from the Sudan border – creating a dam reservoir that will hold up to 67 billion cubic metres of water, potentially taking up to seven years to reach capacity and ultimately becoming nearly twice as large as Lake Tana, Ethiopia's largest natural lake (). The GERD reservoir will fill within a six-year period, accompanied by environmental impacts on Egypt and Sudan (Mulat & Moges Citation2014).
Figure 2. Flow chart of the methodology.
Dam failure, including the GERD, can be resulted by an earthquake, active fault zone, intensive rainfall, landslides and floods within reservoir, inadequate spillway capacity and building on easily eroded basement rocks (Canadian Dam Association Citation2000; International Panel of Experts (IPoE) Citation2013).
According to Veilleux (Citation2013) and Costa and Schuster (Citation1988), dam failures can result from anyone, or a combination, of the following causes:
| (1) | Prolonged periods of rainfall and flooding (the cause of most failures). | ||||
| (2) | The presence of geological structures such as fault, joint zones and folds in the rocks. | ||||
| (3) | Reservoir silting and sediment accumulation in the dam's reservoir due to insufficient dam spillways. | ||||
| (4) | Landslides into reservoirs, which cause surges that result in overtopping. | ||||
| (5) | Earthquakes, which typically cause longitudinal cracks at the tops of embankments, leading to structural failure. | ||||
The GERD is constructed in a remote area where limited data have been collected on key environmental and social factors, lacking information about geology, tectonics, ongoing maintenance, dam failure, safety inspections and continue safe service, as well as a full environmental impact assessment, in violation of the National Environmental Law (Tesfa Citation2013). Therefore, it has become important to utilize new technology and integrate an approach. Remote sensing instruments enable the acquisition of geological information and investigation of the dam location without the need for physical contact and field observation. Satellite data serve as a regional picture of various features related to the geology, geomorphology and physiography of the area under consideration. The new version of SRTM DEM and ALOS PALSAR images can be precisely to map factors controlling geological condition of foundation and construction sites and offering regional coverage than can be supplied using geophysical survey and field observation, especially those in remote and mountainous areas (Massonnet & Feigl Citation1998; Ismail et al. Citation2011). Active remote sensing data have been widely utilized to monitor deformation of constructed dams (Simons & Rosen Citation2007; Zhou et al. Citation2016), floods (Brivio et al. Citation2002; Dewan et al. Citation2006; Van Dijk et al. Citation2016) and seawater intrusion. Locally, limited numbers of studies have stressed on ALOSPALSAR and SRTM DEM to map factors controlling dam sites and its environmental impacts on Sudan and Egypt have not been investigated yet. This study (the first attempt) aims to use the active remote sensing data to map factors that can lead to the GERD failure and investigate the environmental and geotechnical impacts of the GERD on Sudan and Egypt. This study also aims to map and simulate the flooded area in Sudan and seawater intrusion in the Nile Delta, Egypt using flood basin model in the case of GERD failure and non-failure. The integration of remote sensing and geographic information system (GIS) is of great assistance in predicting and describing potential geohazard events as a result of dam failure.
2. Study area
2.1. Geography and hydrological setting of the GERD
The GERD is located in the north-western Ethiopia, about 14 km from the Sudan border, and stretches from latitude 11°10′ 30″N and 11°17′ 15″N, to longitude 35°01′ 04″E and 35°07′ 48″E (). It is located on the northwestern side of the Benishangul–Gumuz region, which is characterized by high rainfall between May and October. The estimated annual rainfall is approximately 860 mm at the dam site and 2250 mm in the adjoining mountainous areas. The volume of rainwater is a weather erosion agent, which affects the fill slopes, leading to gully erosion and landslides.
The Nubian Block, including the GERD location, is drained by intensive dendritic streams, which flow from a high-elevation area to low-elevation areas under the influence of gravity. These dendritic streams reflect topography with a steep slope. In areas with a steep slope, rainwater accelerates and the probability of rock erosion and landslides occurrence increases (Elmahdy et al. Citation2016; Elmahdy & Mohamed Citation2016). Several landslides and flash floods have been reported in the mountainous area of the Nubian Block (Temesgen et al. Citation1999). The GERD is located within certain confines to consolidate aquifer, the retention capacity of which is low. The groundwater level and a recharge rate on groundwater sources appear to be depleted, reaching 138 m (a.s.l.), possibly due to deforestation in the region (Tesfa Citation2013).
2.2. Geological setting of the GERD
The Nubian Block and the dam site are underlain by Archaean basement rocks. Massive and highly fractured igneous and metamorphic rocks occupy high-hill ranges (Kazmin Citation1972a, 1972Citationb). The northern part of the dam site is occupied by post-tectonic granitoids (granite and diorite). The southern part of the dam site is occupied by metamorphic rocks such as chlorite, amphibolite, talc schist, biotitic schist, and quartz graphite and sedimentary rocks such as conglomerate and sandstone (Mohr Citation1962; Dow et al. Citation1971) ((a)). These rocks are cross-cut by four sets of fault and shear stress zones.
The prominent trends of these features are in the NE–SW, NNE–SSW, NW–SE, NNW–SSE and WNW–ESE directions (Mohr Citation1962; Dow et al. Citation1971). The Nubian Block, including the dam site, is bounded by the African Rift, which is characterized by events that have reached or have exceeded magnitude six (Gouin & Mohr Citation1964; Merla et al. Citation1973; Zanettin & Justin-Visentin Citation1974).
3. Material and methods
3.1. Martial
In the current study, data from the April 2010 report of the Phased Array type L-band Synthetic Aperture Radar (PALSAR) with a spatial resolution of 25 m were used, while those of the Shuttle Radar Topography Mission (SRTM) DEM with a spatial resolution of 30 m were used for extracting geological structures, lithology and the stream network of the dam site, as well as to simulate the river-flooded and seawater intrusion areas. These various remote sensing data were obtained via the United States Geological Survey (USGS) website (http://earthexplorer.usgs.gov/).
The active sensors (L-band and C-/X-band) were chosen due to their ability to penetrate vegetation and cloud cover and probe surface and near-surface features of the GERD site over regional scales with low consuming time and economic (Roth & Elachi Citation1975; Jarvis et al. Citation2004; Elmahdy & Mostafa Mohamed Citation2013). Thus, the new version of the SRTM DEM with a spatial resolution of 30 m and the PALSAR images are now the suitable dataset for the current study (Farr et al. Citation2007). The characteristics of these data are presented in . We also used the map of geology (Teshome & Woldie Citation1996) and Earthquake locations were collected from the Ethiopian Geosciences Information System (EGIS 1998) http://www.gse.gov.et/index.php/2016/09/03/geooscience-nformation-center/, the map of topography, fault and shear zones, the map of flooded areas and landslide locations and the map of rainfall distribution.
Table 1. PALSAR characteristics (Wakabayashi et al. Citation1996).
3.2. Mapping and assessment of factors that can lead to the GERD failure
3.2.1. Geology contributing to dam failure
The presence of shear zones and joints in dam site rocks brings weakness to the dam foundation (Terzaghi Citation1929). Therefore, it is important to map fault and shear zones that cross-cut the Nubian Block and Benishangul–Gumuz region, including the GERD site. Mapping of geological structures were performed using three methods (). In the first method, the regional fault and tectonic shear zones were screen-digitized from the geological map of Ethiopia. In the second method, a set of shaded relief maps and filtered PALSAR images in all directions (45°, 90°, 135°, …, 315°) were used to map geological lineaments (Elmahdy & Mohamed Citation2016). In the third method, the tecto-lineaments of the region were extracted from a set of slope, aspect and shaded relief maps derived from the SRTM DEM (Jordan & Csillag Citation2001; Samy et al. Citation2012; Elmahdy & Mohamed Citation2016; Elmahdy & Mostafa Citation2012b). Finally, the extracted fault and shear zones and tecto-lineaments were imported into a GIS environment and represented using rose diagrams, after which spatial analysis was performed.
To assess the tectonic setting of the GERD site, all earthquakes and landslide locations were screen-digitized from maps downloaded via the web page of the Institute of Geophysics, Space Science and Astronomy (http://www.aau.edu.et/igssa/academics/). The earthquake locations, which are very closely associated with fault zones, were collected via the webpage of institute of Geophysics, Space Science and Astronomy (http://www.aau.edu.et/igssa/academics/). All geological structures and earthquake locations were imported in to GIS environment and spatial analysis between the GERD site and faults and earthquake locations was performed.
To assess and investigate the influence of rainstorm on rock erosion, the lithological units in the GERD site were screen-digitized from the geological map of Ethiopia (Mohr Citation1962; Dow et al. Citation1971).
3.2.2. Topography slope, hydrology and climatology contributing to dam failure
Topographic slope and floods in the upper stream of the Blue Nile River and watersheds strongly control landslides and produce large amounts of debris during rainstorms (Elmahdy et al. Citation2016). To assess the impact of the topographic slope, stream flooding and flood frequency on the GERD site, topographic slope and stream network and stream profiles were derived from DEM using the ArcGIS v.9.2 software. The stream network was derived from the SRTM DEM with a spatial resolution of 30 m using a D8 algorithm implemented in the ArcGIS software with a threshold value of 55.
To assess the impact of climate change on the GERD site, maps of prolonged periods of rainfall and flooding areas were collected from the web page of the Food and Agriculture Organization (http://www.fao.org/ag/agp/agpc/doc/counprof/ethiopia/ethiopia.htm).
3.3. Environmental impacts of the Great Renaissance Dam on the riparian countries
To assess the environmental impacts of the GERD on the riparian countries, two scenarios were built. The first scenario was built on the basis of an event of GERD failure, while the second scenario was built on that of an event of non-failure. For the event of GERD failure, a simulation model was established from a DEM using a flood basin model implemented in the open source MicroDEM v.12 (Guth Citation2009). The model is designed to run on DEM with any spatial resolution.
In the flood basin model, a point and reservoir level are selected; all points below that level would be flooded and are thus shown in a blue colour. It is important to note that a shape file with starting locations can be used instead of selecting a specific point. This model was then applied to the riparian countries (downstream) in order to simulate the flooded area of the Blue Nile River when the water level in the GERD reservoir exceeds the GERD wall height, which is expected to be 170 m.
The model was designed to simulate seawater intrusion along the coastal area of the Nile Delta, Egypt, when the groundwater table depletes 5 m below sea level. Finally, the depth of the flooded area was obtained by subtracting the minimum from the maximum level of the flood area on the SRTM DEM.
4. Results and discussion
4.1. Geological factors contributing to dam failure
displays the major tecto-lineaments and shear stress and fault zones that control the Nubian Block, including the GERD and its reservoir. According to the rose diagrams, four sets of fault and shear zones control the tectonic and geological setting of the Nubian Block, including the dam region (Benishangul–Gumuz). Their common trends are in the NNE–SSW, NE–SW and NW–SE directions, respectively, and they share the African trend that cross-cuts the Nubian Block. Among these zones, there are a number of joints and fault zones. Their trends are commonly in the WNW–ESE, NNW–SSE and ENE–WSW directions. These various trends clearly influence the geotechnical conditions of the construction basement of the GERD and its reservoir (). Their mean and standard deviation values are 89.66 and 105.20, respectively ().
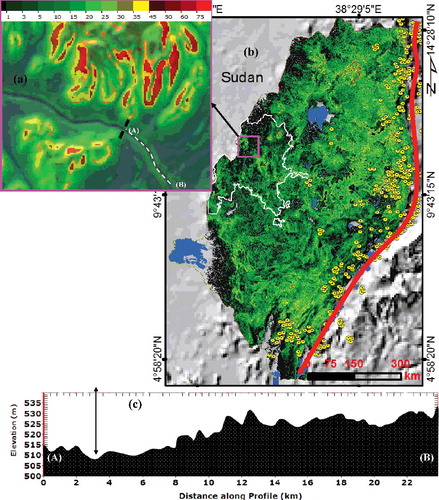
Figure 3. Tectonic map of the Nubian Block (a), and the estimated lake (blue colour) of the GERD and lineaments (dashed lines) cross-cut the GERD region (b) showing the major tecto-lineaments (black lines), and shear stress (cyan lines) control the entire block including the GERD lake. The yellow dots and black arrow highlight the earthquake locations and the direction of the Nubian Block movement, respectively. The red thick line highlights the location of East Africa's Great Rift Valley. (To view this figure in colour, see the online version of the journal.)
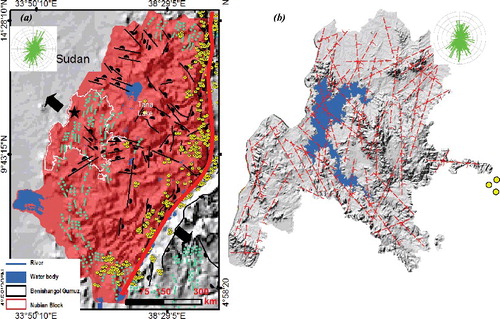
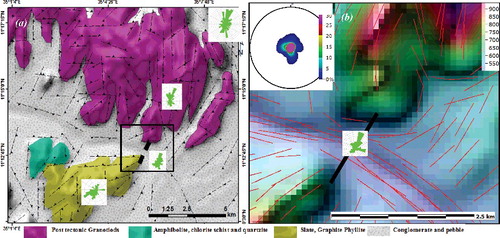
Figure 4. Geological elements (a), and lineaments extracted from a DEM (b) of the GERD control GERD site. Rose and earth normal diagrams highlight the trends of the geological structures that control the GERD site. All the normals either point to the NE or SW of bearing of 26.6°.
Statistical analysis using the rose diagrams shows that the hilly areas, including the GERD site, are structurally controlled by NNE–SSW, NNW–SSE and ENE–WSW trending fault zones and agree well with those trends that cross the Nubian Block and African Rift ( and ). Their fault trends are parallel to the GERD and their displacements are perpendicular to the dam walls, creating some alarm (). Their mean and standard deviation values are 138.86 and 92.35, respectively ().
Table 2. Statistics of the fault directions cross-cut the Nubian Block and the GERD site.
Building such a dam on intensive geological fracture intersections can cause enormous leakage of water through the conglomerates and increase the time it takes for the reservoir to fill.
Although all of these faults have experienced major earthquakes historically, several earthquakes have occurred along the edge of the Nubian Block and African Rift (). All faults along the African Rift are characterized by continuing seismic and/or microseismic activity, and some major earthquakes have occurred on faults that are located within 250 km of the GERD (). Thus, the presence or absence of earthquakes should be viewed with great caution in determining the degree of activity of a given fault (Allen et al. Citation1965; Yeats et al. Citation1997). Of the hundreds of dams built in regions of high earthquake potential, few are found in locations where faults are not recognized or suspected to exist (Sherard et al. Citation1974).
Allen (Citation1982) argued that reservoir-triggered earthquakes probably could occur on a fault otherwise regarded as inactive because the dam reservoir may generate a stress distribution quite unlike anything the area had otherwise experienced for many thousands of years ().
demonstrates the geological elements of the GERD site identified from the geological map of Ethiopia, the PALSAR images and SRTM DEM using visual interpretation. The map shows that the GERD site lies between two hills. The right hill (1400 m) is mainly composed of intrusive acidic rocks such as post-tectonic granitoids and granite, with shear peak strength ranges from 24 to 42 (), while the left hill (1100 m) is composed of metamorphic rocks such as chlorite slate, amphibolite, talc schist, biotitic schist and quartz graphite, and sedimentary rocks such conglomerate and sandstone, with shear peak strength ranges from 31 to 38 ().
Table 3. Shear strength of filled discontinuities.
These rocks are characterized by cleavage and foliation, causing water leakage and rock erosion forming sand and clay. Thus, most of the lithology of the GERD site is easily erodible, undesirable and fails to offer a stable foundation. The GERD site is considered less suitable than others because it has a foundation of gently dipping granite and slate, and is located very close to high-fracture zones.
4.2. Topographic slopes contributing to dam failure
shows the topographic slope map derived from DEM. The map shows that the mountainous area (upstream) is characterized by steep slopes and discontinuities, with an average slope of 12.31°. These discontinuities contribute to slope stability and, thus, landslides occurrence.
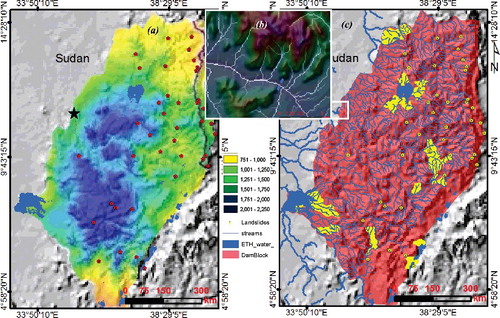
Figure 5. Zoom of slope map of the GERD location (a), slope map of the Nubian Block (b), and stream profile along the Nile River, showing a big depression with 20-m depth in front of the GERD site. The red line highlights the location of East Africa's Great Rift Valley.(To view this figure in colour, see the online version of the journal.)
Previous reports offer evidence of instability due to landslides and flash floods associated with water pressure caused by heavy rain (Hatzor & Goodman Citation1997). Landslides and flash floods may produce and increase the sediment and silting content of the GERD reservoir. This silting content may lead to spillway failure of the GERD, as well as physical and biological river water problems. The estimation of the sedimentation risk of the GERD is not known, nor is it clear how the GERD will fare with the heavy sedimentation burden that the Blue Nile brings.
Closer to the GERD site, the slope map ((a)) shows that the northern hill is characterized by steep and moderate slopes and has moderate to high susceptibility to blocking sliding by planar failure and heavy rainfall, while the south-western hill is characterized by moderate slopes and has medium to low susceptibility to blocking sliding by planar failure. The obtained slope map and the landslide distribution suggest that topographic amplification occurred not only in the mountainous area (upstream) but also on some slopes surrounding the GERD and its reservoir, especially in the northern hill.
(b) shows stream profile generated from a DEM for the area before the GERD site. The profile shows an irregular surface and depression in the river course with a maximum depth of about 20 m. The presence of this depression will increase water and sediment accumulations, representing a load on the GERD walls. This load may increase the probability of GERD failure, especially when rainfall anomalies occur owing to climate change.
4.3. Meteorological factors contributing to dam failure
(a) shows a rainfall distribution map over the Nubian Block. The map shows that annual rainfall ranges from 250 mm in the east and north to 2250 mm in the mountainous areas in the middle. Intense rainfall in the mountainous areas is expected to result in a dendritic drainage network. Dendritic drainage networks reflect areas with steep slopes. In areas with steep slopes, water accelerates and thus increases rock erosion and the probability of landslide occurrence.
Figure 6. Maps of annual rainfall in mm of the Nubian Block (a), zoom of stream network simulation from DEM for the GERD site (b), and river systems of the Nubian Block of Ethiopia (c). These are draped over DEM. The yellow and red points highlight the landslide locations and yellow polygons in (c) highlight the location of flash flood areas. (To view this figure in colour, see the online version of the journal.)
High landslide concentrations and flash floods are observed in the area following both earthquakes and intensive rainfall ((b)). This will lead to increasing suspended sediments and silting in the GERD reservoir. Nearly all the sediment (∼95%) comes from the Blue Nile and Atbara rivers during the flood season (between July and October).
According to Ahmed and Ismail (Citation2008), the existing Sudanese and Ethiopian reservoirs lost about 50% of their storage capacity in the last 40 years. The Aswan High Dam (AHD) lost about 4% and, taking into consideration the amount of sediment transported by the Atbara river, 95% of the sediment transported to the AHD is from the Blue Nile. This implies that most of the sediment that would have been transported to the AHD and other dams in Sudan will now be held in the GERD reservoir.
It is not clear whether the GERD is safe and guaranteed not to present a danger to the Sudanese people and their property in the future. But an extreme rainfall event (>2500 mm) for a few days will cause an increased stream flows resulting in the water level in the reservoir rising to heights of >700 m (a.s.l.) or 175 m (GERD height), which the GERD may have never previously experienced. In any case, unpredictable downstream flooding hazards may further exist in Khartoum and its adjoining areas depending on whether the GERD fails during heavy rain events.
An increase of the water level and/or overflow (>700 m) due to unprecedented flash floods may lead to the spillway and dam problems and, ultimately, dam failure. The GERD reservoir creates extra water pressure in the joints and fissures in the bedrock under and near the GERD, thereby increasing the risk of an earthquake, depending on the depth of the reservoir, the water volume and the rate of water filling (Gupta Citation2002).
Several dams all over the world, especially in India, have been destroyed owing to unprecedented flash floods, causing massive debris accumulation and problems in the dam spillways. About 35% of the dam failures were the result of floods exceeding the spillway capacity, while 25% were the result of design and foundation problems such as landslides, earthquakes and excess pore pressure (Biswas & Chatterjee Citation1971).
Recent predictions of climate change suggest that several regions of the world will experience a higher frequency of extreme rainfall events, while an increase in the number and intensity of typhoons and hurricanes will produce the rising danger of the water level in the dam reservoir climbing and landslides in the upstream and dam location in the future (Awal et al. Citation2007). Thus, the probable occurrence of dam failure in mountainous areas will also be increased by global climate change. This study warns that an overbuilding of dams such as the GERD could raise the water table in Benishangul–Gumuz beyond safe levels and lead to disaster.
The risk associated with GERD failure and the occurrence of flooding in Khartoum and its adjoining areas will continue to rise dramatically as a result of extreme and unpredictable events. Thus, it is important to use climate databases to predict extreme rainfall events and simulate river-flooded areas. Climate databases help dam engineers to anticipate these surprises.
shows that the NNW trending fault zones have the highest frequency, while the NEN–SWS trending fault zones have the lowest. The highest frequency of earthquakes is located within 700 km of the GERD site and the nearest earthquakes have occurred within 300 km of the site ((a)).
Figure 7. Graphs of faults frequency per each direction (a), and the average slope against elevation (b), showing the NNE trending fault zones that have the highest frequency and the relationship between the GERD site, the distance from earthquakes (zone B) to the GERD site (zone A). (b) shows the relationship between the elevation and the average slope, which is direction-proportional. Both influence water acceleration and rock erosion and the volume of suspended sediments that accumulate in front of the GERD site.
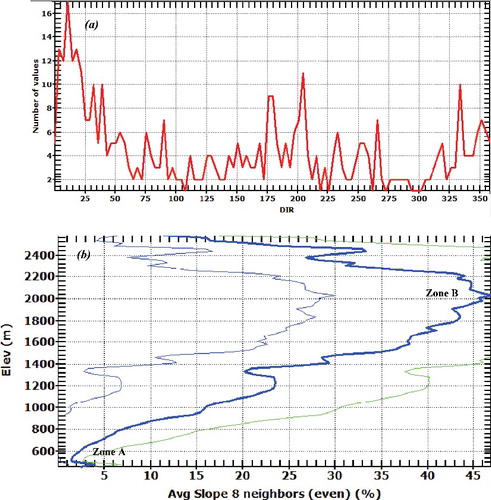
The graph of the topographic slope against elevation shows that there is a directional relationship between the two. As elevation increases, the topographic slope increases (, (b)). Based on topographic slope and elevation, the upstream area can be categorized into two zones. The first zone is characterized by silt and water accumulation and is located at an elevation of about 500 m, while the second zone is characterized by tectonics, intense rainfall and rock erosion, and is located at an elevation of more than 2000 m.
Table 4. Statistic of slope and elevation of the GERD site.
4.4. Environmental impacts of GERD failure
The map of the flooded area in Sudan for the scenario of GERD failure is illustrated in . shows the areas that would be flooded by the Blue Nile River and its tributaries, which flow out of the Ethiopian Plateau, in a case of GERD failure. In this situation, the water would flow from a high-elevation area of 520 m toward the lowland in Sudan at an elevation of 480 m, destroying the Renaissance Dam and flooding the capital of Sudan and White Nile River under the influence of topographic slope ().
Figure 8. The Blue Nile River flooded areas of Sudan simulated from DEM using the flood basin model shows the areas that will be affected by flood in the case of the GERD failure. The red polygons highlight the flooded areas by rainfall water during wet seasons. (To view this figure in colour, see the online version of the journal.)
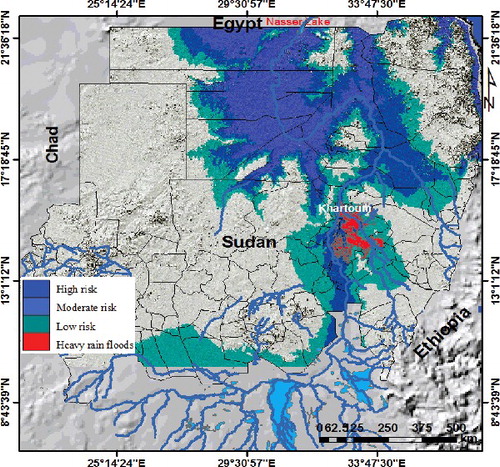
The results of this study indicate that the maximum extent of the inundation area as estimated from a DEM using a flood basin model was about 667,228 km2. These areas are located between the Blue Nile and White Nile rivers and include all urban and agricultural areas ().
The flood basin model shows that the northern part of Sudan is a lowland region by comparison with the southern part. Thus, the river-flooded area in the northern part of Sudan is much larger than that in the south. Yet, damage to buildings and farms in the southern part of Sudan would be much more severe than that in the north due to the high speed of water flow. This scenario demonstrates the need for a saddle dam to be built on the GERD to prevent water stored in the reservoir from spilling out of the south-western side (left wall) of the dam.
4.5. Environmental impacts of GERD non-failure
Although the building of the GERD will prevent flooding in Sudan, it will affect water quality and the environment in Sudan and Egypt. In Sudan, the dam will reduce the amount of suspended sediments (silt) and increase the evaporation rate, salinity and pollution of water. The deterioration of water quality, in turn, will affect the bird and mammal life of Sudan.
Not only will the Sudanese water quality deterioration, but additionally the level of groundwater in the Nile basin of Egypt will deplete. The depletion in the groundwater level of the Nile Delta will, of course, lead to soil salinization and seawater intrusion, in turn resulting in earth subsidence and building collapses, especially in coastal Governorates like Alexandria, Beheira and Kafr el-Sheikh.
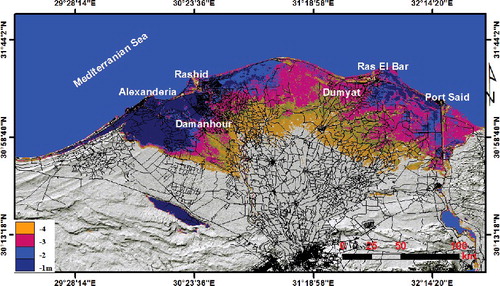
shows three scenarios of seawater intrusion along the Egyptian Nile Delta as a result of GERD construction and groundwater table depletion, which is a common contamination problem in the coastal aquifer. The results show that the Nile Delta (which is part of the coastal aquifer) demonstrates vulnerability that is likely to increase due to ground water table depletion and seawater intrusion, as well as soil salinization. In turn, soil salinization will increase the probability of earth subsidence, geotechnical engineering problems and agricultural degradation. The results obtained reveal that areas of about 2677 and 4675 km2 will experience seawater intrusion when the ground water table depletes, respectively, by 2 and 5 m below sea level (). These areas could be reduced if the number of the GERD spillways was increased.
Figure 9. Geohazard map showing the areas of the Nile Delta, Egypt that will be affected by seawater intrusion when the groundwater table deplete 1, 2, …, 5 m below sea level in the case of the GERD non-failure. The map also shows the areas of Rashid, Alexandria and Damanhour are more probable to be affected by seawater intrusion than the areas of Ras El Bar, Port Said and Dumyat. This map is draped over DEM. The black lines highlight the major highways. (To view this figure in colour, see the online version of the journal.)
5. Conclusion
In this study, we have combined automated and manual methods to map factors contributing to GERD failure and have assessed its environmental impacts on Sudan and Egypt using remote sensing and GIS. The most important feature of this study is that it highlights and focuses on the geohazard setting of the GERD for which limited data have been collected on key geological and topographical factors, lacking information about geology, tectonics and environmental impacts. Furthermore, this study enables prediction of the flooded area in the event of GERD failure and seawater intrusion in the Nile Delta in the event of GERD non-failure. This is especially important for Ethiopia, Sudan and Egypt, where information is often scarce and inaccessible.
The results show that the Nubian Block and the GERD site are structurally controlled by three sets of fault zones. Their trends are located in the NNE–SSW, NNW–SSE and ENE–WSW directions and agree well with shear stress zones and those that cross-cut the African Rift. The results also show that the major faults cross-cut the northern and south-western hills, are parallel with the faults that cross-cut the GERD site and their displacement directions are perpendicular to the GERD walls, creating some alarm.
Steep slopes and annual rainfall contribute to rock erosion and slope stability and, in turn, the yield of suspended sediments in the GERD reservoir. Stream profiles generated from DEM indicate that there is a topographical depression in front of the GERD site. This depression will be filled with water and suspended sediments, thereby increasing the hydraulic pressure on the GERD walls.
The results of the flood basin model demonstrate that the maximum extent of the inundation area in Sudan as estimated from a DEM using the flood basin model is about 667,228 km2 along the Blue Nile River, and all urban and agricultural areas in this region are at high risk of experiencing flooding in the event of GERD failure. To reduce the negative consequences of GERD failure, it is imperative that the Ethiopian Authority prepares an emergency action plan for the GERD.
The results obtained exhibit that an area of the Nile Delta, Egypt, covering an area of about 4675 km2 will experience seawater intrusion when the groundwater table depletes 5 m below sea level. The current study facilitates a better understanding of the geological and topographical conditions that would contribute to GERD failure and assesses the environmental impacts of both GERD failure and GERD non-failure.
Acknowledgments
The authors would like to thank the Earth Remote Sensing Data Analysis Centre (ERSDAC), Japan, the NASA Land Processes Distributed Active Archive Center and the User Services USGS Earth Resources Observation and Science (EROS), and the Consortium for Spatial Information (CSI) of the Consultative Group for International Agricultural Research (CGIAR) for providing and distributing scientific advice and remotely sensed data.
Disclosure statement
No potential conflict of interest was reported by the authors.
Additional information
Funding
Related Research Data
References
- Ahmed AA, Ismail UH. 2008. Sediment in the Nile river system. UNESCO-IHP-International Sediment Initiative; Khartoum, Sudan.
- Allen CR. 1982. Reservoir-induced earthquakes and engineering policy. Calif Geol. 35:248–250.
- Allen CR, St. Amand P, Richter CF, Nordquist JM. 1965. Relationship between seismicity and geologic structure in the southern California region. Bull Seismol Soc Am. 55:753–797.
- Awal R, Nakagawa H, Baba Y, Sharma RH, Ito N. 2007. Study on landslide dam failure by sliding. Koyoto: Annual report of Disaster Prevention Research Institute, Kyoto University. p. 653–660.
- Batisha AF. 2011. Cooperative shared water resources management in the Nile river basin: the engine for growth. Fifteenth International Water Technology Conference, IWTC-15; Alexandria, Egypt.
- Biswas AK, Chatterjee S. 1971. Dam disasters: an assessment. Eng J (Canada). 54:3–8.
- Brivio PA, Colombo R, Maggi M, Tomasoni R. 2002. Integration of remote sensing data and GIS for accurate mapping of flooded areas. Int J Remote Sens. 23:429–441.
- Canadian Dam Association. 2000. CDA's frequently asked questions. Canadian Dam Association Web Site. Available from: http://www.cda.ca/cda/main/newlets/fall00/faq.html.
- Costa JE. 1985. Floods from dam failures (No. 85-560). Denver (CO): US Geological Survey.
- Costa JE, Schuster RL. 1988. The formation and failure of natural dams. Geol Soc Am Bull. 100:1054–1068.
- Dewan AM, Kankam-Yeboah K, Nishigaki M. 2006. Using synthetic aperture radar (SAR) data for mapping river water flooding in an urban landscape: a case study of Greater Dhaka, Bangladesh. J Jpn Soc Hydrol Water Resour. 19:44–54.
- Dow DB, Beyth M, Hailu T. 1971. Palaeozoic glacial rocks recently discovered in Northern Ethiopia. Geol Mag. 108:53–60.
- Elmahdy SI, Marghany MM, Mohamed MM. 2016. Application of a weighted spatial probability model in GIS to analyse landslides in Penang Island, Malaysia. Geomat Nat Haz Risk. 7:345–359.
- Elmahdy SI, Mohamed MM. 2016. Mapping of tecto-lineaments and investigate their association with earthquakes in Egypt: a hybrid approach using remote sensing data. Geomat Nat Haz Risk. 7:600–619.
- Elmahdy SI, Mostafa MM. 2012b. Natural hazards susceptibility mapping in Kuala Lumpur, Malaysia: an assessment using remote sensing and geographic information system (GIS). Geomat Nat Haz Risk. 4:71–91.
- Elmahdy SI, Mostafa MM. 2013. Remote sensing and GIS applications of surface and near-surface hydromorphological features in Darfur region, Sudan. Int J Remote Sens. 34:4715–4735.
- Farr TG, Rosen PA, Caro E, Crippen R, Duren R, Hensley S, Kobrick M, Paller M, Rodriguez E, Roth L, Seal D. 2007. The Shuttle Radar Topography Mission. Rev Geophys. 45, RG2004. doi:10.1029/2005RG000183
- Gouin P, Mohr P. 1964. Gravity traverses in Ethiopian (IQterimReport). Bull Geophy Obs Addis Ababa. 55:185–239.
- Gupta HK. 2002. A review of recent studies of triggered earthquakes by artificial water reservoirs with special emphasis on earthquakes in Koyna, India. Earth Sci Rev. 58:279–310.
- Guth PL. 2009. Geomorphometry in MICRODEM. In: Hengl T, Reuter HI, editors. Geomorphometry: concepts, software, applications. Developments in Soil Science Series. Elsevier; p. 351–366.
- Hatzor YH, Goodman RE. 1997. Three-dimensional back-analysis of saturated rock slopes in discontinuous rock—a case study. Geotechnique. 47:817–839.
- International Panel of Experts (IPoE) on Grand Ethiopian Renaissance Dam Project (GERDP). Final report, 31 May 2013, Addis Ababa, Ethiopia. Available from: http://www.internationalrivers.org
- Ismail S, Mansor S, Rodsi A, Bujang BK. 2011. Geotechnical modeling of fractures and cavities that are associated with geotechnical engineering problems in Kuala Lumpur limestone, Malaysia. Environmental Earth Sciences. 62:61–68.
- Jarvis A, Rubiano J, Nelson A, Farrow A, Mulligan M. 2004. Practical use of SRTM data in the tropics: comparisons with digital elevation models generated from cartographic data. Cali: International Centre for Tropical Agriculture (CIAT) and the International Plant Genetic Resources Institute (IPGRI). (Working Document No. 198).
- Jordan G, Csillag G. 2001. Digital terrain modelling for morphotectonic analysis: A GIS framework. In Ohmori H, editor. DEMS and geomorphology. Special Publication of the Geographic Information Systems Association. Tokyo: Nihon University; p. 60–61.
- Kazmin V. 1972a. The geologyof Ethiopia. Addis Ababa: E.I.G.S. (Unpublished Report).
- Kazmin V. 1972b. Geological map of Ethiopia, 1:2,000,000 scale. Addis Ababa: Hunting Surveys.
- Massonnet D, Feigl KL. 1998. Radar interferometry and its application to changes in the earth's surface. Rev Geophys. 36:441–500.
- Merla G, Abbate E, Canuti P, Sagri M, Tacconi P. 1973. Geological map of Ethiopian and Somalia 1:2,000.000 scale. Italy: CNR.
- Mohr PA. 1962. The geology of Ethiopia. Asmara: University. College of Addis Ababa Press. (Reprinted in 1971 at the Haile Selassie I University Press); p. 268.
- Mulat AG, SA Moges. 2014. Assessment of the impact of the Grand Ethiopian Renaissance Dam on the performance of the High Aswan Dam. Journal of Water Resource and Protection. 6:583–598.
- Roth LE, Elachi C. 1975. Coherent electromagnetic losses by scattering from volume inhomogeneities. IEEE Trans Antennas Propag. 23:674–675.
- Samy I, Shattri M, Bujang BK, Ahmad RM. 2012. Application of terrain analysis to the mapping and spatial pattern analysis of subsurface geological fractures of Kuala Lumpur limestone bedrock, Malaysia. Int J Remote Sens. 33:3176–3196.
- Seed HB. 1968. Landslides during earthquakes due to soil liquefaction. Proc Am Soc Civil Eng. 94:1055–1122.
- Sherard JL, Cluff LS, Allen CR. 1974. Potentially active faults in dam foundations. Geotechnique. 24:367–428.
- Simons M, Rosen PA. 2007. Interferometric synthetic aperture radar geodesy. In: Gerald S, editor. Treatise on geophysics. Amsterdam: Elsevier; p. 391–446.
- Temesgen B, Allen RG, Jensen DT. 1999. Adjusting temperature parameters to reflect well-watered conditions. Journal of Irrigation and Drainage Engineering. 125:26–33.
- Terzaghi K. 1929. Effect of minor geologic defects on safety of dam 11. Englewood (CO): Institute of Mining and Metallurgical Engineering. (Technical Publication No. 21).
- Tesfa BC. 2013. Benefit of Grand Ethiopian Renaissance Dam Project (GERDP) for Sudan and Egypt. EIPSA Communicating Article. 1:1–12.
- Teshome N, Woldie K. 1996. Geological map of Ethiopia. Geological Survey of Ethiopia.
- Van Dijk AI, Brakenridge GR, Kettner AJ, Beck HE, De Groeve T, Schellekens J. 2016. River gauging at global scale using optical and passive microwave remote sensing. Water Resour Res. 52:6404–6418.
- Veilleux JC. 2013. The human security dimensions of dam development: the grand Ethiopian renaissance dam. Global Dialogue (Online). 15:42.
- Wakabayashi H, Osawa Y, Hamazaki T. 1996. A SAR System on ALOS. International Archives of Photogrammetry and Remote Sensing. 31:193–196.
- Yeats RS, Sieh K, Allen CR. 1997. The geology of earthquakes. New York: Oxford University Press.
- Zanettin B, Justin-Visentin E. 1974. The volcanic succession in Central Ethiopia: the volcanics of western afar and Ethiopian rift margins. Mem 1st Geol Miner University Padova. 31:l–19.
- Zhou W, Li S, Zhou Z, Chang X. 2016. Remote sensing of deformation of a high concrete-faced rockfill dam using InSAR: a study of the Shuibuya dam, China. Remote Sens. 8:255.