
 ?Mathematical formulae have been encoded as MathML and are displayed in this HTML version using MathJax in order to improve their display. Uncheck the box to turn MathJax off. This feature requires Javascript. Click on a formula to zoom.
ABSTRACT
Beginning in 2006, western United States was affected by a 11-year strong mega-drought. Among 17 western states, California was the most severely drought-affected during 2012–2015, when an area of stronger than moderate vegetation stress reached 70%. This drought had considerable impact on California's environment, economy and society. Currently, drought in the USA is monitored by the US Drought Monitor (USDM), which estimates drought area and intensity on a large area (nearly 1000 km2). California produces more than 90% of US's fruits, vegetables, berries and nuts, which are grown on relatively small areas (200–500 acres, or 0.5–2 km2). Since most of these crops are irrigated, it is important to estimate crop conditions on the area comparable to the size of the planted crop. This paper demonstrates how the new 500-m vegetation health (VH) technology (VH-500), developed from data collected by the SNPP/VIIRS satellite launched in 2011, monitors this mega-drought in California, distinguishing drought-affected area with and without irrigation and estimating drought start/end, intensity, duration, impacts and recovery from 2015–2016 El Niño.
Introduction
Beginning in 2006, the western United States was affected by the 11-year strong mega-drought (Howitt et al. Citation2015; Kogan & Guo Citation2015). In the first four years, this drought affected 45%–60% of the USA's western territory (from 95°W to the west coast); in 2010–2011, the drought area reduced slightly, still remaining slightly above 40%. Between 2012 and 2015, this drought intensified considerably and the affected area increased to 70%. This western US mega-drought (US-WMD) strongly affected the environment, economy and social life in 17 states. The environmental and socioeconomic consequences included wildfires, reduction of water in rivers, lakes and reservoirs, a strong drop in groundwater levels, irrigation constraints, agricultural production losses, ecosystem deterioration, considerable job loss, price increase for food and land and disturbances due to lack of water and food (Mathews Citation2014; Rice et al. Citation2014; CDWR Citation2015; Howitt et al. Citation2015). Compared to other catastrophic droughts since 1950, the current US-WMD, during its worst year (2012), affected 71.3% of the western USA, which is comparable to the area under the catastrophic Dust Bowl drought in 1934 (71.6%; Cook et al. Citation2014) and was much larger than the strongest droughts in 1956 (49%) and 1988 (31%). The current US-WMD is longer than the other multi-year droughts (1985–1986, 1988–1992, 1995–1996, and 2001–2003) in the western USA (Kogan & Guo Citation2015).
Among the western states, California was the most severely drought-affected, in 2012–2016, especially in 2013 and 2014, when an area of stronger than moderate vegetation stress reached 70% (Kogan & Guo Citation2015). The drought had considerable impacts on California's environment, economy, and society. Following the most recent reports (CDWR Citation2015; Hewitt et al. Citation2015), the total economic drought impact is estimated at $2.74 billion. The drought severely reduced California's surface and ground water to the level of 48% and 72% capacity, respectively (Howitt et al. Citation2015). Considerable increase in surface and ground water overdraft is estimated to have long-term impacts for the next two to three years. Since California agriculture is widely irrigated, using 52% total water supply in dry year (Hanson Citation2015), several-year drought greatly affected agriculture, leading to nearly 3% losses in crop revenue and increasing the cost of extra water pumping by 75% (Hewitt et al. Citation2015). In addition, following Hewitt et al. (Citation2015), water shortages increased the amount of drought-related idle land by 45% (currently 540,000 acres) and 21,000 total job losses. Besides agricultural losses and water depletion, California drought was one of the causes for intense wildfires with larger than before area and property damages.
Droughts in the USA are primarily monitored by the US Drought Monitor (Svoboda et al. Citation2002; USDM Citation2017), which is a drought product and is based on weekly temperature and precipitation anomaly, Palmer drought severity index (PDSI), Palmer Z index (monthly), Palmer hydrological drought index (long-term), standardized precipitation index (SPI), monthly temperature and precipitation. The USDM weather data and indices are calculated from nearly 10,000 USA weather stations data. Considering the area of the US and assuming uniform stations’ distribution, USDM drought assessments are currently monitoring drought area and intensity on approximately 1000 km² of USA territory, including California. However, considering the importance of California agriculture, which provides more than 90% of USA's fruits, vegetables, berries and nuts (MCMC Citation2015), the area of each crop planted mostly in the Central Valley is much smaller. Therefore, drought-monitoring, characterization of its damage to California's agriculture and calculation of irrigation requirements should be assessed on the area comparable to the size of the planted crops, which is 200–500 acres, or 0.5–2 km² (Bittman Citation2012).
The new operational satellite technology, which began in 2011 with the launch of Suomi National Polar-orbiting Partnership (SNPP) satellite and planned to continue for the next 25–30 years as the Joint Polar Satellite System (JPSS), has already proven to be useful for these goals (JPSS Citation2014). From the five sensors on board, the SNPP, the Visible Infrared Imaging Radiometer Suite (VIIRS) is currently capable of monitoring drought at each 500 by 500 m (0.25 km²) land surface using vegetation health (VH) system (Kogan Citation1997, Citation2001). This paper will demonstrate how 500-m SNPP/VIIRS-VH monitors the current mega-drought in California, distinguishing drought-affected area with and without irrigation and estimating drought intensity and impact. The VH drought estimates were compared with some economic indicators and were analyzed in terms of drought recovery from the recent strong El Niño, which provided above normal rainfall (CNRFC Citation2016).
VIIRS sensor and data
VIIRS is one of the main SNPP instruments (JPSS Citation2014) used for monitoring earth surface, environment and its impact on socioeconomics, including food security through drought detection, monitoring and prediction of agricultural losses (Kogan et al. Citation2015; Kogan & Guo Citation2016). The VIIRS accommodates the best technical and scientific features of its USA predecessors: 37 years of the Advanced Very High Resolution Radiometer's (AVHRR) excellent work on NOAA polar-orbiting operational satellites and 15 years of Moderate Resolution Imaging Spectra Radiometer (MODIS) on NASA/TERRA and AQUA scientific satellites. VIIRS observes the entire world (between 180°W and 180°E and between 55.152°S and 75.024°N) every day in the afternoon from its 22 reflective and emissive bands (channels). The VH and drought algorithms use three bands of 375-m spatial resolution: two imageries, I1 (visible, VIS) and I2 (near infrared, NIR), and one infrared, I5 (Kogan et al. Citation2015). Since VIIRS data volume is massive, it is collected and processed by sub-regions (granules) 45° longitude by 16.27° latitude each. VIIRS acquires 330 MB/per min data and 2.3 billion grids per day. The total number of optimally processed world grid cells is approximately 36 million at 500 by 500 m (0.25 km2) spatial resolution. VIIRS data receiving and first-level processing for VH system and drought-monitoring include the retrieval of orbital granule data, projecting from each 375-m granule pixel data to a 500-m grid's (set up as an optimal standard) orbital map. The rules were to select 375-m pixels close to the centre of the 500-m grid and close to the nadir, filling gaps, post-launch calibration of the three channels, producing daily maps for calibrated I1, I2 reflectance and I5 emission, calculating daily normalized difference vegetation index (NDVI = (I2 − I1) × (I2 + I1)−¹), conversion of I5 emission to brightness temperature (BT), producing weekly NDVI and BT maps (using NDVI's maximum value composite technique) and suppressing high-frequency noise (Kogan Citation1990, Citation1997; Kogan et al. Citation2015).
Vegetation health method
The VH method stems from properties of green vegetation to reflect sunlight and emit absorbed solar radiation. In drought-free years, vegetation is healthy and looks green (contains much chlorophyll) and vigorous (contains much water). Such vegetation has a reduced VIS and enlarged NIR, resulting in high NDVI values. Healthy vegetation emits less absorbed thermal IR radiation, resulting in lower BT and cooler canopy. Drought depresses vegetation greenness and vigour and makes the canopy hot due to an increase in VIS (following chlorophyll depletion), decrease in NIR (following a drop in water content), a reduction of NDVI and an increase in thermal IR and BT values (Cracknell Citation1997; Kogan Citation2001). VIIRS-VH algorithm contains several steps. The initial step is 375-m orbital data retrieval for VIS, NIR and IR, calibration of visible channels, calculation of NDVI from them and BT from IR cannel and development of daily 500-m maps of these indices. One of the main problems complicating operational use of NDVI and BT for environmental monitoring is considerable noise related to clouds, aerosols, water vapour, sun-sensor geometry, satellite orbit degradation and position, random errors and other. Therefore, daily maps are composited over a 7-day period keeping the pixels with the highest NDVI (Kidwell Citation1990). However, this procedure is not sufficient to eliminate high-frequency noise from NDVI and BT. Therefore, the next important step includes elimination of that noise by applying a sliding median filter to the time series of NDVI and BT (Kogan Citation1997).
The next three important steps in the algorithm development are derivation of no-noise (smoothed) NDVI and BT (sNDVI and sBT), sNDVI and sBT climatology (multi-year aggregated values) and calculation of weekly departure of weekly sNDVI and sBT from their weekly climatology. These steps are important because NDVI and BT indices contain three environmental signals: ecosystem (grassland, desert, forest, etc.), climate (multi-year mean weather) and real-time weather (precipitation, temperature, etc.). Unfortunately, the weather signal is much smaller than climate and ecosystem. Therefore, in order to estimate weather impacts on land surface, the values of climate/ecosystem contribution to these indices were eliminated. This procedure was performed following three biophysical laws: the Leibig's Low-of-Minimum, the Shelford's Low-of-Tolerance and the Principal of Carrying Capacity (Holdren & Ehrlich Citation1974; Kogan 1995, Citation2001). Since VIIRS NDVI and BT data are available for five years, only the 35-year AVHRR climatology was used. In order to do that, VIIRS weekly sNDVI and sBT data were converted to the similar AVHRR data using regression equations (Kogan et al. Citation2015). Finally, weekly VIIRS sNDVI and sBT adjusted to the corresponding AVHRR indices were normalized by weekly AVHRR-based climatology. The resulted VIIRS indices were sNDVI-based vegetation condition index (VCI), sBT-based temperature condition index (TCI) and sVegetation health index (VHI), which combines weighted VCI and TCI (EquationEquations (1)(1)
(1) –(Equation3
(3)
(3) )). VCI, TCI and VHI serve as proxy for moisture, thermal and total health conditions, respectively (Kogan Citation1990, Citation1997).
(1)
(1)
(2)
(2)
(3)
(3) where sNDVI and sBT are smoothed (without noise) weekly NDVI and BT; sNDVImax, sNDVImin, sBTmax and sBTmin are smoothed multi-year (1981–1993, 1995–2015) weekly absolute maximum (aMax) and absolute minimum (aMin), which are sNDVI and sBT climatology; i is the week number (1–52) in the annual cycle j (year), k is the raw number in a global file starting from #1 at 75.024°N, l is the column number in a global file starting from #1 at 180°W.
Since the aMax and aMin reflect the lowest and highest values of weekly sNDVI and sBT during a 35-year observation period, they characterize extreme fluctuations due to extreme weather variation between weeks and years. It is important to emphasize that both aMax and aMin represent vegetation (Kogan Citation1995). The VH interpretation follows the rules: if a particular week and year sNDVI and sBT are closer to the aMin (the lowest NDVI greenness (EquationEquation (1)(1)
(1) ) and the highest BT (EquationEquation (2)
(2)
(2) ), that indicates extreme vegetation stress; if they are closer to aMax (highest greenness and lowest BT), vegetation is very healthy. VCI, TCI and VHI change from zero, quantifying extreme vegetation stress, to 100, indicating optimal condition (Kogan Citation2001). For many agricultural crops, a reduction of VH indices below 40 correlates with a reduction of crop yield below long-term mean or trend (Kogan & Guo Citation2015, Citation2016). Therefore, the value of indices below 40 was accepted as the beginning of a drought (Kogan Citation2001). Drought intensifies when the indices decrease from 40 (mild drought) to 0 (exceptional drought). The criteria for drought intensity were established based on crop yield correlation with VH indices (Hayas & Decker Citation1996; Kogan & Guo Citation2016). The VH indices have been validated in 29 countries and used globally since the 2000s, approximating vegetation condition and productivity (VH Citation2017). VH-based drought assessments include drought start/end, area, intensity, duration, origination (either from moisture or thermal or both), crop and pasture losses, wildfire risk, malaria epidemics and drastic changes in conditions over time. This information is available real time (every week) and historically at NOAA/WEB's VH portal: http://www.star.nesdis.noaa.gov/smcd/emb/vci/VH/index.php (VH Citation2017, NOAA/STAR Citation2015).
USDM versus VH drought
Since USDM has been a primary drought-monitoring product in the USA from 1999 (USDM Citation2017), we compared its assessments of drought area and intensity with both VH-AVHRR and VH-VIIRS simulated assessments. VH drought maps are produced with 16, 4, 1, and 0.25 km² resolution (depending on global or regional applications (Kogan Citation2001)). Therefore, the lowest resolution (16 km²) of VH data was used to match with raw resolution of USDM's drought assessment. presents this comparison for mid-September 2012, when US drought intensified after a short period of slight mega-drought relief in 2010 and 2011.
Figure 1. Drought area and intensity from USDM and VH, mid-September 2012.
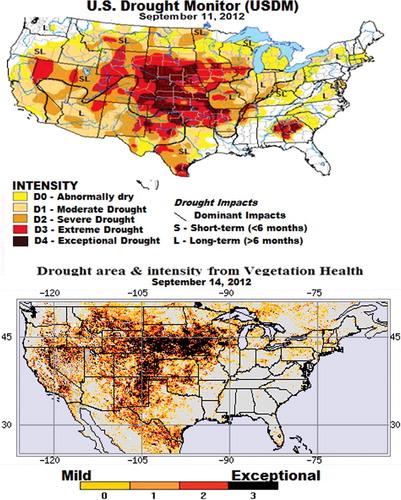
Visual comparison of the two maps shows that, in general, area and intensity of drought matched fairly well: both methods showed that in mid-September 2012, the entire western USA was drought-affected with the largest area and strongest intensity in the central portion (mid-west). However, there are also some mismatches due to the differences in the methods (Kansas, Missouri and a few smaller spots) and the most important data resolution: 16 km² VH versus USDM's 1000 km². Therefore, USDM-estimated drought area (both in all and the strongest categories) is larger compared to VH. This is evident in for states such as Oklahoma, Texas, Kansas and their neighbouring states. In some states, such as Georgia and western Alabama, severe-to-extreme drought (continued for one week only, USDM Citation2017) is not confirmed by the VH method and, in California, VH-estimated drought (especially in southern part) is stronger than from the USDM method.
500-m California drought
High-resolution drought-monitoring is especially important in the areas of irrigated crops for estimation of irrigation time and the amount of water needed, evaluation of how to redistribute water among areas in case of water shortages and an assessment of crop and grasses loss due to a reduced water supply. California is the primary state belonging to this category since nearly 20 commercial crops grown in the Central Valley require irrigation each year (Hanson Citation2015; Howitt et al. Citation2015). In drought years, especially such as the ongoing mega-drought, the amount of water used for irrigation increases considerably, requiring drought-monitoring at the highest special resolution level to determine which of the irrigated areas have good vegetation condition and which suffer from drought stress.
shows mid-July California's SNPP/VH at 500-m resolution (VH Citation2017) compared to USDM's drought assessments (USDM Citation2017) in mid-July 2012–2016, during the period of the most intensive drought since 2006. In general, both methods show an intensification of drought from 2012 to 2013–2014 and a reduction of the drought area and intensity in 2016. The comparison emphasizes how different is high-resolution VH-500 drought assessment from low-resolution USDM assessment, which ignores good conditions in irrigated areas. However, focusing on spatial details provided by the VH method, especially in the California's Central Valley (CV, the area stretching from north to south in the middle of the state) where all commercial crops are grown, there are huge differences between the two methods. While USDM estimates California as being abnormally dry (light yellow) or having moderate drought (mid yellow) all over the state in 2012 and 2013, the VH method finds a lot of areas with severely stressed vegetation (dark red). Moreover, what was the most impressive, a lot of areas, especially in the CV, are identified, where vegetation is healthy (green and light blue) and even very health (dark blue). The most important, that the blue areas are consistently continued in the same locations from year-to-year signalling about irrigated areas. There are many other differences between the two methods, such as an increase in drought area and intensity in 2015 from USDM and their reduction from VH; more intensive drought in 2016 from USDM than from VH. All of these differences indicate that data resolution plays an important role in estimation of drought dynamics in the areas, where intensive and advanced technologies (irrigation, crop orientation, crops substitutes, etc.) are used to enhance agricultural productivity.
Figure 2. California's vegetation health from 500 m SNPP/VIIRS and raw resolution USDM in early June 2012–2016.
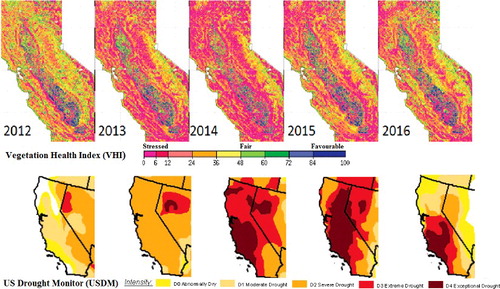
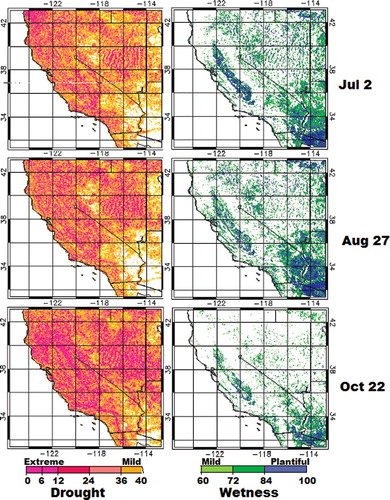
In conclusion of this section, it is important to emphasize that following VIIRS/VH-500 measurements, California's vegetation was under medium-to-exceptional stress (yellow to red colour), especially in 2013 and 2014. However, at the background of such an intensive stress, some of the 500-m areas of the CV vegetation experienced favourable conditions (green to blue colour). These assessments are fairly stable since the areas of both stressful and favourable conditions in the CV are repeated during these five years. shows how both drought and wetness conditions were progressing in 2015 from July through October (from 4 km² VIIRS/VH data). Although 2015 drought area was smaller and less intensive than in the previous two years (), 2015 vegetation stress was expanding by the end of the season both in the area and intensity (increase in red colour) and wet condition area was shrinking with milder (light green) intensity where crops were irrigated.
Figure 3. Dynamics of stressed (drought) and non-stressed (healthy) vegetation in 2015: California and surrounding states.
Drought impacts in the Central Valley from economic and VIIRS/VH-500 data
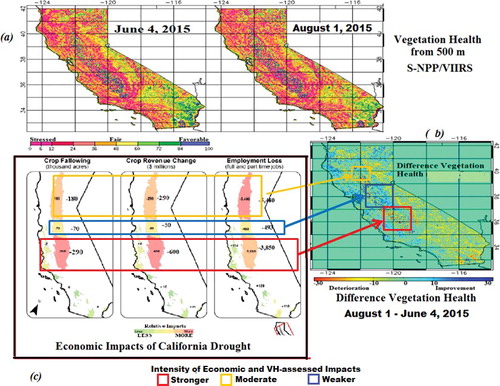
The economic impact of the recent California drought in the CV was published by Howitt et al. (Citation2015) in a comprehensive report. Following this report, the total economic impacts were assessed at $2.7 billion. Some of the most dramatic economic losses were from a 45% increase in idle land, 2.6% crop revenue loss, 21,000 job loss and considerable water decrease (10% net and 48% surface water). Following Howitt et al. (Citation2015) analysis presented in (c), drought-related economic losses were not equally distributed in the CV. The least severe drought impact is estimated in the central part of the Valley. The southern part was impacted strongly in crop revenue reduction and crop following an increase, and the northern part suffered severely from employment loss. The total impact from all losses in the CV can be summarized as follows: the strongest was in the southern part (red box in (b,c)), the weakest – in the central part (blue box, the same figures) and moderate – in the northern part (yellow box). These results were compared with a VH-500 assessment of the drought area, intensity and change between 4 June and 1 August 2015 ((a,b)). Following VIIRS/VH-500 time-series analysis, drought-related vegetation stress dominated the entire state of California, including both non-irrigated (red colour) and some of the irrigated areas (yellow and light red colour) of the CV. There is some visual deterioration of vegetation stress in August (compared to June) in southern and eastern California. However, in some of the areas, 500-m data show slight improvement of vegetation health between June and August. In order to determine deterioration/improvement for each 500-m pixel, a difference of VH-500 was taken between these two maps (August minus June). The difference map in (b) shows general similarities with the maps of economic drought impacts in (c) (Howitt et al. Citation2015), because the three areas of economic impacts in the CV ((c)) are matching with the areas of VH deterioration/improvement of vegetation stress between the two periods ((b)). Specifically, in the southern and northern parts of the CV, where the economic impact was stronger, most of the VH-500 m pixels showed deterioration of vegetation stress, while in the central part, where the economic impact was milder, half of the pixels indicate deterioration, while the other half shows some improvement due to irrigation. The same three regions were identified on the images of moisture (VCI) and thermal (TCI) conditions (not shown). In addition, the VIIRS/VH-500 changes on difference map (between August and June 2015) in southern California were related to strong thermal stress deterioration, while in the northeastern part of the state due to moisture stress.
Figure 4. Validation of VIIRS/VH-500 against economic impacts of California drought in 2015: (a) VIIRS/VHI for each 0.25 km2 pixels on June 4 and August 1; (b) VHI difference between 1 August and 4 June 2015 (the scale shows relative difference ((RD = VH_Aug − VH_Jun) × VH_Jun−¹); if VH_Aug < VH_Jun, then RD is negative: most pixels in the red box; in opposite case, RD is positive: most pixels in the blue box); (c) economic impacts of California drought (Hewits et al. Citation2015).
Vegetation health dynamics in irrigated and non-irrigated areas
We have already mentioned that at the background of a very intensive California drought during 2012–2016, VIIRS/VH-500 data showed, in addition to regions with stressed vegetation, regions with healthy vegetation conditions in the CV. The later was not unusual since nearly 7.38% of California lands, especially crops in the CV, are irrigated (USDA/ERS Citation2017, UWCD Citation2017). Unfortunately, it is difficult to find ground data on irrigated individual crops, especially in situ assessments of crop condition. Therefore, indirect indicators were used to distinguish irrigated/non-irrigated individual crop areas. The assumption was that if, during the strongest 5-year (2012–2016) California drought, in some areas, vegetation was stable and healthy each year, those areas were considered to be irrigated. The VIIRS/VH-500 data in have already demonstrated that, at the background of stressed vegetation in the CV, some areas experienced healthy conditions from week-to-week and year-to-year. This section provides VIIRS/VH-500-based weekly and seasonal analysis of the size of stressed/non-stressed areas (by different health intensities) every year for the entire CV and also for two small southern regions with all-time healthy (occupy 0.13% of the entire CV) and unhealthy vegetation (0.75%).
shows 2012–2016 time-series for the percent of areas (from the entire CV) with unhealthy (red) and healthy (green) vegetation (a) every week and (b) summer-mean (June–August) in two southern regions (% from the total area of each region). The selected southern regions with stable vegetation conditions were in size 440 km² for non-irrigated and 77 km² for irrigated. They had 2172 and 380 0.25 km² pixels, respectively. As seen in (a), the areas of vegetation stress in the entire CV were growing for summers (winter is not taken into consideration for this analysis since lower temperature reduce considerably drought impacts) from 2012 to 2014 (drought intensification) with the following reduction by 2016. This type of dynamics is typical for all levels of stress intensities in California's summer (extreme (VHI < 10) occupying 25%–50% of the area, severe-to-extreme (VHI < 15) 30%–60% and moderate-to-extreme (VHI < 35) 55%–90%). It is important to emphasize that only 25%–30% of 0.25 km² pixels in the selected region are irrigated ((b)). However, another fact should be emphasized that the dynamics of healthy vegetation (area and intensity) in the irrigated region (moderate-to-perfect (VHI > 60) 30%–35% of the region area, very good-to-perfect (VHI > 75) 18%–22% and perfect (VHI > 90) 5%–7%) remained practically stable over all five years (except a very negligible reduction during the strongest drought in summer of 2014).
Figure 5. Percent California's Central Valley area with stressed and non-stressed vegetation in 2012–2016 based on VIIRS/VH estimates: (a) weekly data, (b) mean summer (June–August) data in two southern regions irrigated and non-irrigated shown in (c), and (c) 0.25 km² VHI in California and surrounding states with the indication of the Central Valley and location of the irrigated and non-irrigated areas.
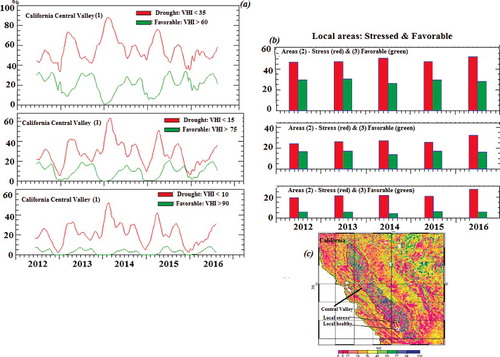
Finally, it is important to indicate that in the two small southern regions ((b)), stressful versus healthy vegetation dynamics in the areas’ size and intensity are generally similar to the entire CV. Specifically, vegetation stress area for all intensities (VHI < 35, 15 and 10) increases slightly in mid-2014 and decreases in 2015. The only difference between CV and the small stressed region is a 5%–8% increase in the area of stressed vegetation in the summer of 2016, which was probably due to local conditions. We should indicate again that favourable condition (VHI > 60, 75 and 90) areas remained stable in size from year-to-year (except small changes in 2014) for all intensities due to irrigation.
Drought recovery
During 2015, sea surface temperature (SST) in the central tropical Pacific was warmer than normal indicating a development of El Niño Southern Oscillation ((ENSO), NOAA Citation2015, NOAA Citation2016). Following ENSO, southeastern USA, including California, is normally wet and cool during December–February inducing development of healthy vegetation (Kogan & Guo Citation2016, SCCONC Citation2015, Kogan Citation2000, Ropelewski & Halpert Citation1997, Halpert & Ropelewski Citation1992). The 2015–16 El Niño triggered rains in a very dry California. Following climate data and reports (CDWR2 Citation2017; CNRFC Citation2016, ENSO Citation2015, ENSO Citation2016), during October 2015–May 2016, northern and central California received the largest amount of rains (85%–120% of normal and some of the areas up to 175%). As a result, in 2015–2016, California's reservoirs were recharged up to 186%, the State Water Resources Control Board ended water restrictions imposed during severe drought (Fears Citation2016) and water withdrawal started to increase again after 3-year continuous reduction (CDWR2). However, big rains were not distributed uniformly and, southern California, which received only 40%–60% of normal rainfall, is still experiencing shortage of water.
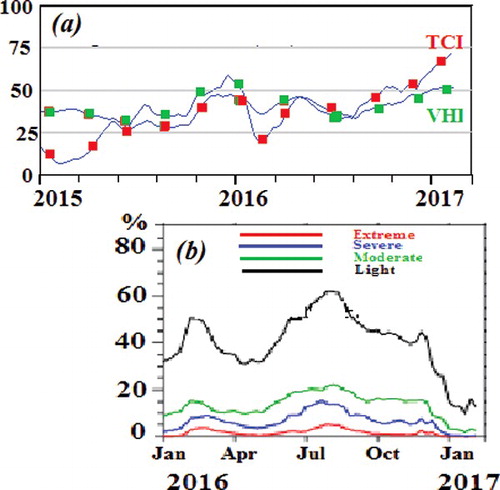
Following the 2015–2016 rains, vegetation in many California regions recovered from long stress. Although in some southern areas with a lack of rain, California vegetation was still experiencing moisture/thermal stress. Nevertheless, as follows from the later VIIRS/VH-based estimates ((a)), VHI (assessing joint moisture and thermal impacts on vegetation) shows transition from moderate-to-extreme vegetation stress (<30) in 2015 and 2016 to normal conditions in early 2017 (VHI is 50). This is happening because TCI transitioned from intensive thermal stress in 2015 (12–25) to healthy thermal conditions (TCI = 60–70) in the first two months of 2017. Following such conditions, the California's CV drought area continued to increase from 35%–40% in 2015–early 2016 to the mid-2016, reaching 65% by August ((b)). After August 2016, a downhill drought trend was observed for two to three months and, from November 2016, this downhill trend became very strong indicating a complete drought recovery in extreme and intensive-to-extreme categories. Only 20% of the CV has still remained under drought (but in light-to-moderate category) by February 2017.
Figure 6. Weekly dynamics of (a) VHI and TCI in 2015 through the beginning of 2017 and (b) area under stress of different intensity during drought recovery in 2016 through the beginning of 2017; both in California's Central Valley.
Conclusion
Beginning in 2006, western United States was affected by the 11-year strong mega-drought, which affected 40%–60% of the west (from 95°W to the west coast) during the first four years and slightly over 70% in the following four years. Among 17 western states, California was the most severely drought-affected, in 2012–2015, when an area of stronger than moderate vegetation stress reached 70%. The mega drought had considerable impacts on California's environmental, economy and society. The total economic impact of drought on California is estimated at $2.74 billion. In addition, the drought reduced 48% and 72% California's surface and ground water, respectively, due to a considerable water overdraft for agriculture.
The US Drought Monitor (USDM) is currently the primary weather-based weekly drought detection and estimation tool in the USA. Considering the total number of weather-observing stations (assuming their uniform distribution) and the area of the US, USDM assesses drought location and intensity for approximately each 1000 km² of USA territory, including California. However, considering that California agriculture provides more than 90% of USA's fruits, vegetables, berries and nuts and that all these crops are growing in the Central Valley, the area of each crop is much smaller. Therefore, drought-monitoring, characterization of its damage to California's agriculture and estimation of irrigation requirements should be assessed on the area comparable to the size of planted crops, which is 200–500 acres, or 0.5–2 km2. This paper demonstrates how 500-m SNPP/VIIRS-VH new technology, launched in 2011, monitors the current mega-drought in California, distinguishing drought-affected area with and without irrigation. In addition, this method is used for estimation of drought start/end, intensity, duration, impacts and other applications (VH Citation2017).
Five-year (2012–2016) VIIRS/VH-500 indicates that California vegetation was under medium-to-exceptional stress (yellow to red colour), especially in 2013 and 2014. However, at the background of such an intensive stress, in some of the 500-m areas of the CV, vegetation experienced favourable conditions (green to blue colour) due to applied irrigation. These assessments are fairly stable since the areas of favourable (as well as stressful for non-irrigated or less irrigated areas) conditions in the CV are repeated from year to year. Although the 2015 drought area was smaller and less intensive than in the previous two years (), 2015 vegetation stress was expanding by the end of the season both in the area and intensity (increase in red colour) and wet condition area was shrinking with milder (light green) intensity where crops were irrigated.
The VH drought estimates show general similarities with the maps of economic drought impacts in the CV. In the southern and northern parts of the CV, where economic impact was strong (in all three parameters crop fallowing, employment loss and crop revenue change), most 500-m pixels showed deterioration of vegetation stress, while in the central part where the economic impact was milder, half of the pixels indicate deterioration, while the other half show some improvement due to irrigation. This paper demonstrates advantages in using new high-resolution (500 m) satellite technology for monitoring drought area and intensity. The new technology applied to the latest multi-year, strongest California drought showed how the recent 11-year drought is monitored by the VH method for assessment of crop health in irrigated and non-irrigated areas of California and also to provide some advises on a recovery from the multi-year drought.
The year 2015 was dominated by a positive SST anomaly dynamics in the tropical Pacific, including 3.4 Niño area where this anomaly reached 3.0 °C. This was expected to create healthy vegetation conditions in the central and southern California due to expected primarily cooler and wetter weather and in the southwestern part better moisture conditions during December–February 2015/2016. Rains triggered by the 2015/16 El Niño in California distributed nonuniformly. Most of them fall in northern and central California, where vegetation recovered from moisture and thermal stress in many areas. However, southern California, where rainfall was below normal, is still experiencing shortage of water and vegetation stress.
Acknowledgments
This paper was benefitted from the excellent comments by a reviewer and editorial work by Mrs Levinson. The manuscript contents are solely the opinions of the authors and do not constitute a statement of policy, decision or position on behalf of NOAA or the US Government.
Disclosure statement
No potential conflict of interest was reported by the authors.
Related Research Data
References
- Bittman M. 2012. Everyone eats there. The New York Times Magazine [Internet]. [Oct 10]. Available from: http://www.nytimes.com/2012/10/14/magazine/californias-central-valley-land-of-a-billion-vegetables.html
- [CDWR1] California Department of Water Resources. 2015. Available from: http://www.water.ca.gov/drought
- [CDWR2] California Department of Water Resources. 2017. Available from: http://www.water.ca.gov/drought
- [CNRFC] California Nevada River Forecast Center. 2016. California climate station precipitation summary. Available from: http://www.cnrfc.noaa.gov/awipsProducts/RNOWRKCLI.php
- Cook BI, Seager R, Smerdon JE. 2014. The worst North American drought year of the last millennium: 1934. Geophys Res Lett. 41:7298–7305. doi:10.1002/2014GL061661.
- Cracknell AP. 1997. The advanced very high resolution radiometer (AVHRR). London: Taylor & Francis; p. 534.
- ENSO. 2015. ENSO: recent evolution, current status and prediction. Available from: http://www.cpc.ncep.noaa.gov/products/analysis_monitoring/lanina/enso_evolution-status-fcsts-web.pdf
- ENSO. 2016. ENSO: recent evolution, current status and prediction. Available from: http://www.cpc.ncep.noaa.gov/products/analysis_monitoring/lanina/enso_evolution-status-fcsts-web.pdf
- Fears D. 2016. Drought hasn't eased, but rules have. The Washington Post. May 29; p. A3.
- Halpert MS, Ropelewski CF. 1992. Surface temperature patterns associated with the Southern Oscillation. J Clim. 5:577–593.
- Hanson B. 2015. Irrigation of agricultural crops in California 2015. Available from: http://www.arb.ca.gov/fuels/lcfs/workgroups/lcfssustain/hanson.pdf. 45 p.
- Hayas MJ, Decker WL. 1996. Using NOAA AVHRR data to estimate maize production in the United States Corn belt. Int J Remote Sens. 17:3189–3200.
- Holdren JP, Ehrlich PR. 1974. Human population and global environment. Am Sci. 62:282–292.
- Howitt RE, MacWan D, Medellin-Azuara J, Lund JR, Sumner DA. 2015. Economic analysis of the 2015 drought for California agriculture. Davis (CA): Center for Watershed Sciences, University of California–Davis; p. 16. Available from https://watershed.ucdavis.edu/files/biblio/DroughtReport_23July2014_0.pdf
- JPSS. 2014. Joint polar satellite system, cited 2014: references. Available from: http://www.jpss.noaa.gov
- Kidwell KB. 1990. Global vegetation index user's guide. Washington (DC): US Department of Commerce. ( NOAA, 38).
- Kogan FN. 1995. Droughts of the late 1980s in the United States as derived from NOAA polar-orbiting satellite data. Bull Am Meteorol Soc. 76:655–667.
- Kogan FN. 1997. Global drought watch from space. Bull Am Meteorol Soc. 78:621–636.
- Kogan FN. 2000. Satellite-observed sensitivity of world land ecosystems to El Niño/La Niña. Remote Sens Environ. 74:445–462.
- Kogan FN. 2001. Operational space technology for global vegetation assessment. Bull Am Meteorol Soc. 82:1949–1964.
- Kogan F, Goldberg M, Schott T, Guo W. 2015. SUOMI NPP/VIIRS: improve drought watch, crop losses prediction and food security. Int J Remote Sens. 36:5373–5383. doi:10.1080/01431161.2015.1095370.
- Kogan F, Guo W. 2015. 2006–2015 Mega-drought in the western USA and its monitoring from space data. Geomatic Nat Hazards Risk. 17:2798–2814. doi:10/1080/19475705.2015.1079265.
- Kogan F, Guo W. 2016. Early twenty-first-century droughts during the warmest climate. Geomatics Nat Hazards Risk. 7:127–137. doi:10.1080/19475705.2013.878399.
- [MAMC] Map of California with Main Crop. 2015. Where does your food come from? Available from: https://search.yahoo.com/yhs/search?p=map+of+clifornia+with+main+crops&ei=UTF-8&hspart=mozilla&hsimp=yhs-001
- Mathews K. 2014. How California can survive a prolonged drought. [ cited 2014 Oct 24]. Available from: http://www.care2.com/causes/how-california-can-survive-a-prolonged-drought.html
- NOAA (Climate.gov). 2015. March 2015 ENSO discussion: El Nino is here. Available from: https://www.climate.gov/news-features/blogs/enso/march-2015-enso-discussion-el-ni%C3%B1o-here
- NOAA. 2016. Equatorial pacific sea surface temperature. Available from: https://www.ncdc.noaa.gov/teleconnections/enso/indicators/sst.php
- NOAA/STAR. 2015. Vegetation health indices. Available from: http://www.star.nesdis.noaa.gov/smcd/emb/vci/VH/index.php
- Rice D, Pompa F, Snider J. 2014. USA Today. Sept. 3.
- Ropelewski CF, Halpert MS. 1997. Global and regional scale precipitation patterns associated with El Niño/Southern Oscillation. Mon Wea Rev. 115:1606–1626.
- [SCCONC] State Climate Office of North Carolina. 2015. Global patterns - El Niño-Southern Oscillation (ENSO). Available from: https://climate.ncsu.edu/climate/patterns/ENSO.html
- Svoboda M, LeComte D, Hayes M, Heim R, Gleason K, Angel J, Rippey B, Tinker R, Palecki M, Stooksbury D, et al. 2002. The drought monitor. Bull Am Meteorol Soc. 83:1181–1190.
- [USDA/ERS] Economic Research Service. 2017. California drought: farms. Available from: https://www.ers.usda.gov/topics/in-the-news/california-drought-farm-and-food-impacts/california-drought-farms/
- [USDM] United States Drought Monitor. 2017. Available from: http://droughtmonitor.unl.edu/MapsAndData/MapArchive.aspx
- [UWCD] United Water Conservation District. 2017. December 2016 hydrologic conditions report, 2017 water year January 3, 2017. Available from: https://www.unitedwater.org/images/stories/reports/GW-Conditions-Reports/Dec%202016%20Monthly%20Hydrologic%20Conditions%20Report.pdf
- [VH] Vegetation Health Indices. 2017. Global weekly vegetation health indices and products. NOAA-WEB. Available from: https://www.star.nesdis.noaa.gov/smcd/emb/vci/VH/index.php