
ABSTRACT
In the present study, groundwater-level monitoring has been carried out on 26 observation dug wells in the Aosta Valley region, Italy, during the dry season (June 2013) and wet season (November 2013) in order to assess the water-level fluctuation (WLF). The depth to water level varied from 3.04 to 28.70 metres below ground level (mbgl) in the dry season and from 2.92 to 25.62 mbgl in the wet season. The WLF of the study area varied from 0.01 to 6.80 mbgl, and the western and north-western regions of the study area showed higher WFL. The WLF map was validated with a statistical analysis and elevation value of the area in a geographic information system environment, and this indicated that validation can be accepted for the WLF in the Aosta Valley. The results of the study demonstrated that the eastern region could be considered as a safe and good recharge zone for the groundwater in the Aosta Valley region. The WLF map generated in this study could also be used for the management of future groundwater resources and environmental planning of the area.
Introduction
Water is an essential natural resource for sustaining life and the environment which we have always considered to be available in abundance and a free gift of nature. It is also an essential ingredient of animal and plant life. Water is distributed in nature in different forms, such as river water, rain water, spring water and mineral water. Water is a human need and a precious national asset. It is required for most human activities, like drinking, cooking, bathing, washing, agriculture, industry, recreation, navigation, fisheries, etc. About 75% of the world's surface area is covered with water, out of which 97% is in the form of the ocean, not fit for human use due to its high salt content. The remaining 2% is locked in polar ice caps and only 1% is available as fresh water in rivers, lakes, streams, reservoirs and groundwater, suitable for human consumption. The global water demand is highly influenced by population growth, urbanization, food and energy security policies, and macro-economic processes such as trade globalization and changing consumption patterns (WWAP Citation2015). Over the past century, the development of water resources has been largely driven by the demands of expanding populations for food, fibre and energy. The strong income growth and rising living standards of a growing middle class have led to sharp increases in water use, which can be unsustainable, especially where supplies are vulnerable or scarce and where its use, distribution, price, consumption and management are poorly managed or regulated (WWAP Citation2015).
Groundwater makes up about 20% of the world's fresh water resource, which is about 0.61% of the entire world's water, including oceans and permanent ice. Groundwater may be considered as one of the most precious and basic needs for human existence and the survival of mankind, providing us with luxuries and comforts in addition to fulfilling our basic necessities of life (Singh et al. Citation2014). The deterioration of groundwater quality and the declining groundwater levels are the most pressing problems in many countries due to the increasing demands for water by increasing industrialization, population, urbanization and agricultural expansion (Neves & Matias Citation2008; Cidu et al. Citation2009; Bhuiyan et al. Citation2010; Verma & Singh Citation2013; Chandra et al. Citation2015; Tiwari et al. Citation2016; Verma et al. Citation2016).
Groundwater levels represent the potentiometric state of water recharge, storage and discharge of the aquifer (Conlon et al. Citation2005; Yu et al. Citation2016). Groundwater-level fluctuation depends on several hydrogeological factors, such as geology, drainage, soil, slope, elevation and other parameters (Chandra et al. Citation2015; Tiwari et al. Citation2016). Recently, several studies have been concentrating on groundwater-level fluctuation, which is challenging to the scientific community working on hydrogeological factors and groundwater resource management (Bhuiyan Citation2010; Maggirwar et al. Citation2011; Krishan et al. Citation2014, Citation2016; Chandra et al. Citation2015; Yu et al. Citation2016; Cai & Ofterdinger Citation2016; Tiwari et al. Citation2016). Groundwater-level fluctuation techniques can be used for identifying the water-level status, seasonal variation, trend of fluctuation and suitable recharge zones for groundwater management.
A geographic information system (GIS) is an effective tool for handling spatial data, zone mapping, water-level fluctuation (WLF) trend assessment, water resource management, risk assessment on environmental health problems, and for helping policy makers to take a quick decision (Stafford Citation1991; Singh et al. Citation2013; Tiwari et al. Citation2016). Recently, around the world, several researchers have used GIS techniques for the assessment of groundwater-level fluctuation and protection zone mapping (Rai et al. Citation2005; Shaban et al. Citation2006; Yeh et al. Citation2009; Chandra et al. Citation2015; Tiwari et al. Citation2016; and others).
However, while the world has achieved tremendous progress in all fields of science and technology, adequate and safe drinking water is still a distant dream for many peoples. Hence, there is a need to develop and manage the water resources of a country from a natural perspective. In Italy, Christe et al. (Citation2013) suggested that the three important points (water monitoring strategies, water-use strategies and strategies for protection against water) for a sustainable management of the groundwater resource in the mountain areas. Based on the above-suggested points, the main objective of the present study was to assess the groundwater-level risk in a GIS environment to effectively understand the seasonal variation in water level, water-level status and possible impacts (natural or anthropogenic) on groundwater level. This study also aimed to improve groundwater resource management in the Aosta Valley region, Italy, because the groundwater of the study area plays the most important role in the development of socio-economic state of the area.
Study area
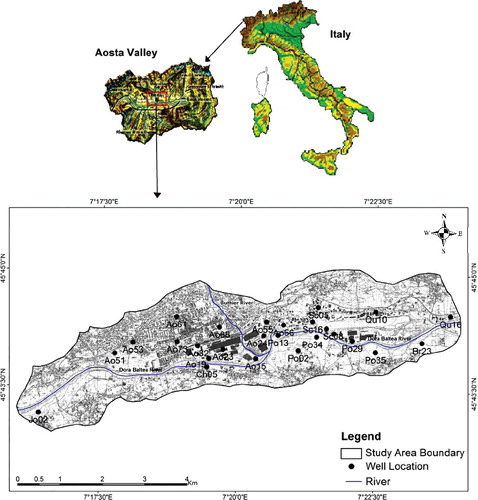
The Aosta Valley region lies in the north-western part of the Italian peninsula, located within the latitude 45°42′00″–45°46′30″N and longitude 7°17′00″–7°15′00″E (). The region is an area in the valley formed by the Dora Baltea River, which flows from east to west, and its 12 tributary valleys. It is the smallest region in Italy and one of the main alpine valley systems of the Po River, bordered by the major peaks of the Pennine and Graie Alps. The Aosta Valley region has a typical alpine climate characterized by cold winters and cool summers. Monthly rainfall reaches its highest annual peaks in the spring and autumn seasons, while the minimum annual values are recorded in the summer and winter seasons. In particular, the highest mean precipitation value by month is roughly 140 mm of rainfall, while the minimum one is 30 mm (Mercalli et al. Citation2003). The study area has one steel factory situated in the S–E part of Aosta city. Its main products are stainless steel wire rods, stainless steel bars, semi-finished products, valve steel, tool steel and atomized powders.
Figure 1. Dug well location map in the Aosta Valley region, Italy.
From the geological point of view, the Aosta Valley region, from NW to SE, is a natural cross section through the structural block of the Alps. The stacked relics of the ancient European and African continental margins, with wrecked portions of the ocean floor between them, emerge in this area of the Alps (Dal Piaz Citation1992). In particular, in the Aosta Valley region, from west to east, otherwise from the inner to the external parts of the Alps, there are several structural geological domains, such as the Elvetico-Ultraelvetico Domain, Pennidic Domain, Piemontese Zone and Austroalpine Domain.
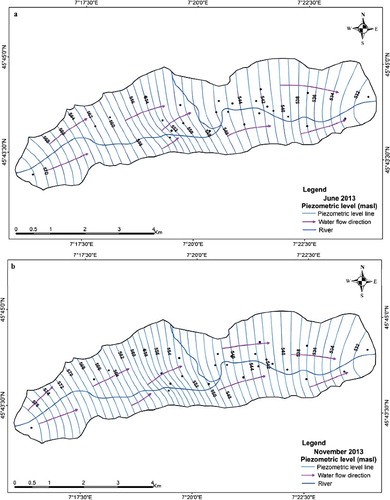
The study area belongs to the sequences of the Piedmont Zone and Austroalpine Domain. The Piedmont Zone is a great multi-layered system, widely outcropping in the middle valley, which separates the Austroalpine units from the underlying Pennidic Units (Dal Piaz Citation1992). It is mainly characterized by calc-schist, amphibolite, eclogite, metagabbros and serpentinite rocks. The Austroalpine Domain is lithologically represented by fine-grained gneiss, schists, amphibolites, marbles, eclogitic mica schists and gabbros (Regione Valle d'Aosta Citation2006). The Quaternary deposits in the study area are very recent, relative to the whole extent of the Quaternary, and they date mostly from the last Upper Pleistocenic glacial episode (Lo Russo et al. Citation2015). In the Aosta plain, Quaternary cover sheets are mainly represented by alluvial deposits, formed by rounded pebbles and gravel, with the sandy matrix, and conglomeratic levels. The Quaternary cover in the Aosta Plain also consists in surface glacial deposits (morainic deposits), mainly silts and very fine-sorted sand organized in massive banks (Dal Piaz et al. Citation2008). There are also slope and detrital deposits, derived from the physical and chemical weathering processes of rock masses, combined with the action of gravity. The main direction of groundwater flow is W–E oriented, roughly parallel to the Dora Baltea flow. The trend of the water level is generally smooth, with a maximum coinciding with July–August and a minimum in spring (March–April). The trend is highly dependent on the glacial regime of the high mountain areas and not influenced very much by meteorological events. The depth to the water level below ground level is minimal in the eastern area of the Aosta plain (<5 m in all seasons) and highest in the northern area (>20–25 m) (Regione Valle d'Aosta Citation2006). shows that the piezometric level (meter above the sea level (masl)) of the June 2013 and November 2013, as well as the water flow direction of the study area. The water flow direction of the study area is mainly west to east (W to E) direction during both the dry season and wet season, respectively.
Figure 2. Piezometric-level map with the water flow direction during (a) June 2013 and (b) November 2013 in the Aosta Valley region, Italy.
Materials and methods
In the Aosta Valley region, 26 dug wells were selected for monitoring the water level in the year 2013, during the dry and wet periods. The dry water-level data were collected in the month of June 2013, while the wet water-level data were collected in November 2013. Water-level measurement was carried out with the use of a sensor-based water-level indicator. The Digital Terrain Model (DTM) of the 2-m resolution was taken from the Aosta Valley regional authority (http://geoportale.partout.it/prodotti_cartografici/repertorio_cartografico/dtm/default_i.aspx) and transformed in GIS database to generate elevation map of the study area. This DTM data has obtained from a laser scanner aerophotogrammetric survey methodology (LIDAR). A LIDAR survey consists of a set of points which are associated coordinates (X and Y) and elevation (Z). The water-level contour and WLF map were done with the help of spatial analyst module in ArcGIS 10.2 software. Inverse distance-weighted (IDW) interpolation technique was used for spatial modelling. The piezometric-level maps with the water flow direction were prepared in the Surfer and GIS environment. The detailed methodology adopted for carrying out the research is shown in a flow chart ().
Figure 3. Methodology adopted for carrying out the research.
Results and discussion
The water-level data and statistical analysis results of depth to water level during two seasons, the dry (June 2013) and wet seasons (November 2013), are provided in .
Table 1. Monitoring well locations, depth to water level data and summary statistics of the water level in the Aosta Vally for the year 2013.
Depth to water level
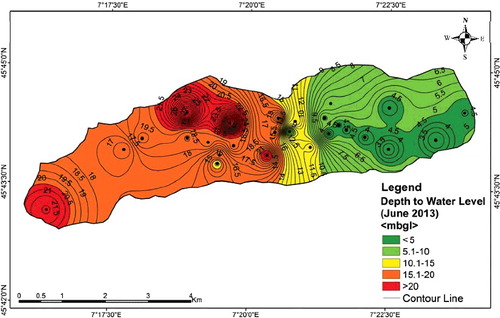
A total of 26 wells were monitored to assess the trend of WFL in the study area. These wells were monitored in the dry and wet seasons. In the dry season, the depth to water level varied from 3.04 to 28.70 metres below ground level (mbgl), with an average value of 12.89 mbgl. The lower (<5 mbgl) and medium (5.1 to 10 mbgl) depth to water level values were observed in the eastern region of the study area. However, from moderate (10.1–15 mbgl) to high (15.1–20 mbgl) values were found in the central, north-west and western regions of the area. In contrast, very high (>20 mbgl) values were observed in the few places of the western, northern and central regions of the study area ().
Figure 4. Depth to water level map during the dry season in the Aosta Valley region, Italy.
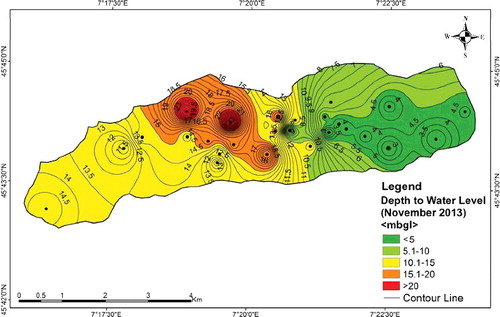
On the other hand, during the wet season, the depth to water level ranged from 2.92 to 25.62 mbgl (avg. 10.77 mbgl). In general, we observed similar level to the dry season, the lower (<5 mbgl) and medium (5.1–10 mbgl) depth to water level values in the eastern region and from moderate (10.1–15 mbgl) to high (15.1–20 mbgl) values in the central, northwest and western regions of the area. However, very high (>20 mbgl) values were observed in the few places of the northern and central regions in the Aosta Valley (). When comparison of the contour maps for the dry and wet periods was made in GIS environment, a deep water level during the dry period was observed.
Figure 5. Depth to water level map during the wet season in the Aosta Valley region, Italy.
Water-level fluctuation
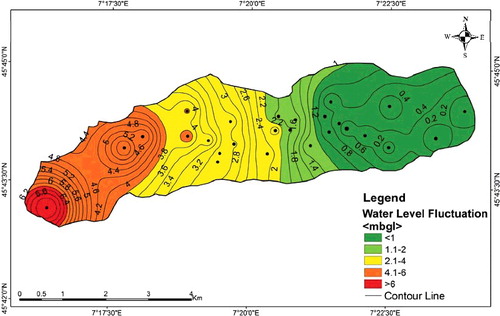
The water level is one of the most important parameters to understand the groundwater availability status of any area, and WLF plays a significant role in evaluating the trend of groundwater level. The WLF of the study area varied from 0.01 to 6.80 mbgl with an average value of 2.12 mbgl (). We found very low (<1 mbgl) to low (<2 mbgl) WLF in dug wells of the eastern and some central regions (). We observed medium (2.1–4 mbgl) WLF in dug wells located in the central region of the Aosta Valley (). However, high (4.1–6 mbgl) and very high (>6 mbgl) WLF in dug wells located in the western, north-west and northern regions () may be due to the hydrogeological parameters such as high piezometric level and the water flow direction (W to E) of the study area (). The study showed that the western and north-west regions were facing extreme water scarcity due to lower availability of the groundwater and medium water scarcity in the central region of the study area. However, the eastern region of the Aosta Valley had sufficient available groundwater resources.
Figure 6. Water-level fluctuation map in the Aosta Valley region, Italy.
Potential risk related to water level
A recent study of the Aosta Valley (the study area of the present research) by Bonomi et al. (Citation2015) studied the groundwater flow and transport modelling of the contamination. They reported that maximum Cr(VI) concentrations in the groundwater at the central part (some piezometers inside the steelwork area in the Aosta town), some piezometers located in the southern and eastern parts of the Aosta Valley region (area of yellow and light green colour in ). Similarly, in our earlier work of the Aosta Valley region, Tiwari and De Maio (Citation2017) support that the groundwater of the area (area of yellow and light green colour in ) has high Cr(VI) concentrations and exceeded the regulatory drinking water limit of 5 µg L−1 (Legislative Decree no. 152/06 (Citation2006)). Tiwari and De Maio (Citation2017) suggested that human consumption of the groundwater in these areas of the Aosta Valley presents a potential cancer risk.
The aquifers of the Aosta Valley region have a high vulnerability to pollution (De Maio et al. Citation2010). Bonomi et al. (Citation2015) observed that the Cr(VI) contamination in the groundwater due to the leaching of superficial slag deposits has accumulated for decades in a deregulated way in the Aosta Valley region. Also, Bonomi et al. (Citation2015) suggested the water flow direction (W to E) and drainage effect of the Dora Baltea River was transported Cr(VI) contamination in the water resources of the area. The piezometric-level maps with the water flow direction (W to E) of the study area () during June 2013 and November 2013 were verified by the WLF as well as previous observations of the area.
Validation of results
The WLF map was validated with the elevation map of the study area. The reason behind the selection of the elevation map was that the elevation is one of the most important hydrogeological parameters, and it plays an important role in the WLF of any area. Previous studies by Bhuiyan (Citation2010), Chandra et al. (Citation2015) and Tiwari et al. (Citation2016) indicate that the elevation has a direct influence on the WLF. shows that the dug wells lie in the high elevation and this closely matched the high WLF () in the Aosta Valley region. It was observed that the western and north-western regions had high elevation values (576–600 m), and these regions stretched out in the high groundwater-level fluctuation. From statistical analysis of the elevation classes as shown in , it can be observed that higher WLF values of mean and median have shown high (576–600 m), medium (551–575 m) and low (<550 m) elevations, which indicates a positive correlation between the elevation and WLF. This clearly demonstrates that elevation validation can be accepted for the WLF in the Aosta Valley, Italy.
Figure 7. Elevation map of the Aosta Valley for validation of water-level fluctuation.
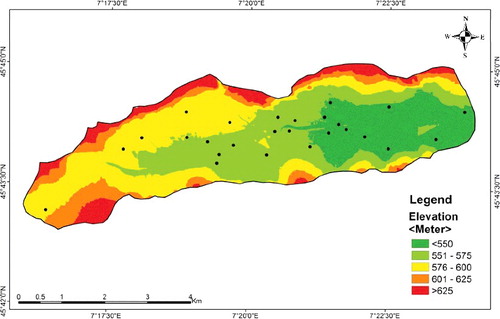
Table 2. Statistical analysis of WLF for elevation.
Conclusion
GIS-based maps proved to be an important asset for the assessment of groundwater-level risk, WLF, seasonal trend variation and validation of results. The WLF map shows that the bulk of the area was covered by low WLF followed by medium WLF. The eastern region of the study area had lower WLF. However, the western and north-western regions had higher WLF in the Aosta Valley. The high WLF in the Aosta Valley region was attributed to the hydrogeological parameters.
As per the previous studies by Bonomi et al. (Citation2015) and Tiwari and De Maio (Citation2017), the central region (yellow and light green colour in ) of the Aosta Valley was contaminated with Cr(VI) and had a potential risk to human health. This environmental problem is directly related to groundwater level as well as the water flow direction of the area. Thus, from a suitable groundwater management point of view, the eastern region (dark green colour in ) was considered as a safe and good recharge zone for the groundwater in the Aosta Valley. Finally, this research suggests that a groundwater qualitative and quantitative monitoring programme should be performed at an interval of every 6 months or less as per the local climatic conditions for proper groundwater management of the area.
Acknowledgments
The data were collected as part of a project drawn up between Politecnico di Torino and Aosta Valley regional authority. The authors are grateful to the Department of Environment & Territory and the Department of Public Work, Soil Conservation & Public Housing of the Aosta Valley regional authority for their support and assistance during the field survey and for allowing publication of the data. The author's hearty thanks to the editor and anonymous reviewers for their valuable suggestions on how to improve the manuscript.
Disclosure statement
No potential conflict of interest was reported by the authors.
Related Research Data
References
- Bhuiyan C. 2010. Hydrogeological factors: their association and relationship with seasonal water table fluctuation in the composite hardrock Aravalli terrain, India. Environ Earth Sci. 60:733–748.
- Bhuiyan MA, Islam MA, Dampare SB, Parvez L, Suzuki S. 2010. Evaluation of hazardous metal pollution in irrigation and drinking water systems in the vicinity of a coal mine area of northwestern Bangladesh. J Hazard Mater. 179:1065–1077.
- Bonomi T, Fumagalli L, Stefania GA, Rotiroti M, Pellicioli F, Simonetto F, Capodaglio P. 2015. Groundwater contamination by Cr (VI) in the Aosta Plain (northern Italy): characterization and preliminary modeling. Rend Online Soc Geol It. 35:21–24.
- Cai Z, Ofterdinger U. 2016. Analysis of groundwater-level response to rainfall and estimation of annual recharge in fractured hard rock aquifers, NW Ireland. J Hydrol. 535:71–84.
- Chandra S, Singh PK, Tiwari AK, Panigrahy B, Kumar A. 2015. Evaluation of hydrogeological factor and their relationship with seasonal water table fluctuation in Dhanbad district, Jharkhand, India. ISH J Hyd Eng. 21:193–206.
- Christe P, Amanzio G, Suozzi E, Mignot E, Ornstein P. 2013. Global warming in the Alps: vulnerability and climatic dependency of alpine springs in Italy, Regione Valle d'Aosta (Italy) and Canton Valais (Switzerland). Eur Geologist. 64–69.
- Cidu R, Biddau R, Fanfani L. 2009. Impact of past mining activity on the quality of groundwater in SW Sardinia (Italy). J Geochem Explor. 100:125–132.
- Conlon TD, Wozniak KC, Woodcock D, Herrera NB, Fisher BJ, Morgan DS, Lee KK, Hinkle SR. 2005. Ground-water hydrology of the Willamette Basin, Oregon. U.S. Geological Survey; p. 83 (Scientific Investigations Report 2005–5168). Available from: http://pubs.usgs.gov/sir/2005/5168
- Dal Piaz GV. 1992. Alpi dal monte bianco al lago maggiore. guide geologiche regionali. Vol. 3, Societa Geologica Italiana. BE-MA Editrice..
- Dal Piaz GV, Gianotti F, Monopoli B, Pennacchioni G, Tartarotti P, Schiavo A. 2008. Carta geologica d'Italia [Description report]. Chatillon: Serv Geol It Roma. ( Scale 1:50.000, n. 91).
- De Maio M, Minucci F, Nocerino G. 2010. Evaluation of the groundwater global pollution risk: relationships with territorial planning. Am J Environ Sci. 6:102–114.
- Krishan G, Lohani AK, Rao MS, Kumar CP, Takshi KS. 2016. Groundwater fluctuation and trend in Amritsar, Punjab, India. In: Janardhana Raju N, editor. Geostatistical and geospatial approaches for the characterization of natural resources in the environment. Springer International Publishing; p. 183–187.
- Krishan G, Rao MS, Loyal, RS, Lohani, AK, Tuli NK, Takshi KS, Kumar CP, Semwal P, Kumar S. 2014. Groundwater level analyses of Punjab, India: a quantitative approach. Octa J Environ Res. 2:221–226.
- Legislative Decree. 2006. 3 aprile 2006, n. 152 - Norme in materia ambientale - (G.U. n. 88 del 14 aprile 2006)- Allegato 4/14 - Allegato 5 al Titolo V della Parte quarta: Valori di concentrazione limite accettabili nel suolo e nel sottosuolo riferiti alla specifica destinazione d'uso dei siti da bonificare
- Lo Russo S, Amanzio G, Ghione R, De Maio M. 2015. Recession hydrographs and time series analysis of springs monitoring data: application on porous and shallow aquifers in mountain areas (Aosta Valley). Environ Earth Sci. 73:7415–7434.
- Maggirwar BC, Umrikar BN. 2011. Influence of various factors on the fluctuation of groundwater level in hardrock terrain and its importance in the assessment of groundwater. J Geol Min Res. 3:305–317.
- Mercalli L, Cat Berro D, Montuschi S. 2003. Atlante climatico della Valle d'Aosta [Climate atlas of the Aosta Valley]. Torino: Società Meteorologica Subalpina; p. 405.
- Neves O, Matias MJ. 2008. Assessment of groundwater quality and contamination problems ascribed to an abandoned uranium mine (Cunha Baixa region, Central Portugal). Environ Geol. 53:1799–1810.
- Rai B, Tiwari A, Dubey VS. 2005. Identification of groundwater prospective zones by using remote sensing and geoelectrical methods in Jharia and Raniganj coalfields, Dhanbad district, Jharkhand state. J Earth Syst Sci. 114:515–522.
- Regione Valle d'Aosta. 2006. Piano regionale di tutela delle acque PTA: Relazione generale [Regional water management plan PTA: General report].
- Shaban A, Khawlie M, Abdallah C. 2006. Use of remote sensing and GIS to determine recharge potential zones: the case of occidental Lebanon. Hydrogeol J. 14:433–443.
- Singh PK, Tiwari AK, Panigarhy BP, Mahato MK. 2013. Water quality indices used for water resources vulnerability assessment using GIS technique: a review. Int J Earth Sci Eng. 6:1594–1600.
- Singh P, Tiwari AK, Singh PK. 2014. Hydrochemical characteristic and quality assessment of groundwater of Ranchi township area, Jharkhand, India. Curr World Environ. 9:804–813.
- Stafford DB. 1991. Civil engineering applications of remote sensing and geographic information systems. New York: American Society of Civil Engineers.
- Tiwari AK, De Maio M. 2017. Assessment of risk to human health due to intake of chromium in the groundwater of the Aosta Valley region, Italy. Hum Ecol Risk Assess. Available from: https://doi.org/10.1080/10807039.2017.1308813
- Tiwari AK, Singh PK, Chandra S, Ghosh A. 2016. Assessment of groundwater level fluctuation by using remote sensing and GIS in West Bokaro coalfield, Jharkhand, India. ISH J. Hyd. Eng. 22:59–67.
- Verma DK, Bhunia GS, Shit PK, Kumar S, Mandal J, Padbhushan R. 2016. Spatial variability of groundwater quality of Sabour block, Bhagalpur district (Bihar, India). Appl Water Sci. doi: 10.1007/s13201-016-0380-9.
- Verma AK, Singh TN. 2013. Prediction of water quality from simple field parameters. Environ Earth Sci. 69:821–829.
- [WWAP] United Nations World Water Assessment Programme. 2015. The United Nations World Water Development report 2015: water for a sustainable world. Paris: UNESCO
- Yeh HF, Lee CH, Hsu KC, Chang PH. 2009. GIS for the assessment of the groundwater recharge potential zone. Environ Geol. 58:185–195.
- Yu X, Ghasemizadeh R, Padilla IY, Kaeli D, Alshawabkeh A. 2016. Patterns of temporal scaling of groundwater level fluctuation. J Hydrol. 536:485–495.