
 ?Mathematical formulae have been encoded as MathML and are displayed in this HTML version using MathJax in order to improve their display. Uncheck the box to turn MathJax off. This feature requires Javascript. Click on a formula to zoom.
ABSTRACT
This study describes the use of inventory-based landslide susceptibility index (LSI) models based on the selection of causative factors, functional relationships between factors and integration to a hazard-warning model. We first merged landslide inventory data of five typhoon-training events and obtained sets of data representing environmental conditions where landslides are likely to occur. These well-defined data sets are used to select five representative causative factors, i.e. the slope angle, rock strength, drainage, curvature and soil type. Four bivariate statistical model combinations were tested: the linear combination, geometric mean, and two other mixed combinations. As a result, the modulation effects between (i) rock strength and slope and (ii) drainage and curvature were intensified in mixed model 2 (MX2) through factor multiplication. The MX2 LSI was integrated with three multivariate landslide hazard-warning models and tested with four triggering factor rainfall parameter sets. Results lead to the conclusion that threshold models with terrain-influenced rainfall can better identify hazard-warning locations. Modulating factor combinations for the hazard warning can also mirror true environmental conditions, yielding more representative model results. This study improves the method for identifying LSI models for the application to rainfall-triggered landslide hazard models.
1. Introduction
Landslides are one of the greatest geological problems facing Taiwan, which occur in mountainous terrain during heavy precipitation events. Complex geology, frequent tectonic activity and high-relief mountains are important factors contributing to frequent landslides (Hovius et al. Citation2000). Heavy rainfall events and typhoon activities act as the triggering point for environmental conditions susceptible to landslides in mountainous terrain. Although acting independent from each other, the combination of the two factors can initiate rapid, high-magnitude slope failures. Therefore, both the causative land condition factors and the rainfall-related triggering factors are equally important in the evolution of landslides in Taiwan. Likewise, the implementation of risk reduction programmes in Taiwan is necessary due to the uncertainties related to natural disasters (Chen et al. Citation2010). For this reason, the identification of landslide-prone areas is critical to the safe land management to reduce damages and losses of lives and properties.
Landslide susceptibility assessments use regional landslide prediction models to determine ‘where’ landslides are likely to occur over a specific region based on a set of environmental factors (Guzzetti et al. Citation1999). To date, assessing landslide susceptibility can be categorized into: (1) landslide inventories, (2) heuristic methods, (3) statistical approaches and (4) deterministic methods (Carrara et al. Citation1991; Ermini et al. Citation2005). Bivariate statistical approaches use individual statistical analysis of each parameter related to landslide activity using weights of evidence (Lee and Choi Citation2004; Dahal et al. Citation2008; Neuhäuser et al. Citation2012). Multivariate statistical assessments identify the weights of landslide causative factors based on the input from each in the presence or absence of past landslide activity within a land unit (Dai et al. Citation2001; Suzen and Doyuran Citation2004; Ayalew and Yamagishi Citation2005). Specifically, many models developed are based on the statistical relationships between inventory data and the combined effects of instability factors. The model reliability depends on the relevance of factors selected, data representativeness, and the functional combinations of these factors.
Therefore, the selection of causative factors is a key procedure in functional, stochastic or statistical methods for landslide susceptibility assessment (Guzzetti et al. Citation1999). However, there is no clear interpretation between causal factors and triggering factors. In previous studies, the procedure of differentiating factors often investigated the statistical relationships between factors and landslide data, and the abundance of factors used in related works. Statistical analysis focuses on the assessment method over trying to understand the causative factors of landslides (Lee et al. Citation2002; Lee et al. Citation2004; Rosca et al. Citation2016). Although such systematic methods provide advantages, such as unbiased factor selection and weighting, there are also disadvantages in that geoscience and geotechnical expertise may be overlooked in such assessments (Fourniadis et al. Citation2007a). As a result, many input parameters do not correlate to true environmental conditions, making each less suitable for modelling areas sensitive to factors such as slope, rock strength, basin morphology and rainfall duration and intensity. Few statistical studies examine the nature or appropriateness of each factor selected and how those selected variables enhance the model performances.
The combination of triggering factors are determined statistically which have resulted in landslides and quantitative predictions are made for areas free of landslides but have similar conditions (Papathanassiou et al. Citation2013). Factor combinations, although an important function of model development, have not been extensively studied to determine better combinations which reflect true environmental conditions. Identifying and modifying factor combinations based on their physical relationship are important for the reason that as the function strengthens or weakens, the representative factors remain and eliminates misclassified parameters.
The main objective of this study is to identify and evaluate the component factors and form the functional combinations based on the available multi-event landslide inventory data for constructing inventory-based susceptibility models. This method assumes causative and triggering factors as independent parameters. Subsequently, the Actual Information of Landslide (AIL), representing true environmental conditions, is used to develop the landslide susceptibility index (LSI) model on the premise that highly sensitive areas show greater influence by triggering factors. The Changing Information of Landslides (CIL), developed based on the changes detected in landslide areas after a typhoon event, is combined with the suited LSI model, and three multivariate hazard-warning models to test the hazard warning performance based on four weighted rainfall scenarios. More importantly, this straightforward approach illustrates the functionality of assessing landslide potential based on (i) the landslide susceptibility and (ii) the strength of rainfall values as the landslide-triggering mechanism.
2. Material and methods
2.1. Study area
The study area is located at the central portion () of the Gaoping River Basin (Zones A, B and C) along the Laonong and Jhoukou Rivers, both of which are tributaries of the Gaoping River. The highest density of landslide activity in the Gaoping River basin is found in the present study area. Additionally, the area is the home of remote aboriginal settlements and is a designated drinking water source protection area. Approximately 80% of annual precipitation (2500 mm) is concentrated in the summer typhoon season (June to September), which is impacted by the southwesterly flow, creating torrential rainfall events on the windward sloping terrain (Lee et al. Citation2006). Importantly, capturing a single swath-cloud-free image during the summer rainy season is difficult for all satellites due to the persistent cloud cover, particularly during and after a typhoon event. Even the daily revisiting satellite such as Formosat 2 has difficulties acquiring cloud-free images. Since only part of the study area was cloud-free for the selected typhoon events, three zones were used in order to collect more event-based imagery to develop the landslide-warning model. Although three test zones can cover the entire study area, some overlapping occurred (), with only part of the study area analyzed for each cloud-free event.
Figure 1. The geographical location of the study area, with merged landslides of the five training events (AIL) overlapping on FS-2 images taken on 2005/7/10 (Zone A), 2007/9/1 (Zone B), and 2010/11/21 (Zone C).
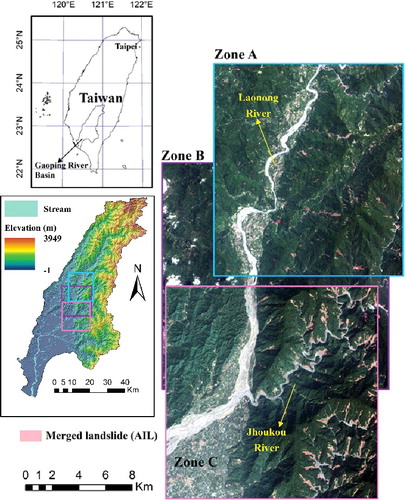
Table 1. Image acquisition dates and details of the typhoon events used in development of Actual Information of Landslide (AIL) and Changing Information of Landslide (CIL).
The Laonong River divides the study area with undulating terrain to the west. The eastern segment exhibits a sudden transition to mountains ranges oriented in the northeast–southwest facing mountain ranges comprising steep sloping short-order sub-basins. The major lithological formations include slate, shale, sandstone and siltstone. Shallow, underdeveloped soil types ((e)) dominate the steep sloping terrain, with alluvial soils forming lower slopes and valley floors.
2.2. Landslide inventory
Pre- and post-event images of six typhoon events () were collected from the imagery archive of Formosat-2, processed to 2 m resolution and orthorectified for landslide interpretation by the application of Formosat-2 Automatic Imager Processing System (F-2 AIPS) (Liu Citation2006; Liu et al. Citation2007). The daily revisit capabilities of Formosat-2 allowed image acquisition within days before and after each typhoon event, resulting in a high number of images obtained for the study area, creating an accurate representation of disturbances caused by an individual storm. The combination of expert and statistical analysis, which integrates spatial data to assist in identifying landslide areas efficiently and accurately, was employed to the inventory landslide data from the orthorectified images. This approach produced event-based landslide maps, using an automated classification system for non-vegetated areas (Liu et al. Citation2011), shadow areas (Liu Citation2015), and manual identification of landslides from sloping non-vegetated areas (GIS data, aerial photos) to select landslide source areas. With this procedure, deep seated and shallow landslide areas were identified. Importantly, in our study area, 70% of rainfall-induced landslide disasters, which pose a danger to lives and property, are classified as shallow landslides (Chien et al. Citation2013). In this case, the dominant movement type, based on Varnes (Citation1978), is identified as translational slides (Chen et al. Citation2015).
The environmental conditions which led to past and present slope movements are assumed to have a higher likelihood of landslide activity, and therefore all landslide polygons (pre- and post-event landslides) of five typhoon events were merged () for the dataset named ‘Actual Information of Landslide’ (AIL). The AIL data was used to determine the information values (IFVs) for the instability factors. A ‘Changing Information of Landslide’ (CIL) dataset was produced by detecting the positive changes between landslides interpreted from imagery taken before and after a single typhoon event, which was used to acquire both IFV and the weighted factor of rainfall. It is important to note that for each typhoon event, only one test zone was available, and therefore no overlapping polygons were counted. A total of 2766 landslide polygons were identified, with a density of 3.2%, range of 1000–237,056 m2 and a standard deviation of 19,466 m2.
2.3. Factor selection
2.3.1. Causative factors
The selection procedure of causative factors (instability factors) for landslide susceptibility assessment is based on investigating the abundance of factors used in the literature and the availability of GIS layers for calculation of factors (Conoscenti et al. Citation2008; Lee et al. Citation2008; Jadda et al. Citation2011). Factor importance was based on the interpretation of the statistical relationships between factors and landslide inventories. The causative/instability factors selected in statistical modelling for landslide susceptibility analysis (Lan et al. Citation2004; van Westen et al. Citation2008) can be categorized as follows: (a) geology and soil properties, (b) topographic features derived from digital elevation, (c) hydrology properties and (d) position effects.
Based on a comprehensive article review, 10 among more than 50 variables were selected. The most frequently selected causative factors are (1) rock mass strength (lithology), (2) soil types, (3) slope gradient, (4) total curvature, (5) slope aspect, (6) elevation, (7) distance to stream (stream buffer), (8) distance to major fault, (9) distance to road, and (10) land cover/land use. GIS maps allowed for a detailed statistical assessment of the temporal and spatial distribution of landslides using the 10 parameters. Three parameters selected from position effects, e.g. factors (8) to (10), were eliminated after checking the association between landslide inventory and parameter classes in this study. Correlation analysis indicates that areas near faults or roads have a negative site effect, which may be partly due to the application of road revetment engineering, while earthquakes are not major factor for landslides activity in our study area.
Elevation and slope aspect are often selected as predictors or causative variables for landslide susceptibility assessment (Lan et al. Citation2004; Lee and Pradhan Citation2006; Lee et al. Citation2008). This is the case when factors are statistically selected, which does not represent the true environmental conditions and therefore does not make sense to include those factors. Guided by spatiotemporal distribution of landslides on satellite imagery (), certain slope aspects and range of elevations in the study areas are struck by the Southwest monsoon rainfall. The landslide susceptibility in such areas indirectly increases by relatively higher rainfall due to terrain effects, rather than the factor itself. Therefore, aspect and elevation () are considered apart of the triggering factors, influencing the distribution of rainfall, which is described in Section 2.3.2. As a result, among the 10 factors evaluated, five were chosen as causative parameters, including (1) rock strength, (2) slope, (3) curvature, (4) drainage and (5) soil, as shown in . The processing and analysis for each susceptibility factor and landslide polygon was based on the resolution of DEM map (20 × 20 m grid-cell units). Theoretically (as a rule of thumb), the resampling of a landslide polygon from 2 to 20 m using the nearest neighbourhood method had a maximum spatial error of one-half the cell size. Such resampling error is analyzed in Section 3.1.1.
Figure 2. The spatial distribution of CIL (the detected change in landslides after a typhoon event) and AIL (the merge of pre- and post-event landslides) in (a) Zone A during typhoon Haitang, (b) Zone B during typhoon Sepat, and (c) Zone C during Fanapi.
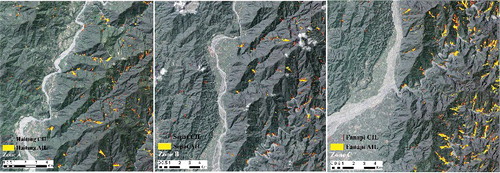
Figure 3. The five selected causative factors (a) lithological units, (b) rock strength, (c) slope, (d) curvature, (e) soil type, (f) drainage, and triggering factors, (g) elevation and (h) slope aspect for the study area (projection: Taiwan datum 1997, abbreviated as TWD97).
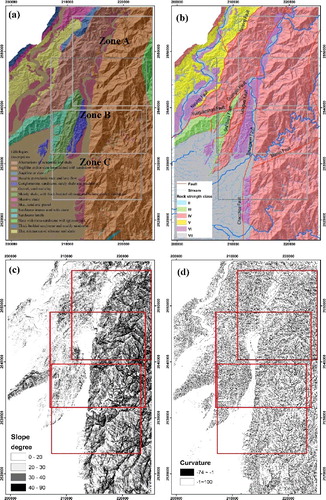
From the Central Geological Survey of Taiwan's rock strength classification system (modified after Franklin (Citation1986)), the study area consists of medium strength rock (type IV) at mid to high elevations, and the weakest strength rock (type VII) on low-gradient terrain near the active river channel ((b)). Undulating bands of weak rock (type VI) and medium-strength rock (type IV) comprise the western portion.
Maps of slope angle ((c)), slope aspect ((h)), and curvature ((d)) were obtained from a 20-m resolution DEM provided by the Forest Bureau of Taiwan. Soil types were grouped according to the Soil Water Conservation Bureau (SWCB) classification. Underdeveloped soil types ((e)) dominate mid-elevation segments (lithosol and incipient yellow soil), while shallow (alluvial and colluvial) soils comprise the lower elevations. High rainfall values and steep sloping riverbanks cause the landslide density to be particularly high within the stream influence area (stream buffer) of the study region. The stream influence area is characterized by GIS factors such as the distance to a stream (Yalcin Citation2008) and the order of a stream (Guzzetti et al. Citation2006) in estimates of landslide susceptibility. In this study, two factors are combined into one stream buffer factor by reclassifying the distance according to order of stream. The distance from drainage ((f)) (streams or rivers) with a range of 100, 200, 400 and 800 m and orders of 1–2, 3–4, 5–6, and 7 are reclassified as stream buffer zones, respectively.
2.3.2. Triggering factors
Rainfall is the primary triggering factor of landslides in Taiwan and key information for hazard prevention and mitigation. Rainfall characteristics such as the rainfall intensity–duration (Larsen and Simon Citation1993), maximum-hourly rainfall, and maximum accumulated rainfall during a period of time have been analyzed to indicate the critical condition or triggering threshold value, that if exceeded, a landslide will very likely to occur (Rosca et al. Citation2015). The threshold of rolling 24-h rainfall predicted by the Central Weather Bureau of Taiwan (CWB) was adopted by the SWCB as the decision factor for issuing debris flow warnings and evacuation orders, which ranges from 200 to 600 mm depending on the vulnerability of the areas (SWCB Citation2014).
The duration of continuous rainfall that may trigger landslides is commonly reported to be one to several hours in Taiwan (Chang et al. Citation2008). Short yet intense rainfall events in Taiwan are mostly concentrated during the typhoon season, while the antecedent condition is common at a high susceptibility state, such as the higher level of soil moisture and shorter interval between events. Therefore, the SWCB threshold of rolling 24-h rainfall is appropriate as an indicator of evacuation rather than a critical value for triggering landslides. Subsequently, a maximum rolling 3-h and 6-h rainfall of the study areas is used as the rainfall-triggering factor R3 and R6, respectively.
Following the ‘modulation’ concept, two additional triggering factors, which consider the influence of terrain, were formulated:(1)
(1)
(2)
(2) where TR3 and TR6 are the maximum 3-h and 6-h terrain-influenced rainfall, with Wasp and Welev as weighted aspect and elevation values, respectively. The hourly rainfall data was collected from the QPESUM (quantitative precipitation estimation and segregation using multiple sensors) system, which collects data from a network of four Doppler radars to determine rainfall field and depth (Chen et al. Citation2007). The data was compared to neighbouring gauge stations, with abnormalities omitted and finally interpolated into 20 m × 20 m grid cells.
2.4. Identification of inventory-based statistical models
2.4.1. Bivariate statistical mapping (quantitative spatial analysis)
Bivariate and multivariate analyses are data-driven, quantitative and statistical modelling approaches commonly used for landslide susceptibility assessment (Nandi and Shakoor Citation2010; Schicker and Moon Citation2012). The multivariate method determines the weights of causative/triggering factors based on the relative contribution of each on the occurrence of landslide (Guzzetti et al. Citation1999). The major difference in bivariate approaches is that the influence of each variable is evaluated independently before they are combined to form a unique LSI. The so-called ‘influence’ in bivariate approaches can be quantified by several ways, such as the probabilistic frequency ratio (PFR) (Lee and Pradhan Citation2006), weight of evidence (WOE) (Sujatha et al. Citation2014) and IFV (Cevik and Topal Citation2003). All of these methods were based on the assumption that the predictive (causative) factors are conditionally independent of each other and possible conditional or posterior probabilities exist with regard to landslide occurrence (Schicker and Moon Citation2012).
Under the assumption that future landslides will be more likely to occur on areas where the environmental conditions led to actual landslides, the AIL dataset was used to calculate the IFV for each parameter classes. The overall landslide probability of the AIL layer is 1.21% (P(L)), obtained by dividing the merge of 16,180 landslide pixels with the entire 1,337,895 pixels study area. First, the conditional probability of landslide for a given parameter class is calculated as(3)
(3) where i is the index of parameter classes; P(L|Ei) is the conditional probability of landslide for a given parameter class; N(L∩Ei) is the number of pixels identified as landslide in a parameter class; and N(Ei) is the total number of pixels covered by a parameter class. Second, the ratio of landslide conditional to overall probability for a given parameter class (PR) is obtained by dividing the P(L|Ei) into the overall landslide probability:
(4)
(4)
Except for zero, the minimum PR computed among all of the selected causative factor classes is 0.114 (the rock size–strength classes of V–VII), as shown in . Therefore, a least value of 0.1 was used as the denominator of PR values to ensure there are no negative IFVs, which is calculated as follows:(5)
(5)
Table 2. Summary results of recommended instability parameters values and values for weighting factors of rainfall.
The IFVs calculated for each parameter class are listed in . It is noted that the resolution of calculated IFV and susceptibility has a consistent processing resolution as the DEM map (native 20 m), factor layers (resampled 20 m) and landslide data (resampled from 2 to 20 m).
The calculated IFV value may change if different resolution DEMs are applied to process all the factors. The differences due to processing resolution were analyzed by comparing the IFV values derived from a 5-m resolution DEM, the highest available data in Gaoping River Basin, to the working resolution (20 m) in this study.
2.4.2. Functional relationships between landslide susceptibility and causative factors
The functional combination of causative factors in each mapping unit represents the LSI. Linear combination (LC) of the IFVs or WOEs was based on environmental parameters (Guzzetti et al. Citation1999; Lee and Pradhan Citation2006; Jadda et al. Citation2011; Piacentini et al. Citation2012), and is defined as(6)
(6)
In data-poor regions, Liu et al. (Citation2004) use geometric mean (GM) and multi-variable elimination to reduce data uncertainty. To calculate the GM, a multiplication-based approach obtains the LSI by the product of the IFVs, as defined as(7)
(7)
GM can eliminate regions where landslide is not expected to occur by setting the IFVi to zero (flat terrain), due to the nature of multiplication, while the remaining areas are classified in categories of increasing landslide susceptibility (Liu et al. Citation2004; Fourniadis et al. Citation2007b). An earthquake damage zone model (Liu et al. Citation2012) proposed an LC-based formula with ‘slope angle’ multiplied by ‘rock competence’ to modulate the effects between key variables which co-exist in all pixels and can intensify each other. The slope angle variable modulated with rock competence better represented the effects of lithology on slope stability classes. In this study, two models based on the ‘modulation’ and ‘add-on’ principle are proposed, which integrate multiplication and summation, and are calculated as(8)
(8)
(9)
(9) where the index of slo, lith, riv, cur and soil indicates the parameter class of slope angle, rock strength, stream buffer, total curvature and soil type, respectively. As a result, four LSI models (EquationEquations (4)
(4)
(4) –(Equation7
(7)
(7) )) were proposed and their appropriateness for landslide hazard zoning was tested in this work. The classification of landslide susceptibility thresholds was conducted by using Jenks Natural Breaks (Jenks Citation1963) in ArcMap 10.4.1, which is a widely used approach in statistical mapping.
2.4.3. Landslide hazard warning models
The LSI model provides detailed spatial distribution information on the environmental conditions sensitive to triggering factors. Therefore, rainfall events are considered the threshold mechanism to initiate landslide activity, which, in turn, are a function of the frequency, duration and intensity of rainfall over a given time. Hence, the incorporation of the vulnerable locations and triggering factors fulfils the concept of landslide hazard warning. Specifically, the functional relationships between dependent variables (i.e. CIL) and independent variables (e.g. triggering factors, LSI) are important estimations required to identify threshold values for landslide hazard warning. Alternatively, the LSI model identifies the spatial probability of landslides, while the landslide warning models identify the spatio-temporal probability of landslide occurrence. Furthermore, this study tested three multivariate-based landslide warning models, which are reported in the following.
1. Estimation of triggering threshold using simple linear regression (SLR)
Regression analysis is one of the most widely used methods in landslide warning to obtain the relationship between landslide triggering factor (dependent variable) and a set of independent contributing variables (Irigaray et al. Citation2007). When the maximum forecast rainfall for an incoming typhoon event (the predicted amounts of triggering factor, TFpred) was available, we assume that the level of warning, LW, for each pixel is proportional to the predicted exceedance of its triggering threshold (ETFpred):(10)
(10) where TFpred is the predicted level of triggering factor, such as the maximum 3-h forecast rainfall; CTFSLR is the critical triggering threshold estimated by the SLR model; α0 and α1 are coefficients estimated by the regression analysis of LSI values for historical CIL pixels and their observed level of triggering threshold, such as the observed R3 of a CIL pixel.
2. Prediction of landslide occurrence using logistic regression (LR)
Landslide susceptibility modelling uses LR to characterize the linkage between the presence or absence of landslides (dependent variable) with independent parameters (slope, aspect, lithology), which can infer susceptibility through the probability of landslide occurrence (Ayalew and Yamagishi Citation2005). Under the assumption that the probability of landslide triggering (p) was mainly depended on two independent variables, LSI and triggering factor, we developed an LR model for the prediction of landslide occurrence by analyzing the dataset consisting of all CIL pixels (p = 1) and an equal number of randomly selected non-CIL pixels (p = 0). Subsequently, the level of warning follows the condition of logistic regression, defined as(11)
(11) where β0, β1 and β2 are regression coefficients.
3. Estimation of triggering threshold using modulation (MOD)
The landslide-triggering index uses the concept of modulation, which is effective in masking off areas characterized by factors determined inappropriate to the event being examined (Fourniadis et al. Citation2007a). Similar to the calculation of LSI using GM model, we formulated a landslide triggering index (LTI) indicating the landslide potential by considering both the triggering and causative factors, which was defined as(12)
(12)
The triggering threshold of LTI was arbitrarily chosen at the 70 percentile of that for all historical CIL pixels. Again, under the assumption that the level of warning is proportional to the predicted exceedance of triggering threshold, the modulation-based warning model was defined as(13)
(13)
2.5. Performance evaluation
To evaluate model performance, previous studies use a success rate, which is the ratio of how many actual landslides are successfully predicted (Montgomery and Dietrich Citation1994; Dietrich et al. Citation1995; Borga et al. Citation1998). Based on the success rate model, a K value evaluates the ratio of landslide pixels in each susceptibility category by the percentage of landslide pixels under different levels of susceptibility. A simplified calculation to evaluate model performance (K) can therefore be defined as(14)
(14) where cat. landslide is the total number of landslide pixels for a given level of susceptibility which include Very high susceptibility (VHS), High susceptibility (HS), Medium susceptibility, (MS), Low susceptibility (LS) and Very low susceptibility (VLS); total landslide is the total number of landslide pixels in the study area, and; category. percentage is the percentage of landslide pixels for a given level of susceptibility. High K values indicate a more efficient performing model.
3. Results and discussion
3.1. The information value (IFV) of factors
3.1.1. IFV for causative factors
The five instability factors () used include slope angle, curvature, rock mass size–strength class, soil type, and stream buffer. Slope angles higher than 30 degrees are considered to be more prone to landslides, and therefore receive a higher IFV, while for curvature values less than −1 have a higher IFV. A more negative curvature indicates terrain is upwardly concave, allowing for convergence of material and water in the direction of landslide motion (Ohlmacher Citation2007). According to the Central Geological Survey of Taiwan's rock-strength classification system (Ministry of Economic Affairs), rock mass size–strength classes III and IV, comprising rock with thin layering, laminated, foliated and blocky characteristics, are more susceptible, and receive a higher IFV relative to the other classes. Lithosol and incipient yellow soils show more landslide activity, due to their prominence in steep sloping terrain with strong historical landslide evidence, and therefore receive a higher IFV. Stream buffer accounts for the effects of subsurface drainage and bank undercutting, with the internal buffer zone rated a greater IFV for the reason that high flow conditions typically erode outer channel banks, accelerating the destabilization of upslope terrain, causing landslides to increase in frequency. Therefore, the weighting of IFV with higher landslide occurrence is a consistent approach used to evaluate the contribution of each factor (Saha et al. Citation2005).
Differences in IFV slope and curvature values derived from 5 and 20 m DEMs showed a difference of less than 4% and 9%, respectively. This indicates insignificant changes among high- to low-resolution data sets. Similarly, the curvature IFV value is slightly higher, which is a result of the parameter being the second derivative. Importantly, the 2%–9% change does not change the rank of the IFV values of the related susceptibility classes.
3.1.2. Weighting for triggering factors
The weighting factor of rainfall (), which includes the variables of aspect and elevation, shows terrain influence on rainfall intensity to be significant. South and southeast-facing slopes have the highest weighting (1.00), due to the correlation with the southwesterly flow pattern of typhoon activity (Yu and Cheng Citation2014), which exposes slopes to more intense precipitation over a significantly longer period of time during a storm. Furthermore, elevations between 400 and 1000 m (1.0) and 1000 and 1400 m (0.9) receive high weighting for the reason of the increased spatial distribution of rainfall within the zones (Lee and Lin Citation2015).
3.2. Identification the functional relationships of landslide susceptibility models
3.2.1. Comparisons based on performance indicator
shows the performance of the four models evaluated. All parameter combinations identify terrain susceptible to landslides. The K value results indicate a reasonable distribution density of landslide pixels within high LSI classes (M, H and VH), with low LSI classes having negligible values. The GM model improves pixel density distribution among all LSI classes, while the highest values in the H & VH LSI classes. The MX1 model shows a decrease in distribution to low and medium classes, while increasing H to VH classes, accounting for the highest density for the VH LSI class. The MX2 model shows a similar pixel distribution trend as the GM model, with all LSI classes allocated with landslide pixels.
Table 3. Summary of performance indicator values of the four models tested.
Furthermore, the LC model concentrates a high percentage landslide values in the H & VH classes (22.11% and 65.42%) which demonstrates that this model uses a high proportion of the LSI class to organize landslide pixels within it. The behaviour of the models with multiplication distributes more landslide pixels among the five LSI classes.
K values of 1 represent a small percentage of landslide prediction, while 2 or higher a significantly higher prediction rate of landslides. Lower K values are computed for models comprising linear or modulated combinations (LC and GM). The LC model shows a significant K value difference from low to very high susceptibility classes. In contrast, the mixed models required significantly less pixels to classify high and very high susceptibility zones. As a result, MX1 and MX2 show the ability to assign less pixels to each class, while maintaining the sensitivity of the model. Specifically, the MX2 model shows the highest combined K value, assigning landslide pixels the most effectively within the high susceptibility classes (H & VH).
The AUC results for the LC (0.738), GM (0.737) and MX2 (0.739) model show similar values, with the MX1 (0.725) showing the lowest value. Importantly, the AUC values do not clearly differentiate the performance of the four models.
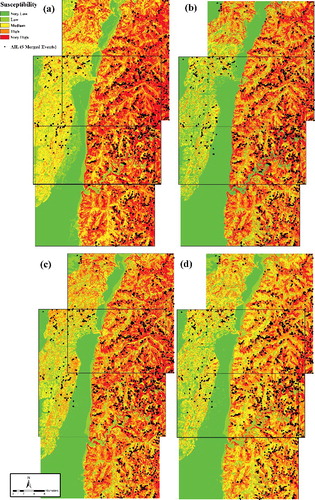
The spatial distribution of susceptibility classes for the LC model () is within the high to very high susceptibility categories, with lower categories showing negligible density. Overlaying AIL landslide polygons reveal landside activity concentrated within the areas of H to VH susceptibility; however, there is no clear delineation among the high-susceptibility classes. Compared with the LC model, multiplication (GM) improves the spatial distribution among all susceptibility categories ((b)), under the assumption that susceptibility will vary based on the variability of terrain conditions. Furthermore, lower index classes (VL, L, M) represent more terrain in the GM model. The MX1 model shows similar terrain classification as the GM model. Importantly, the MX2 model assigns spatial variability into the five most distinctive parameter groups. In terms of AIL landslide polygons location, the MX2 model corresponds with the well-defined zones of H to VH susceptibility and actual landslide events.
Figure 4. Spatial distribution of the landslide susceptibility classes derived by (a) linear combination (LC) LSI model, (b) geometric mean (GM) LSI model, (c) mixed model 1 (MX1) and (d) mixed model 2 (MX2) with AIL point overlay.
3.2.2. Visual interpretation of susceptibility maps
Differences among the four models are examined along the Jhoukou River and Bung Fu stream (). Following the add-on of principle of the five factors, the LC model coarsely assigns most of the steep terrain, and areas near the river, with high landslide potential. Therefore, ridgelines are assigned as medium susceptibility (as highlighted in (a)), and there is no difference in inner and outer banks of the river channel. Such overestimation is greater along the Bung Fu stream ((e)) where steep sloping terrain is in very close proximity to the narrow river channel. Therefore, very few safe areas were identified.
Figure 5. Close-up comparison showing (a) and (e) linear combination (LC), (b) and (f) geometric mean (GM), (c) and (g) mixed model 1 (MX1), (d) and (h) mixed model 2 (MX2) for the Jhoukou River and Bung Fu stream.
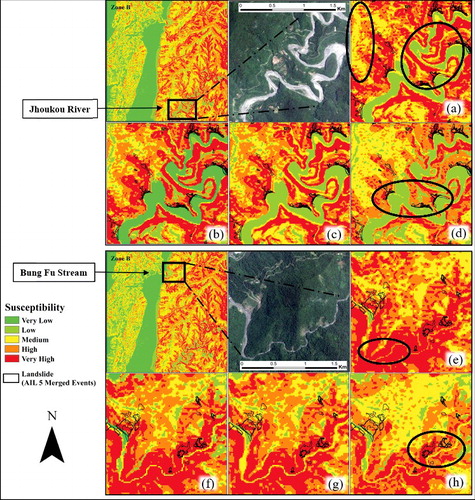
The GM model shows improved performance for the steep terrain along the Jhoukou River ((b)) and the Bung Fu stream ((f)), which is expected based on the effect of modulation to represent the terrain variability. The GM model enables finer definition between susceptibility class boundaries, which improves the representativeness by modulating factors (Liu et al. Citation2004). However, the effects of modulating all factors did not improve the differentiation of inner and outer banks of the river channel in relation to storm-triggered landslide activity.
The MX1 model, which only modulates slope and rock strength ((c)), shows similar results to the LC model ((a)) for the Jhoukou River and the GM model for the Bung Fu stream. This is expected based on the inference that rock strength is directly related to the uniform lithology data of the study area ((b)).
The MX2 model, which modulates both slope with rock strength and curvature with drainage, classifies a sequence of VH susceptibility areas on the outer channel wall (highlighted in (d,h)), as the river course changes direction. Specifically along the Jhoukou River ((d)), an important observation is the strong connection between historical landslide evidence and H to VH susceptibility classification. The Bung Fu stream ((h)), which is a smaller tributary, also shows a similar connection to landslide occurrence on the outer meander channel bank. The presence of incised meanders and short sub-tributaries is a significant geomorphic feature where upslope terrain is susceptible to landslides. Therefore, the modulation of ‘curvature’ and ‘drainage’ in the MX2 model improves the model performance based on their contribution to landslide initiation within the study area. Importantly, the integration of multiplication and addition in the MX2 model zeroes out factors for stable areas (Liu et al. Citation2012), strengthening factor combinations to mirror true environmental conditions. Furthermore, Stark et al. (Citation2010) concluded that lateral channel erosion during typhoon flooding events undercuts and destabilizes the hillslope causing increased landslide activity on the outer meanders banks, while the inner bend did not show evidence of landslides. Therefore, the influence of outer meander bends, historical landslide location and the high-susceptibility classification shows a strong hydrologic connection to the driving forces causing landslide activity for a channel prone to typhoon flooding events.
3.2.3. Modulation effects
3.2.3.1. Slope and rock strength
The connection between slope and rock strength varies, depending on the computation of parameters based on addition or modulation. Natural terrain factors of an area modulate slope and rock strength, under the assumption that steep sloping terrain shows high resistance to weathering and shear strength, while flat areas generally consist of deposition zones of weaker, highly weathered rock. The modulation of slope and rock strength enables the ‘mask out’ effect for flat terrain, which, in turn, improves model representativeness (Liu et al. Citation2012). In this study, the LC model overestimates the susceptibility without masking out the effects of weak rock on flat terrain and stronger rock on steeper terrain. While at the small-scale level where the lithological data is coarse, the effects of modulation were not apparent ((c,g)), at the large scale, the K value supports the importance of modulation (K for LC and MX1 is 1.6 and 1.71, respectively).
3.2.3.2. Curvature and drainage
The interaction between curvature and stream buffer parameters in the mixed models shows the differences with the ‘add-on’ and ‘modulation’ principles. Adding the variables (MX1) slightly increases the interaction value, while multiplication (MX2) significantly intensifies the connection of the combination. Susceptibility increases as the modulated effects of curvature and stream buffer strongly correlate on terrain conditions within close proximity to the active river channel. Curvature strongly affects the driving and resisting stresses of a landslide, in addition to the convergence or divergence of material and water (drainage) in the direction of landslide motion (Ohlmacher Citation2007). The MX2 model modulates topography near to the river into two classes of susceptibility, reflecting the assumption that gradual changes to drainage will be intensified based on the degree of landform concavity and distance to river. On the other hand, the MX1 model shows less detail in susceptibility classification, indicating that the addition of parameters does not mirror the variability of terrain conditions.
3.3. Combing LSI and triggering factors for landslide warning
3.3.1. Triggering factors
Typhoon Nanmadol interpolated rainfall values were used in this study to examine the temporal and spatial characteristics of precipitation during a recorded triggering event. Four maximum rainfall values used were based on the maximum rolling precipitation values at intervals of 3 h (R3) and 6 h (R6). Weighted terrain rainfall values at the same interval are represented as terrain rainfall totals at 3 h (TR3) and terrain rainfall at 6 h (TR6). The rainfall (R3 and R6) duration intervals () show a similar range of precipitation values, with terrain rainfall representing spatial variability consistent to local terrain.
Figure 6. Distribution of interpolated rainfall associated with Typhoon Nanmadol, comparison of associated hazard warning model results (simple linear regression (SLR), logistic regression (LR) and modulation (MOD)) and post-typhoon polygon results.
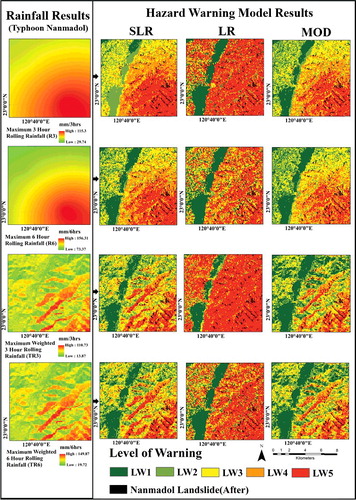
shows the distribution of maximum rolling rainfall values. The spatial distribution of high-intensity rainfall covers over half of the R3 output, while high-intensity R6 values concentrate in the southeastern segment of the study area to a primary hot spot. TR3 and TR6 are similar based on the weighted effects of aspect and elevation consistent to topographic variations of the study area. Terrain weight rainfall mirror the land condition of a series of valleys which show the highest rainfall values on southeast facing ridges and upland terrain to the south, with lower values found in valley bottom terrain, which slopes north to north-west. Furthermore, weighted rainfall mirrors true rainfall conditions, improving the performance of the selected triggering factor. Consequently, terrain rainfall (TR3 and TR6) presents the most fitting values as trigger rainfall factors, with TR6 the optimal, as 6-h duration compensates for the potential of forecasting error.
3.3.2. Comparisons between warning models
The LSI derived from the MX2 model was chosen as the most suitable based on (1) the high K value for high-susceptibility classes (H & VH), (2) the correlation of AIL landslide polygons to H & VH classes, and (3) the reasonable spatial distribution among the five susceptibility classes assigned to the study area. In order to compare the capability of the three multivariate-based landslide hazard models, the recommended range for trigger factors () are combined with the MX2 model, which are shown in . To determine the level of warning (LW) classes, the Jenks Natural Breaks classification method was used to classify very low (LW1), low (LW2), medium (LW3), high (LW4) and very high (LW5) levels of warning.
Table 4. Recommended ranges for triggering factors used in combination with hazard warning models.
The logistic regression (LR) model results are not optimal. It shows coarsely classified high hazard zones, while not assigning low to intermediate zones, even with combinations including terrain-weighted rainfall effects. LR models are commonly used in susceptibility modelling (Guzzetti et al. Citation1999); however, the close difference among variables in this study results in the model being unsuitable. Therefore, variable normalization is suggested to improve the representativeness of the model output.
For the threshold methods, SLR-R3, SLR-R6, MOD-R3 and MOD-R6 show a wide distribution of high-hazard areas. The SLR-TR3, SLR-TR6, MOD-TR3 and MOD-TR6 all assign linear-shaped high- and very high-hazard zones. This follows the modulation concept of the GM model, with flat terrain characterized as low hazard. Post-Nanmadol landslide polygon locations further confirm high-hazard zones in the SLR and MOD models with TR rainfall. For the study area, a simple model approach (MOD) presents more accurate results than a complex model, such as LR. It shows that a complex regression model has limited effectiveness due to the unknown internal processes for the study area. In effect, modulation enables users to discriminate the interaction among the chosen factors within the model to mirror local environmental conditions. The MOD model provides easy-to-calibrate variables, and thus is recommended for assessing landslide hazard potential.
4. Conclusion
This study identified an inventory-based LSI model based on the selection of causative and triggering factors, with functional relationships between factors examined. We selected and tested the component factors and their functional combinations with multi-event landslide inventory data. Compared with the LR warning model, the threshold-based models (SLR and MOD) have the advantage of representing variabilities related to topographic non-uniform rainfall pattern.
Incorporating a detailed process of factor selection is important to achieve accurate representation of environmental conditions. More specifically, selection based on the functional combination of factors is a favourable method because an expert approach can better evaluate the appropriateness of factor selection. Importantly, separating factors for susceptibility and trigger factors improves the model output. Deriving IFV values of slope and curvature based on 5 and 20 m DEM datasets showed insignificant value differences (2%–9%), which did not change the ranking of areas of high susceptibility. Moreover, the rainfall values associated with Typhoon Morakot were not used since accumulation totals were not within the applicable range of this study. More importantly, rainfall values combined with elevation and aspect to quantify the strength of the triggering factor are limited to regions without high rainfall variability.
The MX2, which used two modulated combinations (slope and rock strength, curvature and drainage), offers a better result than an LC. Modulation can effectively mask out terrain conditions with low susceptibility (flat terrain), while intensifying factor values in areas of high susceptibility (steep sloping terrain).
The optimal results of the SLR and MOD hazard warning models show the combination of elevation, aspect and terrain rainfall-triggering factor well represent the modulation of trigger factors. This method proves modulation and multiplication as a powerful approach in statistical landslide models.
Visual interpretation suggests that the effect of outer meander bends influences the location of high-susceptibility areas. It may be further developed that meander be considered a causative factor to landslide activity. The model proposed is an important contribution in identifying the linkage between causative factors and triggering rainfall factors and their response to modulation. The present approach can be used to better understand their functional relationships and implications to hazard warning within a watershed. Future work will concentrate on (1) improving the DEM resolution quality and (2) further validation of the hazard warning model, which will enhance the accuracy of the final landslide hazard map.
Disclosure statement
No potential conflict of interest was reported by the authors.
Additional information
Funding
Related Research Data
References
- Ayalew L, Yamagishi H. 2005. The application of GIS-based logistic regression for landslide susceptibility mapping in the Kakuda-Yahiko Mountains, Central Japan. Geomorphology. 65:15–31.
- Borga M, Dalla Fontana G, Da Ros D, Marchi L. 1998. Shallow landslide hazard assessment using a physically based model and digital elevation data. Environ Geol. 35:81–88.
- Carrara A, Cardinali M, Detti R, Guzzetti F, Pasqui V, Reichenbach P. 1991. Gis techniques and statistical-models in evaluating landslide hazard. Earth Surf Process. 16:427–445.
- Cevik E, Topal T. 2003. GIS-based landslide susceptibility mapping for a problematic segment of the natural gas pipeline, Hendek (Turkey). Environ Geol. 44:949–962.
- Chang KT, Chiang SH, Lei F. 2008. Analysing the relationship between typhoon-triggered landslides and critical rainfall conditions. Earth Surf Process. 33:1261–1271.
- Chen CY, Lin LY, Yu FC, Lee CS, Tseng CC, Wang AH, Cheung KW. 2007. Improving debris flow monitoring in Taiwan by using high-resolution rainfall products from QPESUMS. Nat Hazards. 40:447–461.
- Chen SC, Wu CY, Huang BT. 2010. The efficiency of a risk reduction program for debris-flow disasters - a case study of the Songhe community in Taiwan. Nat Hazard Earth Syst. 10:1591–1603.
- Chen YH, Tan CH, Chen MM, Su TW. 2013. Estimation of rainfall threshold for regional shallow landslides in a watershed. J Chin Soil Water Conserv. 44:87–96.
- Chien LK, Hsu CF, Yin LC. 2015. Warning model for shallow landslides induced by extreme rainfall. Water. 7:4362–4384.
- Conoscenti C, Di Maggio C, Rotigliano E. 2008. GIS analysis to assess landslide susceptibility in a fluvial basin of NW Sicily (Italy). Geomorphology. 94:325–339.
- Dahal RK, Hasegawa S, Nonomura A, Yamanaka M, Masuda T, Nishino K. 2008. GIS-based weights of evidence modelling of rainfall-induced landslides in small catchments for landslides in susceptibility mapping. Environ Geol. 54:311–324.
- Dai FC, Lee CF, Li J, Xu ZW. 2001. Assessment of landslide susceptibility on the natural terrain of Lantau Island, Hong Kong. Environ Geol. 40:381–391.
- Dietrich WE, Reiss R, Hsu ML, Montgomery DR. 1995. A process-based model for colluvial soil depth and Shallow Landsliding using digital elevation data. Hydrol Process. 9:383–400.
- Ermini L, Catani F, Casagli N. 2005. Artificial neural networks applied to landslide susceptibility assessment. Geomorphology. 66:327–343.
- Fourniadis IG, Liu JG, Mason PJ. 2007a. Landslide hazard assessment in the three Gorges area, China, using ASTER imagery: Wushan-Badong. Geomorphology. 84:126–144.
- Fourniadis IG, Liu JG, Mason PJ. 2007b. Regional assessment of landslide impact in the three Gorges area, China, using ASTER data: Wushan-Zigui. Landslides. 4:267–278.
- Franklin JA. 1986. Size–strength system for rock characterization. In: M. Karmis, editor. Proceedings of the International Symposium Application of Rock Characterization Techniques in Mine Design, New Orleans, LA. New York: Society of Mining Engineers. p. 11–16.
- Guzzetti F, Carrara A, Cardinali M, Reichenbach P. 1999. Landslide hazard evaluation: a review of current techniques and their application in a multi-scale study, Central Italy. Geomorphology. 31:181–216.
- Guzzetti F, Reichenbach P, Ardizzone F, Cardinali M, Galli M. 2006. Estimating the quality of landslide susceptibility models. Geomorphology. 81:166–184.
- Hovius N, Stark CP, Chu HT, Lin JC. 2000. Supply and removal of sediment in a landslide-dominated mountain belt: central range, Taiwan. J Geol. 108:73–89.
- Irigaray C, Fernandez T, El Hamdouni R, Chacon J. 2007. Evaluation and validation of landslide-susceptibility maps obtained by a GIS matrix method: examples from the Betic Cordillera (southern Spain). Nat Hazards. 41:61–79.
- Jadda M, Shafri HZM, Mansor SB. 2011. PFR model and GiT for landslide susceptibility mapping: a case study from Central Alborz, Iran. Nat Hazards. 57:395–412.
- Jenks GF. 1963. Generalization in statistical mapping. Ann Assoc Am Geogr. 53:15–26.
- Lan HX, Zhou CH, Wang LJ, Zhang HY, Li RH. 2004. Landslide hazard spatial analysis and prediction using GIS in the Xiaojiang watershed, Yunnan, China. Eng Geol. 76:109–128.
- Larsen MC, Simon A. 1993. A rainfall intensity–duration threshold for landslides in a humid-tropical environment, Puerto-Rico. Geogr Ann A. 75:13–23.
- Lee CS, Huang LR, Shen HS, Wang ST. 2006. A climatology model for forecasting typhoon rainfall in Taiwan. Nat Hazards. 37:87–105.
- Lee CT, Huang CC, Lee JF, Pan KL, Lin ML, Dong JJ. 2008. Statistical approach to storm event-induced landslides susceptibility. Nat Hazard Earth Syst. 8:941–960.
- Lee MH, Lin HH. 2015. Evaluation of annual rainfall erosivity index based on daily, monthly, and annual precipitation data of rainfall station network in Southern Taiwan. Int J Distrib Sens Netw. 2015:2–2.
- Lee S, Choi J. 2004. Landslide susceptibility mapping using GIS and the weight-of-evidence model. Int J Geogr Inf Sci. 18:789–814.
- Lee S, Chwae U, Min KD. 2002. Landslide susceptibility mapping by correlation between topography and geological structure: the Janghung area, Korea. Geomorphology. 46:149–162.
- Lee S, Pradhan B. 2006. Probabilistic landslide hazards and risk mapping on Penang Island, Malaysia. J Earth Syst Sci. 115:661–672.
- Lee S, Ryu JH, Won JS, Park HJ. 2004. Determination and application of the weights for landslide susceptibility mapping using an artificial neural network. Eng Geol. 71:289–302.
- Liu CC. 2006. Processing of FORMOSAT-2 daily revisit imagery for site surveillance. IEEE Trans Geosci Remote. 44:3206–3214.
- Liu CC. 2015. Preparing a landslide and shadow inventory map from high-spatial-resolution imagery facilitated by an expert system. J Appl Remote Sens. 9:096080.
- Liu CC, Liu JG, Lin CW, Wu AM, Liu SH, Shieh CL. 2007. Image processing of FORMOSAT-2 data for monitoring the South Asia tsunami. Int J Remote Sens. 28:3093–3111.
- Liu CC, Shieh CL, Lin JC, Wu AM. 2011. Classification of non-vegetated areas using Formosat-2 high spatiotemporal imagery: the case of Tseng-Wen Reservoir catchment area (Taiwan). Int J Remote Sens. 32:8519–8540.
- Liu JG, Mason PJ, Clerici N, Chen S, Davis A, Miao F, Deng H, Liang L. 2004. Landslide hazard assessment in the Three Gorges area of the Yangtze river using ASTER imagery: Zigui-Badong. Geomorphology. 61:171–187.
- Liu JG, Mason PJ, Yu E, Wu MC, Tang C, Huang RQ, Liu HH. 2012. GIS modelling of earthquake damage zones using satellite remote sensing and DEM data. Geomorphology. 139:518–535.
- Montgomery DR, Dietrich WE. 1994. A physically-based model for the topographic control on shallow landsliding. Water Resour Res. 30:1153–1171.
- Nandi A, Shakoor A. 2010. A GIS-based landslide susceptibility evaluation using bivariate and multivariate statistical analyses. Eng Geol. 110:11–20.
- Neuhauser B, Damm B, Terhorst B. 2012. GIS-based assessment of landslide susceptibility on the base of the Weights-of-Evidence model. Landslides. 9:511–528.
- Ohlmacher GC. 2007. Plan curvature and landslide probability in regions dominated by earth flows and earth slides. Eng Geol. 91:117–134.
- Papathanassiou G, Valkaniotis S, Ganas A, Pavlides S. 2013. GIS-based statistical analysis of the spatial distribution of earthquake-induced landslides in the island of Lefkada, Ionian Islands, Greece. Landslides. 10:771–783.
- Piacentini D, Troiani F, Soldati M, Notarnicola C, Savelli D, Schneiderbauer S, Strada C. 2012. Statistical analysis for assessing shallow-landslide susceptibility in South Tyrol (south-eastern Alps, Italy). Geomorphology. 151:196–206.
- Rosca S, Stefan B, Danut P, Ioan F, Iuliu V, Sorin F. 2015. Application of landslide hazard scenarios at annual scale in the Niraj River basin (Transylvania Depression, Romania). Nat Hazards. 77:1573–1592.
- Rosca S, Stefan B, Danut P, Iuliu V, Ioan F. 2016. Comparative assessment of landslide susceptibility. case study: the Niraj river basin (Transylania depression, Romania). Geomat Nat Hazards Risk. 7:1043–1064.
- Saha AK, Gupta RP, Sarkar I, Arora MK, Csaplovics E. 2005. An approach for GIS-based statistical landslide susceptibility zonation - with a case study in the Himalayas. Landslides. 2:61–69.
- Schicker R, Moon V. 2012. Comparison of bivariate and multivariate statistical approaches in landslide susceptibility mapping at a regional scale. Geomorphology. 161:40–57.
- Stark CP, Barbour JR, Hayakawa YS, Hattanji T, Hovius N, Chen H, Lin CW, Horng MJ, Xu KQ, Fukahat Y. 2010. The climatic signature of incised river meanders. Science. 327:1497–1501.
- Sujatha ER, Kumaravel P, Rajamanickam GV. 2014. Assessing landslide susceptibility using Bayesian probability-based weight of evidence model. Bull Eng Geol Environ. 73:147–161.
- Suzen ML, Doyuran V. 2004. A comparison of the GIS based landslide susceptibility assessment methods: multivariate versus bivariate. Environ Geol. 45:665–679.
- SWCB. 2014. Debris flow disaster prevention information: rainfall threshold value for debris flow warnings. Soil and Water Conservation Bureau (SWCB). http://246eng.swcb.gov.tw/Learning/DebrisFlow/Introduction/7-RainfallThresholdValue.aspx
- van Westen CJ, Castellanos E, Kuriakose SL. 2008. Spatial data for landslide susceptibility, hazard, and vulnerability assessment: an overview. Eng Geol. 102:112–131.
- Varnes DJ. 1978. Slope movement types and processes. In: R.L. Schuster, R.J. Krizek, editors. Landslide analysis and control. Washington, DC:Transportation Research Board, National Academy Sciences. 11–33.
- Yalcin A. 2008. GIS-based landslide susceptibility mapping using analytical hierarchy process and biavriate statistics in Arolesen (Turkey): comparison of results and confirmations. Catena. 72:1–12.
- Yu CK, Cheng LW. 2014. Dual-Doppler-derived profiles of the southwesterly flow associated with Southwest and ordinary typhoons off the Southwestern coast of Taiwan. J Atmos Sci. 71:3202–3222.