
 ?Mathematical formulae have been encoded as MathML and are displayed in this HTML version using MathJax in order to improve their display. Uncheck the box to turn MathJax off. This feature requires Javascript. Click on a formula to zoom.
ABSTRACT
The European ‘Floods Directive’ 2007/60/EC focuses on the development of flood risk maps and management plans on the basis of the most appropriate and advanced tools. This pushed a paradigm shift for moving to sustainable development through processes of stakeholder engagement to improve the efficiency and transparency of decision processes. In this context, this research project developed a free and open-source GIS software, called FloodRisk, to operatively support stakeholders in their compliance with risk map delineation and the management of current and future flood risk based on their needs for multi-purpose applications. In this paper, a high-resolution impact assessment framework based on 2D inundation modelling with different return periods was used, as input, within the FloodRisk model to reconstruct the socio-economic damages based on a case study showing how structural and non-structural measures can significantly decrease the cost of floods for households. The sensitivity of the FloodRisk model was also examined and it was found to be highly dependent on the selection of damage functions and the economic values of the exposed assets.
Introduction
In recent decades, flood damage throughout Europe has increased due to climatic changes, population growth and urban development in flood-prone areas (Barredo Citation2009; Munich RE Citation2015). At the same time, risk-prone areas such as deltas and flood plains continue to attract human development, thereby increasing the vulnerability of these places (Kummu et al. Citation2011). Therefore, flood risk management (FRM) efforts must deal with an observed increase in flood damage combined with the expectation that flood consequences will continue to rise due to changes in flood meteorological drivers, land-use patterns and socio-economic development (IPCC Citation2007; te Linde et al. Citation2010). Past management has been dominated by technical flood prevention measures, despite losses in ecosystem function, and flood losses have continued to increase, with the need for change becoming increasingly apparent. Therefore, a new scientific approach that aims to increase resilience by managing risk efficiently and adaptively is emerging. This approach considers the interplay between hydrological and socio-economic factors and the calculation of the expected flood damage represents a fundamental piece of information for the overall flood-risk mitigation process (Domeneghetti et al. Citation2015). This new perspective is based on resilience and societal analysis and must reflect the challenge of using sustainable development (SD) metrics, as well as the requirements for risk mitigation and adaptation strategies, in particular, considering the limited financial resources available. Whilst these requirements are welcome in light of the scientific achievements and recent understanding of risk, they charge stakeholders with new duties and challenges that are not only difficult to handle, but for which scientific and technical development is still probably insufficient to provide the necessary knowledge to support stakeholders’ FRM decisions (Albano et al. Citation2015a). In addition to the potential of flood risk analysis for knowledge exchange across different scientific communities and, hence, methodological improvements, there is a need for knowledge transfer from science to practice. There is an emerging need for appropriate tools that provide information about the consequences of adopting different courses of action, as well as the ability to do so in a way that responds to the nature of the tasks with which stakeholders are faced.
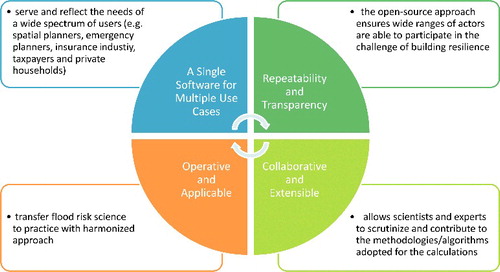
The Floods Directive asks Member States to develop risk maps on the bases of the most appropriate and advanced tools, provided that the economic effort required for their systematic implementation is reasonable. Moreover, risk maps must supply all the knowledge that is required to develop flood risk management plans (FRMPs), in particular, allowing for a costs–benefits analysis of proposed mitigation actions. In this context, we have developed a free and open-source GIS software, called FloodRisk, that aims to support operatively diverse stakeholders in their compliance with FRM (e.g. to manage current and future flood damages and risk according to different adaptation mitigation actions, emergency service strategies, recovery processes and insurance premium rate calculation, and to communicate flood risk worldwide), through a transparent and collaborative approach. The FloodRisk tool, implemented as a QGIS plug-in, can be applied by different actors in risk management for their specific aims (context-specific and applicable), and includes direct tangible and intangible cost types (comprehensive), accounts for structural and non-structural mitigation strategies, can be used for analysis of future dynamics (consider risk dynamics), and promotes collaboration and communication through an open-source approach (transparent) ().
Figure 1. Highlights of the FloodRisk plug-in vision.
After this brief introduction, this paper describes the motivations and main features of the proposed FloodRisk software, explaining in detail the architecture, user interface, usability and portability. Later, the FloodRisk methodological framework and engine workflow is described. Moreover, an example application of assessing the economic damage and population affected by flooding on a benchmarking case study (i.e. dataset was originally provided by Seda-Sanabria et al. (Citation2013) for the workshop on the benchmarking of risk analysis for dam breaks; the name and geographical location of the case study town is not explicitly provided), accounting for structural and non-structural measures, is presented. A sensitivity analysis of the parameters of the proposed model is also performed. Finally, a discussion of limitations and potential improvements of the presented risk analysis tool is provided and an overall conclusion is presented.
The FloodRisk plug-in vision
The main objective of flood risk analysis models is to provide a basis and support for better decision-making in selecting alternative risk mitigation options by providing informed and well-reasoned arguments, hence contributing to the improvement of FRM processes. Current methods assessing the costs of natural hazards, both related to damages and mitigation, employ a substantial difference in their underlying approaches, as geographical, hydrological and social differences demand specific approaches for different applications and in different countries. This obstructs the process of performing robust, transparent, harmonized and comparable flood risk analysis. Indeed, the emerging flood risk analysis approach should take into account that cost assessments are always purpose-related and be based on the determination of the appropriate spatial scale and time horizon. Several flood damage modelling methodologies have been developed for specific purposes and tailored to characteristics of specific contexts [e.g. HAZUS-MH (FEMA Citation2003; Scawthorn Citation2006); FLEMO model (Apel et al. Citation2009; Vorogushyn et al. Citation2012); Multi-Coloured Manual (Penning-Rowsell et al. Citation2005)]. The selection of flood risk software to be evaluated was based on the degree of reliability ensured due to the fact that all of them were developed and applied by governments and academic institutions. The analysis of these models also highlights their limits in fulfilling knowledge requirements for a comprehensive FRM strategy, for example as regards emergency planning; important information for the emergency phase (such as exposed people per building, vulnerability of evacuation routes, etc.) is presently not supplied. The analysis of these methods/models shows criticalities with regard to the full inclusion of structural and non-structural mitigation measures for cost–benefit analysis and the transfer of these methods in terms of space and spatial scale, and also regarding the achievement of transparent communication and collaborative decision-making. The contributions by existing flood loss methods to the progress of flood consequence assessment are undeniable. However, flood risk analysis is now viewed from a wider and more comprehensive perspective, one that can overcome the limitations of the above-cited models in situations where both structural and non-structural measures must be considered and combined in the best possible way, and must be attuned to the specific context concerned. Moreover, the scientific and engineering community have limited or unrecognized access to computer codes to perform flood risk analysis. Therefore, there is an emerging need to promote the development of applications that are open, transparent, reliable, extensible and collaborative (Green et al. Citation2011). This approach could produce benefits for the whole community: creating open systems – in addition to sharing data – promotes transparency and accountability, and ensures that wide ranges of actors are able to participate in the challenge of building resilience (Albano et al. Citation2017c). Stakeholder involvement and active participation can increase the legitimacy of risk processes, as well as public acceptance, commitment and support with respect to decision-making processes (Inam et al. Citation2017a, Citation2017b). Among the scientific community, this type of activity can be labelled as ‘participatory research’, intended for adopting a set of techniques that ‘are interactive and collaborative’ and reproducible, thus ‘providing a meaningful research experience that both promotes learning and generates knowledge and research data through a process of guided discovery’ (Mercer et al. Citation2008). Learning processes may have several facets, such as self-organization, transformability, adaptation as a response to perturbations, adaptive management, the use of all kinds of knowledge and innovation (Folke et al. Citation2005; Folke Citation2006; Berkes Citation2007; IPCC Citation2007).
In this context, the proposed tool, called FloodRisk, () shows high modularity and flexibility, allowing flood risk stakeholders, practitioners and scientists to scrutinize and contribute to the methodologies/algorithms adopted through a community-based development process. The source is published under free and open-source software licenses with end-user rights to analyze, modify and redistribute for any purpose, increasing the chances of eventually correcting bugs, improving the model and adapting it for specific purposes. It not only increases the possibility of validating and testing the published source code, but it may also provide an important platform for developers of proprietary software to increase the scientific validity of their results. In this way, the owners of proprietary code can provide effective user support in a manner that is usually difficult for open-source projects to deliver.
Moreover, it is important to mention that, despite the fact that some of the aforementioned flood loss methods incorporate calculation philosophies similar to the ones implemented in the FloodRisk model, implementation can vary significantly, since FloodRisk has a user-friendly and intuitive interface and the capability of running calculations on any platform (Windows, Mac, Linux, etc.), as well as extensibility, efficient testability and scientific operability. The choice of organizing the procedure in modules seems promising in that it not only allows to assess different types of damage but also to implement the procedure gradually, according to available human and financial resources.
The FloodRisk model has been developed as a plug-in of the free and open-source QGIS software, following risk mapping approaches that could be more precise in a spatial sense, providing spatial resolution adequate to the scope of the analysis and fully addressing the spatial distribution differences of both a territorial system and of a flood event, that can produce significant differences in its potential damages. Indeed, the use of geospatial models through Geographic Information Systems (GISs) is very useful in flood risk assessment, as GISs are ideal for managing heterogenic spatial information, providing spatial analysis processing and simple and clear visualization of results (Sole et al. Citation2012). Finally, the interactive, dynamic and flexible nature of GIS technology, combined with the immediacy with which information is presented by the map, can facilitate and speed up the process of knowledge acquisition (Albano et al. Citation2015b). Maps can enhance recipients’ knowledge resources, thereby facilitating informed discussion, as well as building capacity for more private protection. They can also provide a common visual basis for a two-way exchange about the local risk situation (Kjellgren Citation2013). According to the Floods Directive, such maps represent the knowledge base on which suitable measures as well as appropriate objectives for FRMPs must be selected and designed, by considering both costs and benefits of alternatives and results from consultation with all interested parties.
In the field of flood risk, several different types of free and open-source geospatial software have been released [e.g. CAPRA-GIS (http://www.ecapra.org/); UNISDR GAR15 (De Bono Citation2015); Delft3D suite DAM (http://oss.deltares.nl/web/delft3d)], most of them oriented to assessment of flood hazard and not taking into consideration the quantitative assessment of consequences/losses. Recently, some risk-based models have been developed as free and open geospatial software. For example, InaSAFE (http://inasafe.org/) is a multi-risk platform, developed as a QGIS plug-in that enables the assessment of several natural hazard scenarios for floods, earthquakes, volcanoes and tsunamis, to underpin emergency planning, disaster preparedness and response activities (World Bank Citation2014). For these aims, InaSAFE allows (at the time of writing) the quantitative estimation of exposure elements due to a natural event (e.g. an assessment of the number of people affected). In the FloodRisk plug-in, the vulnerability is effectively characterized to estimate potential direct economic damages and loss of life in order to perform cost–benefit analyses addressing the objectives and applications of a wide range of stakeholders. Therefore, considering that, according to Art. 7 of the Directive 2007/60/EC, FRMPs have to include measures for flood risk reduction, taking also into account ‘relevant aspects such as costs and benefits’, it is evident that the above-mentioned methods are not sufficient to comply with these prescriptions. Moreover, the end-users of flood risk analysis from different sectors (e.g. insurance industry, spatial planners, emergency planners, river basin managers, taxpayers) may have specific requirements in terms of the types of results and, as a consequence, the methodologies preferred for calculation. Hence, the FloodRisk plug-in addresses different target groups and objectives utilizing a cost–benefit approach.
Considering that FloodRisk seeks to translate all relevant considerations into monetary terms and can therefore select the most efficient project from a portfolio of alternatives, it can serve national and regional governments. The latter are among the main target groups with a high interest in reducing risk and allocating budgets to flood risk mitigation options. Moreover, FloodRisk can be used by all the other stakeholders that may want to consider (as much as possible) all benefits and costs of alternative courses of action, and therefore, ex-ante cost assessments of the current risk situation and of future scenarios are required. Particularly, for the spatial planner, cost assessment results must be displayed in risk maps in order to show the spatial distribution of risk and depict areas which suffer the most. Following an event, the emergency planners of the affected nation or region are usually interested in the amount of overall damages that occurred, in order to compensate losses or effectively support recovery. Therefore, the quick but robust quantitative damage estimates that can be performed by FloodRisk would be helpful.
Insurance companies are also interested in cost assessment figures. Insurance companies mainly need cost assessments to calculate individual insurance premiums, which require more detailed, object-specific ex-ante cost assessments and, of course, ex-post cost assessments for compensation payments. As insurance companies often have to compensate depreciated costs, they frequently adopt the depreciated value of assets in such a case in cost assessments on, while planners’ cost assessments are usually based on the full replacement time value of assets. Moreover, private companies or private homeowners may also be a target FloodRisk user group for cost assessment studies as they are likely interested in the potential risk to their property due to natural hazards, in order to decide on private precautionary measures or whether or not to insure. Finally, taxpayers may be interested to know how flood risk decisions produce costs or achieve benefits for the community ().
The FloodRisk plug-in vision follows the emerging FRM paradigm, which is not unaware of prevention in the classical sense, nor the need to better manage emergencies, but is also open to complex actions regarding preparation for critical events, prior information, public involvement and economic representatives, leading to more extensive risk awareness in an operative manner.
The FloodRisk plug-in implementation
The design and implementation of this tool is described, placing particular focus on the characteristics that could make it suitable for establishing robust, modular, flexible, repeatable and multiple-use case approaches for calculating and communicating flood risk worldwide.
QGIS and its plug-in mechanism
The authors have chosen to integrate the FloodRisk model in a free and open-source desktop GIS i.e. QGIS (www.qgis.org), taking into account its quality and current worldwide diffusion, and therefore, its potential in disseminating the results of the proposed project. QGIS is a mapping software that is installed on and runs on a personal computer and allows users to display, query, update, and analyze data about geographic locations and the information linked to those locations (Steiniger and Bocher Citation2009). QGIS is a volunteer-led development project licensed under the GNU General Public License; it was started by Sherman in 2002. The project was incubated with the Open Source Geospatial Foundation (OSGeo) in 2007. The original aim was to provide a fast and easy-to-use geographic data viewer for GRASS GIS (Neteler et al. Citation2012). Progressively, QGIS has extended its functionality beyond data viewing through the development and integration of a series of customized and external algorithms through a plug-in mechanism. QGIS, indeed, has been designed with plug-in architecture and, therefore, can easily integrate several external functionalities in its platform. Moreover, this plug-in architecture provides access to QGIS core applications for developers while maintaining independent development paths. This simple and efficient mechanism allows the embedding of an external algorithm library into the system by putting it into specific folders (i.e. PLUGIN_PATH). QGIS has become a high-quality cutting-edge GIS in addition to representing a collaborative development model and supporting the free spread of knowledge. It has a growing developer base and the software itself, as well as the development process, is well documented. Hence, the main advantage of QGIS relies on the ease and rapidity of developing new plug-ins using Python language (www.python.org). Python has many advantages because it is released with an open-source license and has an extensive set of scientific libraries that make it an attractive environment for interactive development between scientists and IT developers.
Architecture
Until recently, geospatial software was characterized by monolithic applications that contained all the code necessary to deal with user interface, data processing and database communication. Monolithic software production is more expensive than splitting monolithic applications into multiple parts; each part is a component of the overall system and performs a specific function, and therefore, the single components can be reused in several applications, thus saving money.
The FloodRisk conceptual design clearly follows the design philosophy of having an object-oriented framework that deconstructs the risk analysis calculation into its component set of connectable pieces, which can then be assembled into applications of substantial complexity. Several free and open-source technologies and approaches have been used in FloodRisk plug-in implementation, and the source code has been implemented in the Python language.
We have used Python as the core of our framework because it is an interpreted language that provides the flexibility, interactivity and extensibility needed for serving as a ‘glue’ to tie modules and components together, rapidly creating customized applications. Python's syntax emphasizes support for a common programming methodology and promotes code readability, and, thus, maintainability. Python has become one of the key languages used in most parts of GIS add-on development, in part due to its integration with the well-known GDAL/OGR library for GIS data elaborations. GDAL/OGR (Geospatial Data Abstraction Library) is an open-source cross-platform C++ translator library for raster and vector geospatial data formats (www.gdal.org). GDAL supports over 50 raster formats, and OGR over 20 vector formats. Indeed, GDAL/OGR is used in the FloodRisk plug-in as the basis for much of the data access and processing. Furthermore, the FloodRisk plug-in uses the numeric extension, NumPy, to allow for the efficient storage and manipulation of large amounts of numerical data, such as GIS raster data, thus limiting the operation computational time. NumPy (www.numpy.org) is one of the main packages utilized in scientific computing with Python language. Among several functionalities of Numpy, we highlight the following characteristics:
• Powerful N-dimensional array object;
• Sophisticated (broadcasting) functions;
• Tools for integrating C/C++ and Fortran code;
• Useful linear algebra, Fourier transforms, and random number capabilities.
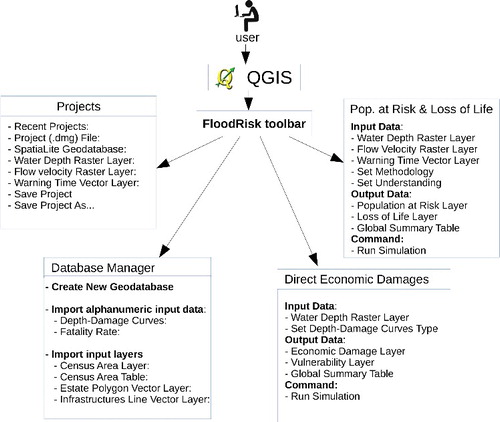
Moreover, FloodRisk uses SQlite, an open-source relational DBMS, and SpatiaLite, an extension of SQLite to support fully fledged Spatial SQL capabilities to store the geographic and alphanumeric input data (Swain et al. Citation2015). A database management system allows users to define, create and maintain a database, and provides controlled access to the data. The DBMS has a number of advantages as compared to the traditional computer file processing approach, such as controlling data redundancy, data consistency, data integration and integrity constraints. For example, DBMS stores all the data and their relations into a single database, avoiding data duplication in several paths. Finally, FloodRisk software is completely integrated in QGIS through its plug-in architecture. Therefore, it inherits several QGIS advantages, such as interoperability, portability, diffusion, modularity, and flexibility. The essential requirement for building plug-ins is to utilize the predefined interface provided by the system. A QGIS plug-in interface consists of several Python instructions that can be generated automatically from the external plugin, called ‘Plugin Builder’. This builds an easy QGIS plug-in structure, generating a simple template plug-in that can be used as a starting point for customized plug-in development. Based on this simple architectural structure generated by the Plug-in Builder tool, FloodRisk structures () comprise 21 classes: 1 class (floodrisk.py) for the general toolbar where all the buttons are named; 7 classes (Ui_name.py) that are integrated with the Graphical User Interface (GUI) module; and another group of 13 classes (Name.py) that are integrated with the Core module.
Figure 2. GUI components.
Graphical user interface (GUI)
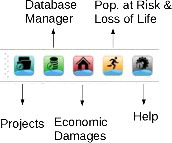
The FloodRisk plug-in GUI has been developed through the QGIS GUI standard library Qt (http://www.qt.io/). Thanks to Qt is useful for translation into several languages (this first version of FloodRisk is available only in English and Italian). The FloodRisk GUI is completely integrated in the main QGIS user interface. In particular, the FloodRisk GUI is composed of five main forms (), including the ‘Help’. These forms allow the user to (i) guide the user to fill the database with their own data, to (ii) create or change FloodRisk project files and to perform risk analysis, i.e. (iii) flood economic damages evaluation and (iv) loss of life estimation. The developed toolbar () allows activation of the main forms. Moreover, FloodRisk contains several other GUI forms (accessible from the main forms) in order to depict input and output data as charts, tables and maps. The GUI functionalities are described in detail in the user manual at https://github.com/FloodRiskGroup/FloodRisk-doc/blob/master/FloodRiskUserManual.
Figure 3. FloodRisk toolbar.
Portability and availability
FloodRisk uses libraries available in the QGIS core and in default QGIS Python installation. Therefore, it has the same aforementioned portability and interoperability advantages as QGIS (e.g. FloodRisk is a cross-platform program, and it has been tested in Windows, Linux and Mac). The FloodRisk source code is licensed under the GNU Public License (GPL) version 2 and is shared through Github at https://github.com/FloodRiskGroup/floodrisk together with a set of benchmark data downloadable at https://github.com/FloodRiskGroup/FloodRisk-doc.
Moreover, the FloodRisk tool is available via the QGIS plug-in installer, provided by the QGIS official repository. Detailed FloodRisk installation and application help is available in the user manual at https://github.com/FloodRiskGroup/FloodRisk-doc/blob/master/FloodRiskUserManual.
The FloodRisk methodological framework
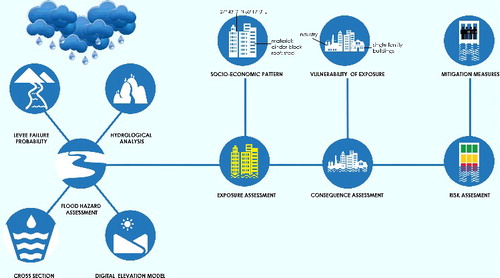
The conceptual framework, adopted by FloodRisk, to estimate the expected damages per year is displayed in . The FloodRisk framework is based on hazard modelling with different return time periods, as inputs, in order to reconstruct the socio-economic damages. Moreover, through combining the flood inundation maps with exposure and vulnerability information, potential damage is calculated: with flood damages corresponding to different probabilities, an exceedance probability loss (EPL) curve can be constructed, from which the expected annual damage (EAD) can be calculated. Finally, different flood risk measures can be implemented in the damage model in order to calculate their effectiveness in reducing flood risk.
Figure 4. Symbolic scheme of the flood risk assessment framework.
With respect to vulnerability assessment, the FloodRisk plug-in follows a standard approach, proposed by Sayers et al. (Citation2014), that reflects both the potential for a given receptor to experience harm should it be flooded and the quantification of the number of properties or people that may be exposed to a given flood event should it occur. Therefore, the flood risk is evaluated by the combination of the receptors exposed to the hazard and the susceptibility, value and resilience of these receptors. The susceptibility describes the propensity of a particular receptor to experience harm during a given flood event. The standard approach, utilized in FloodRisk, to define the susceptibility of elements at risk and to estimate direct flood damages is the use of damage (or susceptibility) functions (Smith Citation1994). These functions define, for the respective elements at risk, the relationship between hazard and exposure characteristics and the damage that can be expected under the given circumstances (Merz et al., Citation2010). The value is used to express the degree of harm to a receptor, and can be expressed in monetary terms, as maximum asset value, or by intangible impacts (e.g. number of people who died) (Meyer et al., Citation2013). Moreover, the quantification of damages depends on the aims of the flood risk analysis. While public governments require assessments of the total costs to the economy and/or society, insurance companies’ interests lie mainly in assessing their insured losses. For example, the land-use or building damages may be monetized as replacement costs (i.e. the estimated new value of the object or class), or depreciated/repair costs (i.e. an estimate of the present-day cost of replacement or reparation). Finally, the resilience describes the ability of the receptor that has been harmed to recover from the flood event and/or adapt to a change in conditions that may have occurred in a timely and efficient manner. The resilience could include structural (e.g. dam, levees) and non-structural interventions (knowledge and reliability).
The FloodRisk engine workflow
FloodRisk is composed of two main calculation workflows capable of computing economic direct damages and loss of life. In the GIS-based system FloodRisk, first, the elements (e.g. land-use maps or building maps, infrastructure such as road networks, railroads, and census blocks) actually at risk from flooding are recognized. The identification of assets at risk is established by overlaying object or land-use data and population census data with flood extent maps, quantitatively identifying the respective values of the exposed elements to derive damage estimates of the exposed assets. Then, the susceptibility can be defined by users utilizing the vulnerability curves and, therefore, the damages estimated.
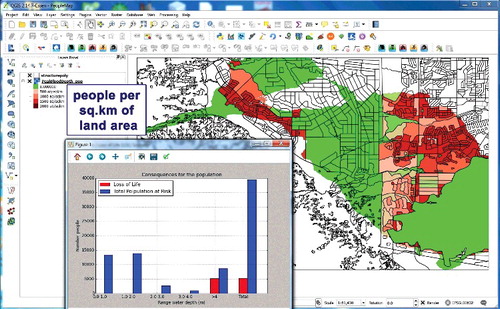
Moreover, flood mitigation measures (e.g. levees or early warning) are also important resilience parameters. For example, precautionary measures as important damage-influencing variables can be taken into account for the evaluation and development of effective risk mitigation strategies. Hence, according to the above-described approach, the FloodRisk plug-in permits the acquisition of several output results: the evaluation of structural and direct economic damages (), and the estimation of the population at risk (PAR) and loss of life (). These results are shown in the form of tables, charts (i.e. histograms) and maps. The use of maps to visualize outputs could improve stakeholders’ knowledge of spatio-temporal features of a flood risk area. Any system is spatially distributed and the way in which it is distributed can have significant effects on when a flood event will occur. Therefore, flood damage maps are useful to decision-makers in understanding where flood risk hotspots are, and for identifying the strategies most likely to limit the risk in those areas in order to support decision-making and improve knowledge of risk assessment and management.
Figure 5. Example of economic damage results: the map shows the damages as a ratio of the total asset value in %, as expressed on the legend, reported in the table of contents (TOC), that uses a colour scale to highlight the degree of damage of the different elements at risk (e.g. dark red represents zones that could be potentially more damaged and, thus, more critical); the graph summarizes, in the form of a histogram, the economic damage for each land-use category. Moreover, all the results data can be visualized and exported in the form of a table (see user manual at https://github.com/FloodRiskGroup/FloodRisk-doc/tree/master/FloodRiskUserManual for more information).
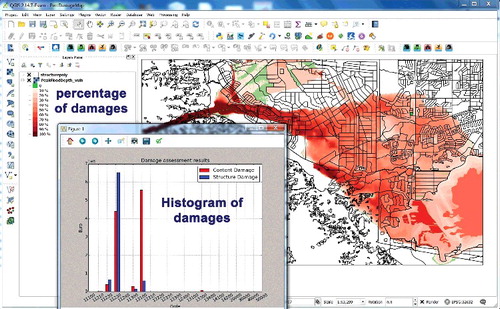
Figure 6. Example of human losses results: the map shows the density of the population at risk in the different areas as inhabitants/km2 as expressed on the legend that uses a colour scale to highlight the degree of population at risk in different areas (e.g. dark red represents the zones in which the flood events could potentially affect more people); the graph summarizes, in the form of a histogram, the estimated loss of life divided on the basis of flood water depth range. Moreover, all the results data can be visualized and exported in the form of a table (see user manual at https://github.com/FloodRiskGroup/FloodRisk-doc/tree/master/FloodRiskUserManual for more information).
With regard to indirect costs, this version of the FloodRisk plug-in does not account for them because the potential transfer of these methods to practitioners and stakeholders is quite unrealistic (Green et al. Citation2011). Despite the efforts of different authors to account for indirect impacts (Albano et al. Citation2013, Citation2014; Karagiorgos et al. Citation2016), there is a need for a better understanding of the processes leading to damage that requires a high degree of skill to run and entails complex mechanisms and uncertainties.
Economic damages calculator
For tangible damage, the FloodRisk procedure holds true for relative damage functions that express damages as a ratio of the total asset value (0 = no damage to 1 = total destruction). These damage functions can be represented as depth–damage curves that combine the type of land-use and the inundation depth but other hazard parameters can also be taken into account, e.g. flow velocity, to consider the different nature of the forcing event (e.g. flash flood instead of river flood) for which risk quantification is performed ().
Once flood damages were calculated for the flood events with several return times, the EAD was determined as follows:(1)
(1) where
and
are, respectively, the exceedance probability increment and average damage of two events with exceedance probabilities
and
.
Social damages calculator
For human losses calculation, the FloodRisk engine combines population exposed to the flood (i.e. population at risk) and fatality rates related to the characteristics of the flood (i.e. flood severity) to estimate loss of life (). The FloodRisk plug-in utilizes several parsimonious methods and generally available contributing factors to evaluate the ‘fatality rate’ (Graham, Citation1999), which is defined as the number of fatalities divided by the number of people exposed, or the PAR. These contributing factors include hazard factors (e.g. water depth and water velocity), general preparedness of the society (e.g. existence of public education on flood risk, warning and communication systems, coordination between emergency agencies and authorities, and time of day), warning factors (e.g. warning time) (DHS Citation2011) and an additional parameter (e.g. degree of readiness of population) (Escuder-Bueno et al., Citation2012). The latter concerns the existence of public education on flood risk, warning and communication systems, and coordination between emergency agencies and authorities (Albano et al. Citation2014). These factors should also be estimated through a complete understanding of the characteristics of the local communities such as flood risk perception of the inhabitants and fear and trust in decision-makers (Bodoque et al. Citation2016). Once loss of life has been calculated for several flood events with different return times, the expected annual loss of life can be determined.
Risk assessment for cost–benefit analysis
Therefore, as said above, by combining expected damages and exceedance probabilities of the flooding scenarios, it was possible to obtain data not only the localization of risk area, but also on risk quantification in monetary terms. Thanks to these different calculators, the FloodRisk tool can be useful for decision-making in the context of cost–benefit analysis of flood mitigation measures (‘benefit’ is determined by the difference between current expected losses and residual ones that may continue to occur even after the implementation of the interventions). The F–D and F–N curves can be utilized to capture the impact of structural and non-structural measures on flood consequence reduction. As shown in the following section, a compact and simplified representation of the estimated level of economic damages is the F–D curve that presents the annual exceedance probability and estimated economic damages (the area under this curve represents economic risk). Instead, the F–N curve presents the cumulative annual exceedance probability of the expected estimated level of potential fatalities and the area under the curve corresponds to total societal risk.
How the FloodRisk plug-in can support stakeholders in their compliance with FRM: a benchmark case study
Different decisions must be made by different stakeholders at different points in the FRM process; decisions may be about what action to take against the risk of flood, how to respond in the event of a flood, or the best means of recovery from a flood. These decisions are clearly interlinked; deciding what action to take against the risk of a flood depends upon understanding what will be the consequences of a flood and the best approach to recovering from a flood. In this context, the flood risk analysis, performed here, can provide information as to some of the consequences of adopting different courses of action, and to do so in a way that responds to the nature of the task with which stakeholders are faced.
In this context, we present a benchmark example case study that represents flooding of a closer town located 4 km downstream of a dam (the name and geographical location of the town is not explicitly provided as in Seda-Sanabria et al. (Citation2013)). A simplified scheme of the location of the urban area is shown in .
Figure 7. Overall scheme of the urban area downstream of the dam.
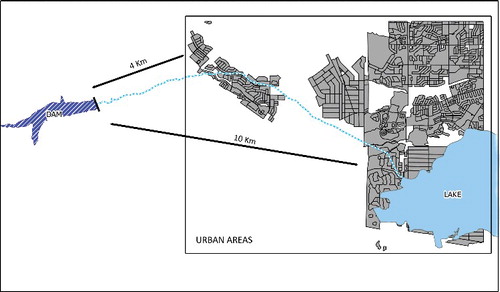
Hazard mapping is beyond the scope of the paper and, therefore, for detailed information linked to the presented example, we refer to Mancusi et al. (Citation2013). A 2D hydraulic model is sufficient for this type of modelling considering that 3D models are still expensive to run and more attractive for fast flow in transitory regimes, especially for those applications with severe discontinuities in the fluid (Amicarelli et al. Citation2015; Albano et al. Citation2016).
The analysis utilizes a cost–benefit approach for showing how structural (e.g. a dam) and non-structural (e.g. warning system, risk communication, public education on flood risk, and so on) measures can considerably decrease the cost of floods for households. In particular, it includes five different alternatives: (1) the base case (BC) (i.e. the situation without dams or any non-structural measures (Scenario 0: BC)); (2) the situation with only structural measures (e.g. a small dam (DAM) (Scenario 1: DAM)); (3) the situation with only non-structural measures whose creation does not involve the active engagement of citizens (i.e. warning systems (WS) and coordination between emergency agencies and authorities (CO) (Scenario 2: BC+WSCO)); (4) the situation with ‘flood-proof’ citizens, i.e. informed and prepared for a flood event (i.e. several non-structural measures, such as the combination of public education on flood risk (EP), warning systems (WS), risk communication (CM), and coordination between emergency agencies and authorities (CO) (Scenario 3: BC+WSCOEPCM)); and finally, (5) the combination of all the above-described structural and non-structural measures (Scenario 4: DAM+WSCOEPCM).
The results are shown in the form of a simple and informative graph, called the F–N curve (Escuder-Bueno et al. Citation2012; Albano et al. Citation2017b). It represents the annual cumulative exceedance probability of a certain level of consequences, in terms of potential fatalities (). These curves are a useful way of presenting risk information that can be used by managers and system designers to help decision-making about risk (IEC/FDIS 31010 Citation2009), and they are appropriate for comparison of risks from different situations when sufficient data is available, such as the comparison between the situation with and without a number of structural and non-structural measures. The results of the F–N curve integrated in cost–benefit processes aim at reconstructing or creating information, in a reasoned, consistent and orderly way, that can be useful to an actor taking part in a decision process.
Figure 8. Example of risk information based on comparison of F–N curves for an idealized case study.
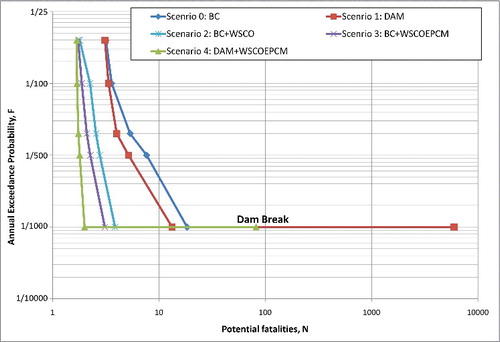
As shown in , compared with the ‘Scenario 0: BC’ do-nothing option, the so-called ‘residual’ loss pattern and magnitude typically differ considerably between mitigation options. The first distinction is a physical intervention designed to keep water out, which, in a more severe flood, design standard or level will fail, resulting in losses typically greater than would have occurred without mitigation in a flood of the same magnitude/return period (the vertical sections of the lines) in . Moreover, dam structures retain water and prolong flooding after having failed (the horizontal sections of the lines) in . Therefore, flood events, which include potential failure of flood defense infrastructure, show higher n values than non-failure flood events, but are associated with lower probabilities (‘low probability-high consequence’ flood events).
The structural measures, if these do not fail due to overdesign floods, continue to mitigate flood impacts, even in extreme events, and effectively shift the loss–probability curve left. In addition to the structural mitigation strategy, we show that the combination of several non-structural actions could further reduce potential loss of life, and limit the risk increase that would occur without their implementation. Finally, our results show that the combination of structural and non-structural strategies is the most powerful in reducing the overall risk. For example, it is estimated by calculating the difference in the areas under the curves of the different scenarios, that for the considered flood events (i.e. return times (Rt) equal to 25, 100, 500, 1000, 10,000 years) the potential benefit of these measures is about 3 lives/year. The results of the evaluation of the different scenarios analyzed are reported in . Since non-structural measures are usually easier and less expensive to implement than structural measures, they are a particularly accessible way to reduce risk. However, there are large geographical differences in the effectiveness of these mitigation measures, in particular, in case of limited financial resources available.
Table 1. Results of the estimation of loss of life (LOL) for the selected case study and the five chosen scenarios.
Table 2. Maximum damage values per damage category (Huizinga Citation2007).
The impact of different measures on the magnitude and frequency of consequences is strongly related to the socio-economic and environmental context. These results, together with economic direct damages assessment, are able to support decision-making regarding the prioritization of risk prevention measures (in order to optimize investments), and the evaluation of different mitigation actions and insurance agencies (in order to improve the estimation of risk-based premiums for diverse spatial areas) on the basis of increased understanding of expected compensation payments. Moreover, these kinds of analyses can support engineers and companies working on site-specific flood prevention, and eventually, in post-event damages assessment (for example, to obtain information from simulated scenarios before data collection).
FloodRisk sensitivity analysis
The estimation of total costs due to flooding, considering also their distribution within the territory, reflects context- and event-specific characteristics, such as extent and type of flood event (e.g. flash flood, river flood, dam-break event, etc.), spatial variability and quantity of exposed elements, resolution and type of input data, cultural or geographical differences, and so on. Hence, increased effort should be devoted to analyze the sensitivity of risk model parameters in order to integrate and reduce uncertainties in decision-making processes in order to allow decision-makers and stakeholders to make more informed and better decisions (Albano et al. Citation2017a; Inam et al. Citation2017c).
For the purposes of this study, we consider hazards as inputs and neglect hazard-related uncertainties; these are usually associated with the selection of the appropriate model parameterization, the consideration of dikes and dike breaches, and the calibration and validation of models (de Moel et al. Citation2015). When deterministic simulation models are applied to anticipate the effects of management actions and thus support decision-making, sensitivity analysis is a recommended practice to assess the robustness of the assessment (and thus of the final decision) with respect to uncertain model inputs or assumptions. Therefore, a sensitivity analysis of the FloodRisk plug-in is examined in this section to study the response of vulnerability parameters to flood damage assessments.
The FloodRisk plug-in framework is based on the unit loss method (Wagenaar et al. Citation2016), and therefore, the parameters that have the power to highly affect the results are object data, maximum damage figures and damage functions. Moreover, the FloodRisk plug-in permits the use of an object-based approach – which uses a large number of object types – such as a buildings map or land-use approach (i.e. aggregated surface area-based models, where the exposure data input is in the form of a land-use map). Therefore, the FloodRisk plug-in is able to serve multiple scales and data types on the basis of the study limiting the correlated aleatory uncertainties, i.e. inherent randomness and natural variability. Therefore, the sensitivity analysis described here focuses on maximum damage figures/values and the damage functions utilized.
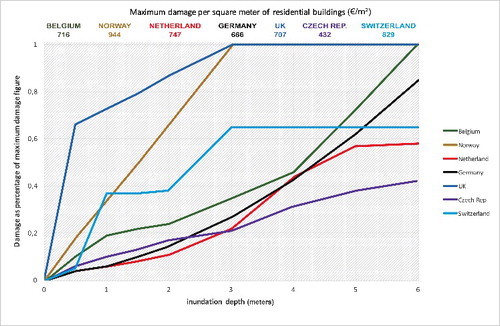
In this context, we tried to combine information from different damage functions with maximum damage values among European countries (described in ) to get a better assessment of model sensitivities in tangible direct damage outcomes due to a dam-break event (the geospatial data used are described in the user manual at https://github.com/FloodRiskGroup/FloodRisk-doc/tree/master/FloodRiskUserManual and are available at https://github.com/FloodRiskGroup/FloodRisk-doc). We used vulnerability parameters of seven countries collected and harmonized by the European Joint Research Center (JRC) (Huizinga Citation2007). Since it is generally not possible to assess damages on the basis of individual objects due to a lack of available data and resources, similar units or elements at risk are usually pooled together and classified as a single group. Therefore, the land-use classification is based on economic sectors, as is often the case in such models. This is based on the understanding that different economic sectors (e.g. industries, residential, commercial, agricultural and roads) show different characteristics concerning assets and susceptibility. The damage function in Huizinga (Citation2007), of which shows an example, combines the type of land-use and the inundation depth (i.e. depth–damage curves). The outcome of the functions can be the absolute monetary loss (i.e. the expected damages are directly estimated in monetary terms), or relative loss functions (i.e. the loss is given as a percentage of the maximum asset value). These functions have been constructed for damage categories that contribute most to damage and that account for more than 80% of total damage (Huizinga Citation2007). For example, residential homes, industry, roads and – for the sake of coverage – agricultural areas are taken into account by the JRC study. Moreover, the definitions of maximum damages and damage functions are aligned to make a fair comparison between European countries. The available regional values for standardized Gross Domestic Product per capita on purchasing power standards are used for this purpose, as in Huizinga Citation2007.
Figure 9. Depth–damage functions and corresponding maximum damage figures for the land-use class called ‘Residential buildings’ in the seven countries with collected literature by Huizinga (Citation2007).
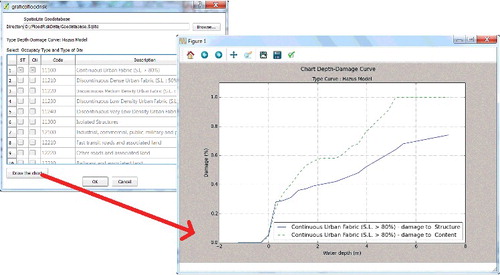
Moreover, the FloodRisk database is organized to include parameters such as water velocity, flood duration and contamination. However, it is difficult to include the large number of parameters that may influence flood damage when constructing damage functions. Therefore, only the water depth is used (), as there is no standard and reliable procedure to assess quantitative individual and combined effects of these parameters on damages.
Figure 10. Depth–damage curve visualization through FloodRisk GUI.
Hence, in this study, we calculated risk based on vulnerability curves, and maximum values derived from the study of the European Joint Research Centre (JRC) conducted by Huizinga (Citation2007) (see and ).
Table 3. Results of model runs for individual land-use classes.
Figure 11. Magnitude of estimated damages computed by different country-specific vulnerability functions, and the corresponding breakdown into individual land-use classes. The corresponding numbers can be found in . Note: damages to roads and agriculture are not displayed because they only play a minor role in total damages estimation.
The variation in sensitivity of damage estimates is, therefore, not analyzed between specific sectors (e.g. industries, residential, agricultural, and so on). Moreover, this sensitivity of the damage estimates, addressed as the amount of total damages assessed, has a complete vision of the sensitivity behaviour of the chosen vulnerability parameters (i.e. depth–damage curves and maximum asset values). These are expressed with the coefficient of variation (CV), the standard deviation of the damage divided by the mean of the damage, which has no unit and is therefore independent of the size of the flood event.
Coefficient of variation is identified, first, by using average depth–damage functions and country-specific maximum damage. We have previously used UK and Czech Republic depth–damage curves to evaluate (in ) the maximum and the minimum possible outcomes, respectively. We obtained maximum values of 24%, making the relative variability 2.4. Then, we used the average maximum values among countries with country-specific depth–damage functions, obtaining a value of 65% (i.e. the relative variability is 6.5).
The quantitative results show that the model results are very sensitive to uncertainty in both the depth–damage curve and maximum value, whereby the first has a larger effect than the latter. Thus, care needs to be taken when using aggregated land-use data for flood risk assessment because the depth–damage functions are strongly influenced by the different characteristics concerning assets of different countries, and it is essential to adjust asset values to the regional economic situation and property characteristics. Indeed, the high degree of variation among specific countries’ parameters may be due to the shape of the functions and the data (i.e. synthetic or empirical) used in their construction, the use of depreciative value or replacement value, and the inclusion of indirect costs in the damage estimates.
Discussion
The proposed software supports the transparent production of complete event scenarios that can be used for different types of analyses reflecting and serving the needs of a wide spectrum of users. The adoption of a collaborative and open-source geospatial model for flood loss estimation, due to present and future flood events, has been showed as crucial for allowing stakeholders to respond in a simple, dynamic and transparent way to ‘what-if’ questions, such as ‘what benefits do we get with a dam or a forecasting system?’.
The flexibility and modularity of FloodRisk can allow its use in different cases and in different geographic regions. However, as highlighted in the sensitivity analysis, the application of the proposed software to other territorial contexts requires a critical consideration of vulnerability input within the risk assessment process, and could be supported by an increase in the quality of damage data and data on elements at risk, as well as the degree of detail. This can be done, for example, by continuously recording the consequences of natural processes on the built environment.
The sensitivity of the model parameters to local characteristics of the analyzed area has highlighted the need of decision-makers to be aware of the limitation accuracy of risk analysis outcomes. Indeed, there is a demand for a better understanding of the reliability and uncertainties related to flood risk estimates. Therefore, future studies should address the integration of uncertainty quantification in the proposed model and its communication to end-users.
FloodRisk is a first step to allow for the creation of an open system through data sharing and can promote a transparent communication and accountability process through which a range of actors can participate. Moreover, stakeholder engagement and active participation can increase the legitimacy of decision-making processes as well as their acceptance. In this light, one of the planned applications of the model is – after having performed a calibration on an observed and well-monitored past event – to assess the relative change in future (compared to present) flood damages and risk under scenarios of change in both physical and socio-economic conditions (e.g. climate change, land subsidence, land-use change, population increase, increase in asset values, etc.), taking into account the rights of individuals and society that must be protected, and the right to have the interests of all treated with fairness (i.e. tolerability standard).
Conclusion
In this paper, an open-source software capable of computing flood risk assessment, with a focus on flood consequences analysis, was presented. At present, FloodRisk is composed of two main calculation workflows capable of computing economic direct damages and loss of life, supported by several GUI forms for data storing, management and visualization. The various outputs can be used mainly to carry out flood risk reduction or mitigation measures, such as pre- and post-flood planning and management, to identify regions with higher flood risk losses within a certain country in order to prioritize mitigation actions – hence, utilizing limited resources efficiently and fairly and reducing risk – and finally, to increase capacity for the recovery phase. The paper highlights, through an example application, how the FloodRisk tool can support operatively diverse stakeholders serving different purposes and applications by showing how the strategies examined in this paper can significantly reduce flood risk. These strategies are diverse and include the use of structural measures, such as dams, and a combination of non-structural measures (e.g. flood-proofing measures). Further research should address how to stimulate discussion on the benefits of implementing and encouraging the use of these strategies.
Moreover, this free and open-source tool can promote transparent communication and guided learning for better decision-making in FRM. Due to its interoperable, modular, cross-platform and QGIS-based development philosophy, the implementation of FloodRisk can advance, due to its community-based approach where anyone can contribute with their own methods and formulae, test the platform, or translate its GUI into different languages. This differs from traditional practices in FRM, where a closed group of developers and enterprises makes all the decisions.
This can be understood as a starting point towards a more long-term perspective that emphasizes the integration of cost assessment into a wider SD framework. It is a step towards a more iterative understanding of decision-making that focuses on learning and revision, and at the same time, not only allows for, but requires, stakeholder engagement.
Acknowledgments
We would like to thank all contributors to the FloodRisk project that have helped in terms of research and development, data, documentation, translation and testing.
Disclosure statement
No potential conflict of interest was reported by the authors.
Additional information
Funding
Related Research Data
References
- Albano R, Amicarelli A, Mirauda D, Agate G, Sole A, Adamowski J. 2016. Modeling large floating bodies in urban floods via a smoothed particle hydrodynamics model. J Hydrol. 541:344–358.
- Albano R, Craciun I, Mancusi L, Sole A, Ozunu A. 2017a. Flood damage assessment and uncertainty analysis: the case study of 2006 flood in Ilisua Basin in Romania. Carpath J Earth Environ Sci. 12:335–346.
- Albano R, Mancusi L, Abbate A. 2017b. Improving flood risk analysis for effectively supporting the implementation of flood risk management plans: the case study of “Serio” Valley. Environ Sci Policy. 75:158–172.
- Albano R, Mancusi L, Sole A, Adamowski J. 2015a. Collaborative strategies for sustainable EU flood risk management: FOSS and geospatial tools - challenges and opportunities for operative risk analysis. ISPRS Int J Geo-Inf. 4:2704–2727.
- Albano R, Manfreda S, Celano C. 2017c. MY SIRR: minimalist agro-hydrological model for sustainable irrigation management – soil moisture and crop dynamics. Software X. 6:107–117.
- Albano R, Pascale S, Sdao F, Sole A. 2013. A GIS model for systemic vulnerability assessment in urbanized areas supporting the landslide risk management. Landslide Sci Pract Risk Assess Manage Mitig. 6:723–731.
- Albano R, Sole A, Adamowski J. 2015b. READY: a web-based geographical information system for enhanced flood resilience through raising awareness in citizens. Nat Hazards Earth Syst Sci. 15:1645–1658.
- Albano R, Sole A, Adamowski J, Mancusi L. 2014. A GIS-based model to estimate flood consequences and the degree of accessibility and operability of strategic emergency response structures in urban areas. Nat Hazards Earth Syst Sci. 14:2847–2865.
- Amicarelli A, Albano R, Mirauda D, Agate G, Sole A, Guandalini R. 2015. A smoothed particle hydrodynamics model for 3D solid body transport in free surface flows. Comput Fluids. 116:205–228.
- Apel H, Aronica GT, Kreibich H, Thieken AH. 2009. Flood risk analyses-how detailed do we need to be? Nat Hazards. 49:79–98.
- Barredo JI. 2009. Normalised flood losses in Europe: 1970–2006. Nat Hazards Earth Syst Sci. 9:97–104.
- Berkes F. 2007. Understanding uncertainty and reducing vulnerability: lessons from resilience thinking. Nat Hazards. 41:283–295.
- Bodoque JM, Amerigo M, Diez-Herrero A, Garcia JA, Cortes B, Ballesteros-Canovas JA, Olcina J. 2016. Improvement of resilience of urban areas by integrating social perception in flash-flood risk management. J Hydrol. 541(Part A):665–676.
- De Bono A. 2015. Chatenoux, B. A global exposure model for GAR 2015. Geneva: UNEP/Grid-Geneva; UNISDR.
- de Moel H, Jongman B, Kreibich H, Merz B, Penning-Rowsell E, Ward PJ. 2015. Flood risk assessments at different spatial scales. Mitig Adapt Strateg Glob Change. 20(6):865–890.
- [DHS] Department of Homeland Security. 2011. Estimating loss of life for dam failure scenarios, Dams Sector. United States. Department of Homeland Security.
- Domeneghetti A, Carisi F, Castellarin F, Brath A. 2015. Evolution of flood risk over large areas: quantitative assessment for the Po river. J Hydrol. 527:809–823.
- Escuder-Bueno I, Castillo-Rodríguez JT, Zechner S, Jöbstl C, Perales-Momparler S, Petaccia G. 2012. A quantitative flood risk analysis methodology for urban areas with integration of social research data. Nat Hazards Earth Syst Sci. 12:2843–2863.
- [FEMA] Federal Emergency Management Agency. 2003. HAZUS-MH technical manual. Washington (DC): FEMA, Department of Homeland. Technical Report.
- Folke C. 2006. Resilience: the emergence of a perspective for social ecological system analyses. Global Environ Chang. 16:253–267.
- Folke C, Hahn T, Olsson P, Norberg J. 2005. Adaptive governance of social-ecological systems. Ann Rev Environ Resources. 30:441–473.
- Graham WJ. 1999. A procedure for estimating loss of life caused by dam failure, DSO-99-06. Denver (CO): US Department of Interior, Bureau of Reclamation.
- Green C, Viavattene C, Thompson P. 2011. Guidance for assessing flood losses. CONHAZ Report. http://conhaz.org/CONHAZ%20REPORT%20WP061.pdf.
- Huizinga HJ. 2007. Flood damage functions for EU member states. HKV Consultants, Implemented in the framework of the contract #382442-F1SC awarded by the European Commission – Joint Research Centre.
- IEC/FDIS 31010. 2009. ISO international standard: risk management – risk assessment techniques. IEC/FDIS 31010:2009 (E), 2009.
- Inam A, Adamowski PO, Halbe J, Malard J, Albano R. 2017a. Coupling of a distributed stakeholder-built system dynamics socio-economic model with SAHYSMOD for sustainable soil salinity management. Part 1: model Development. J Hydrol. 6:596–618.
- Inam A, Adamowski PO, Halbe J, Malard J, Albano R. 2017b. Coupling of a distributed stakeholder-built system dynamics socio-economic model with SAHYSMOD for sustainable soil salinity management. Part 2: Model coupling and application. J Hydrol. 551:278–299.
- Inam A, Adamowski J, Prasher S, Albano R. 2017c. Parameter estimation and uncertainty analysis of spatial agro hydro salinity model (SAHYSMOD) in semi-arid climate of Rechna Doab, Pakistan. Environ Model Softw. 6:186–211.
- IPCC. 2007. Climate change 2007: the physical science basis. In: Solomon S, Qin D, Manning M, Chen Z, Marquis M, Averyt KB, Tignor M, Miller HL, editors. Contribution of Working Group I to the Fourth Assessment Report of the Intergovernmental Panel on Climate Change. New York (NY): Cambridge University Press; pp. 996.
- Karagiorgos K, Thaler T, Heiser M, Hubl J, Fuchs S. 2016. Integrated flash flood vulnerability assessment: insights from East Attica, Greece. J Hydrol. 541(Part A):553–562.
- Kjellgren S. 2013. Exploring local risk managers' use of flood hazard maps for risk communication purposes in Baden-Württemberg. Nat Hazards Earth Syst Sci. 13:1857–1872.
- Kummu M, de Moel H, Ward PJ, Varis O. 2011. How close do we live to water? A global analysis of population distance to freshwater bodies. PLoS ONE. 6:e20578.
- Mancusi L, Giosa L, Cantisani A, Sole A, Albano R. 2013. Risk assessment for hypothetical dam break - a method for the rapid and consistent evaluation. ICOLD Proceedings, 12th International Benchmark Workshop on Numerical Analysis of Dams; Oct 2–4; Graz, Austria.
- Mercer J, Kelman I, Lloyd K, Suchet-Pearson S. 2008. Reflections on use of participatory research for disaster risk reduction. Area. 40(2):172–183.
- Merz B, Kreibich H, Schwarze R, Thieken A. 2010. Review article assessment of economic flood damage. Nat Hazards Earth Syst Sci. 10:1697–1724.
- Meyer V, Becker N, Markantonis V, Schwarze R, van den Bergh JCJM, Bouwer LM, Bubeck P, Ciavola P, Genovese E, Green C, et al. 2013. Review article: assessing the costs of natural hazards – state of the art and knowledge gaps. Nat Hazards Earth Syst Sci. 13:1351–1373.
- Munich Re. 2015. Weather catastrophes and climate change. Munchen: Munchener Ruckversicherungs-Gesellschaft; p. 2–264. ( Knowledge series).
- Neteler N, Bowman NH, Landa M, Metz M. 2012. GRASS GIS: a multi-purpose open source GIS. Environ Model Softw. 31:124–130.
- Penning-Rowsell E, Johnson C, Tunstall S, Tapsell S, Morris J, Chatterton J, Green C. 2005. The benefits of flood and coastal risk management: a handbook of assessment. Techniques. London: Middlesex University Press.
- Sayers P, Galloway G, Penning-Rowsell E, Yuanyuan L, Fuxin S, Yiwei C, Kang W, Le Quesne T, Wang L, Guan Y. 2014. Strategic flood management: ten ‘golden rules’ to guide a sound approach. Int J River Basin Manage. 13:137–151.
- Scawthorn C, Flores P, Blais N, Seligson H, Tate E, Chang S, Mifflin E, Thomas W, Murphy J, Jones C, et al. 2006. HAZUS-MH flood loss estimation methodology, II. Damage and loss assessment. Nat Hazards Rev. 7:72–81.
- Seda-Sanabria Y, Matheu EE, McPherson TN. 2013. Computational challenges in consequence estimation for risk assessment. Proceedings of the ICOLD—12th International Benchmark Workshop on Numerical Analysis of Dams; Oct 2–4; Graz, Austria.
- Smith DI. 1994. Flood damage estimation – a review of urban stage–damage curves and loss functions. Water SA. 20(3):231–238.
- Sole A, Albano R, Pascale S, Giosa L, Sdao F. 2012. A decision-making support model for systemic vulnerability assessment in urbanized areas. Urban and regional data management, UDMS Annual 2011. Proceedings of the Urban Data Management Society Symposium 2011. London: Taylor & Francis; p. 211–219.
- Sole A, Giosa L, Albano R, Cantisani A. 2013. The laser scan data as a key element in the hydraulic flood modelling in urban areas. Int Arch Photogramm Remote Sens Spatial Inf Sci. XL-4/W1:65–70.
- Steiniger S, Bocher E. 2009. An overview on current free and open source desktop GIS developments. Int J Geogr Inf Sci. 23:1345–1370.
- Swain NR, Latu K, Christensen SD, Jones NL, Nelson EJ, Ames DP, Williams G. 2015. A review of open source software solutions for developing water resources web applications. Environ. Model. Softw. 67:108–117.
- te Linde AH, Aerts JCJH, Bakker AMR, Kwadijk JCJ. 2010. Simulating low probability peak discharges for the Rhine basin using resampled climate modeling data. Water Resour Res. 46:1944–7973.
- Vorogushyn S, Lindenschmidt KE, Kreibich H, Apel H, Merz B. 2012. Analysis of a detention basin impact on dike failure probabilities and flood risk for a channel-dike-floodplain system along the river Elbe, Germany. J Hydrol. 436–437:120–131.
- Wagenaar DJ, de Bruijn KM, Bouwer LM, de Moel H. 2016. Uncertainty in flood damage estimates and its potential effect on investment decisions. Nat Hazards Earth Syst Sci. 16:1–14.
- World Bank. 2014. Understanding Risk in An Evolving World—Emerging Best Practices in Natural Disaster Risk Assessment. Columbia (DC).