
ABSTRACT
The detection of active movements that could threat the infrastructures and the population is one of the main priorities of the risk management chain. Interferometric Synthetic Aperture Radar (InSAR) techniques represent one of the most useful answers to this task; however, it is difficult to manage the huge amount of information derived from the interferometric analysis. In this work, we present a procedure for deriving impact assessment maps, over a regional test site, using as starting point Sentinel-1 SAR (Synthetic Aperture Radar) images and a catalogue of elements at risk that acts as a second input of the methodology. We applied the proposed approach, named as Vulnerable Elements Activity Maps (VEAM), to the islands of Gran Canaria, La Gomera and Tenerife (Spain), where we analysed SAR images covering the time interval November 2014–September 2016. The methodology, meant to be a powerful tool for reducing the time needed for a complete analysis of a full stack of InSAR data, is ideally suited for Civil Protection Authorities. The application of the methodology allowed to detect 108 areas affected by active deformation that are threatening one or more elements at risk in 25 municipalities of the three islands.
Introduction
An integrated risk management chain needs the exchange of information and experience between public authorities (i.e. Civil Protection entities) and research structures (universities and research centres) to guarantee the interconnection between the natural system and the anthropic elements at risk (Salvati et al. Citation2016). One of the key features for every geohazard risk analysis and for providing useful information to the Civil Protection authorities is the definition of where and with which magnitude a certain geohazard is affecting a territory at different spatial scales, ranging from a single city to an entire region.
In this framework, the radar remote sensing technique is particularly suited for the multiscale analysis of ground deformations (Fell et al. Citation2008). Differential InSAR represents the first widely used technique to exploit the phase difference (interferogram) between two radar images to derive ground displacements with millimetre accuracy (Massonnet and Feigl Citation1998). The technological evolution of this approach led to the development of specific algorithms of analysis for large stacks of SAR images, known as Advanced Differential InSAR, that allow to derive the time series of deformation of each measurement point (Crosetto et al. Citation2016). One of the most commonly used Advanced Differential InSAR techniques is the Persistent Scatterer Interferometry (PSI), successfully applied by many authors in the monitoring of different geohazards, such as volcanic activity (i.e. Peltier et al. Citation2010; Bonforte et al. Citation2011; Lagios et al. Citation2013), tectonic motions (i.e. Massironi et al. Citation2009; Vilardo et al. Citation2010; Lagios et al. Citation2012; Lee et al. Citation2017), subsidence (i.e. Abidin et al. Citation2013; Tomás et al. Citation2014; Solari et al. Citation2016; Béjar-Pizarro et al. Citation2017) or landslides (i.e. Notti et al. Citation2010; Herrera et al. Citation2013; Kim et al. Citation2015; Oliveira et al. Citation2015). Moreover, the temporal and spatial resolution of the PSI products has been also exploited to define the state of activity of geohazards and update pre-existent geohazard inventories in order to provide useful information for the risk management and urban planning of a region or a municipality (e.g. Roessner et al. Citation2005; Hölbling et al. Citation2012; Righini et al. Citation2012; Barra et al. Citation2016; Bianchini et al. Citation2016; Calvello et al. Citation2016; Ciampalini et al. Citation2016; Raspini et al. Citation2016).
This work exploits the above-mentioned characteristics of the PSI analysis for the fast estimation of active geohazards using a methodology for deriving the impact of the detected deformations on buildings and infrastructures. This procedure has been applied to a regional test site represented by three islands of the Canaries archipelago: Gran Canaria, La Gomera and Tenerife (Spain). The PSI approach has been applied to the SAR images acquired by the C-band constellation Sentinel-1 composed by two twin satellites travelling on the same orbit: 1A, launched on April 2014 and 1B, launched on April 2015. This geometry guarantees a significant reduction in the revisit time on an area with respect to the previous C- band sensors (ERS 1/2 and Envisat), allowing to obtain an image every 12–6 days. Moreover, the 250-km ground coverage of the images associated with a spatial resolution of 4 × 14 m permits to acquire at high resolution on very wide areas with high frequency (Torres et al. Citation2012).
The monitored sites were selected in the framework of the European ECHO (European Civil Protection and Humanitarian Aid Operations) project SAFETY (Sentinel for Geohazards Regional Monitoring and Forecasting) for their predisposition to different types of geohazards (i.e. landslides, subsidence and volcanic activity) that threaten the urban fabric and the population, for the availability of significant thematic and environmental data and for the specific interest of the Civil Protection Authorities involved in the risk management of the Islands. In particular, the Canary Islands Civil Protection is under the responsibility of the Ministry of Territorial Policy, Sustainability and Security of the regional government of the Canary Islands. This entity acts at regional and local level, governed by two structures: the Centre for Emergency and Security Coordination and the Emergency and Rescue Group. The first one is a public service that regulates every emergency call received in the Canary Islands and supervises the resources allocation during an emergency. The second one is the action group in charge of search and rescue missions for regional government and it is aimed at giving a quick response to every unexpected situation that could take place in the autonomous community.
The proposed methodology aims at defining a fast, reliable and simply applicable way to use the huge amount of data obtained from the InSAR processing of Sentinel-1 radar satellite images, detecting active deformation areas (ADA) that could be due to an active geohazard, evaluating the potential impact of these deformations on the vulnerable structures (buildings, roads, etc…). The final output of the methodology is called VEAM and represents a product ideally suited for Civil Protection Authorities, defining those areas, at municipality and local scale, which represent a potential risk for the population.
Methodology description
Procedure
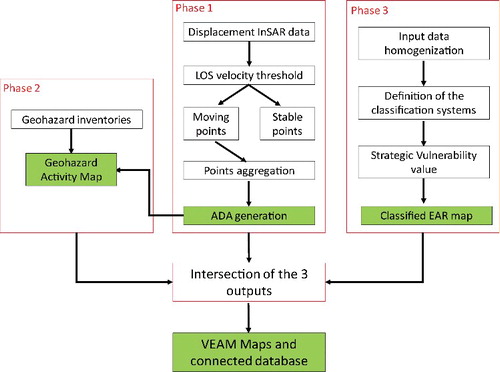
The procedure aims at generating VEAM throughout the definition of a simple work flow, whose final output is ideally suited for Civil Protection entities. The methodology consists of three parallel phases: (1) generation of ADA derived from the interferometric products, which can be periodically updated at every new processing of the radar data, (2) generation of Geohazard Activity Maps, through the intersection between geohazard inventories and the PSI-derived ADA and (3) the classification of the elements at risk catalogues. This classification is performed by using a system of 3 tables defined on the basis of the Strategic Vulnerability values of the different structures within each Civil Protection phase (Prevention and Preparedness, Emergency and Recovery). Finally, a fourth phase is required to intersect the three previously generated outputs in order to derive the VEAM final output (). All the phases are described below, however a more detailed description of the PSI processing, the ADA extraction and the Geohazard Activity Maps updating can be found in Barra et al. (Citation2017b).
Figure 1. Workflow for the proposed procedure. The light blue and green rectangles represent the intermediate and final outputs, respectively. ADA, active deformation areas; EAR, elements at risk; VEAM, Vulnerable Elements Activity Map.
All the data are managed in a Geographic Information System (GIS) and all the analysis and elaborations needed for the generation of the final output are implemented throughout the basic tools of a standard GIS platform.
Input data
The methodology here proposed is based on two input datasets:
| (1) | PSI-derived ground deformation map; | ||||
| (2) | Elements at risk catalogues of buildings, road network and infrastructures. | ||||
Deformation activity map
In this work, SAR images, acquired by the Sentinel-1A satellite, have been exploited to derive ground deformation maps for the three islands. The ground resolution of the sensor, in TOPS (Terrain Observation by Progressive Scans) mode, is about 4 m in range direction and 14 m in azimuth direction. Using only one of the two Sentinel-1 satellites, the revisit time on the area of interest is equal to 12 days. This high temporal sampling allows to reduce the temporal decorrelation of the interferometric pairs and to increase the number of coherent points (Hanssen Citation2001).
Fifty-one SAR images, spanning the period between 05/11/2014 and 19/09/2016, were analysed by means of the PSI technique. The used SAR images were acquired by the sensor in descending orbit with a VV polarization and an incidence angle of the radar signal ranging from 30° to 45°. The analysis of the images has been carried out with a PSI approach subdivided in two phases: the first consists in the calculation of the stack of interferograms and coherences; the second involves the generation of the deformation maps. The latter are derived applying the approach described by Devanthéry et al. (Citation2014) which exploits a 2+1D phase unwrapping using a set of redundant interferograms. The SRTM Digital Elevation Model (Farr et al. Citation2007) is used to process the Sentinel-1 images.
The obtained outputs reflect the radiometric characteristics of the Canary Islands where the large areas of sparse vegetation and rocky surfaces, especially at high altitude and around the main volcanic structures, bring to a high density of measurement points. On the other hand, in the areas where the vegetation cover increases, especially in the humid northern flanks, the density of Persistent Scatterers decreases ().
Figure 2. Deformation maps over the test site islands. The black dots represent the reference points, one for each island, chosen for the interferometric data processing. These points have been selected knowing a priori the areas characterized by no deformation. The image is overlaid on a 5 × 5 DEM-derived hillshade relief.
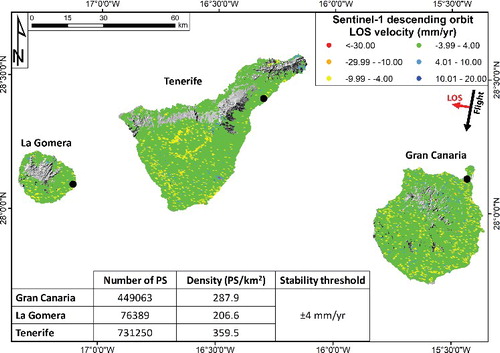
The obtained deformation map is composed of 1256701 PS points; the 58% of the total number of PSs is found in the Tenerife Island, the 36% in the Gran Canaria Island whereas only the 6% is found in La Gomera Island. At each Persistent Scatterer is associated the value of the annual linear velocity (mm/yr), estimated over the analysed period and the displacement accumulated at each sensor acquisition date (mm). The measures are referred to the movement of the ground point in the satellite Line of Sight (LOS) direction; movements towards the sensor are positive (represented in blue in the deformation maps) and movements away from the sensor are negative (represented in red). The stable points, defined by a stability threshold (equal to 4 mm/yr) that represent the sensitivity of the map (Barra et al. Citation2017a), are represented in green ().
Elements at risk catalogue
The elements at risk catalogues are a fundamental input of the proposed procedure, because of the necessity of a simple and fast way for qualitatively quantifying the possible impacts on the territory of the active movements detected with the PSI technique. According to the commonly used definition of an element at risk catalogue (Dai et al. Citation2002; Fell et al. Citation2005, Citation2008), the databases contains information about private buildings, economic and industrial activities, public services utilities and infrastructures. Furthermore, the catalogues are not referred to a specific geohazard but can be related to urban planning uses and are sometimes derived from cadastral inventories (Montoya and Masser Citation2005). The data used in this work were provided by the Cartographic Service of the Canary Islands and derived from the digitalization of recently updated cadastral inventories.
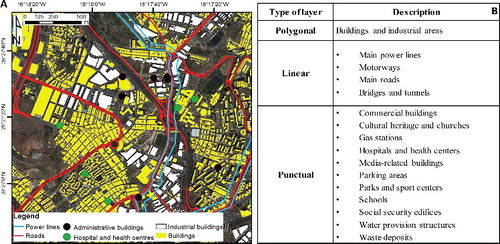
As shown in , the elements at risk catalogue contain layers in three different formats: polygonal, linear and punctual. The polygonal layers, containing information about private buildings and industrial areas, were derived from topographic bases at 1:5000 nominal scale. These layers are referred to different years, depending on the island: 2012 for Gran Canaria 2014 for Tenerife and 2015 for La Gomera. The information about the distribution of the main power line tracks is only available in the Tenerife Island. The road network information contains the motorway tracks along the coastal areas and the main roads that connect the coast to the inland.
Figure 3. (A) example of elements at risk catalogue in the Tenerife Island (Santa Cruz de Tenerife municipality). (B) Available layers constituting the elements at risk catalogue for the test site.
Intermediate outputs of the methodology
The methodology to derive the VEAM is based on three intermediate outputs derived from the PSI product and from the elements at risk catalogues:
| (1) | ADA map that represent critical areas characterized by active movements, extracted from the deformation activity map (see the ‘Deformation activity map’ section) using statistical tools; | ||||
| (2) | Geohazard Activity Maps that represent the integration of the PSI-derived ADA with the pre-existent geohazard inventories; | ||||
| (3) | Classified Elements at Risk Maps that is the final product of the classification of the elements at risk with a triple system of tables based on Civil Protection phases. | ||||
Active deformation areas
The ADA generation procedure is an adapted version of the methodology proposed by Bianchini et al. (Citation2013), Herrera et al. (Citation2013) and Notti et al. (Citation2014). The input PSI dataset, composed of hundreds of thousand/millions of points, are analysed by means of statistical tools to define those areas affected by an active deformation of a certain magnitude, above a specific threshold, that constitute a potential geohazard.
The definition of the ADA starts from the selection of those Persistent Scatterers considered ‘active’, on the basis of a standard deviation threshold applied to the value of velocity along the LOS of the sensor of every measurement point. The next step consists in aggregating the active deformation points in clusters that contain five or more Persistent Scatterers. This number is considered the minimum number of points for the detection of a small landslide (Herrera et al. Citation2013; Oliveira et al. Citation2015). For every Persistent Scatterer, an area of influence is defined on the basis of the size of the ground resolution cell of the multi-looked SAR images analysed (28 × 40 m). This parameter is used to facilitate the clustering process. Barra et al. (Citation2017b) contains a description in detail of the methodology.
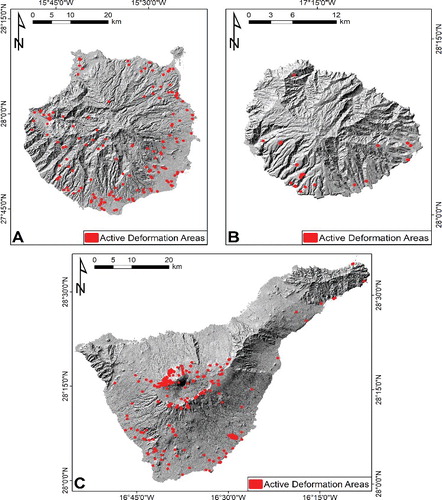
Applying this methodology to the three islands (), we obtain a total number of 388 ADA, 218 in the Tenerife Island (56% of the total), 150 in the Gran Canaria Island (38% of the total) and 20 in La Gomera Island (6% of the total).
Figure 4. Active deformation areas derived from the analysis of the Sentinel-1 dataset. (A) Gran Canaria island, (B) La Gomera island and (C) Tenerife island.
Geohazard activity maps
The Geohazard Activity Map constitutes an improvement of the level of information obtainable from a single ADA (localization and magnitude of an active movement) adding a qualitative estimation of the possible geohazard that is threatening a certain area.
The methodology to derive the Geohazard Activity Maps can be summarized as an intersection between the ADA maps and the available and pre-existent geohazard catalogues. In the case of the Canary Islands, specific databases of slow-moving landslides, that are the target of an InSAR analysis, are not available; whereas, for the volcanic hazard in the Tenerife Island, which is hosting a quiescent volcanic system, a susceptibility map of the possible openings of new volcanic vents is available. Moreover, different types of input and field data are available for the three islands, confirming the difficulties in finding similar and reliable ancillary data above large areas and when different entities are involved. For this last reason, we chose to distinguish between Tenerife and the other two islands (Gran Canaria and La Gomera). In fact, the first has a database of geomorphological landforms derived by the authors in the framework of the SAFETY project that could not be now reproduced for the other two islands. In addition, Tenerife is the only island that records the presence of a quiescent volcanic system that requires a specific Geohazard Activity Map.
Considering these limitations, for the island of Tenerife two Geohazard Activity Maps are derived:
| (1) | Volcanic Susceptibility Areas with Deformation (). This map represents the overlapping between the ADA and the volcanic susceptibility contours that define the highest spatial probability of hosting a volcanic vent, as defined by Martí and Felpeto (Citation2010). This Geohazard Activity Map allows selecting those ADA that could be possibly related to a volcanic motion and to observe the vector of deformation, intended as positive or negative sign of the ADA mean velocity. This map represents a preliminary information for Civil Protection Authorities for knowing a-priori the presence of active movements in areas in which a potential volcanic activity can develop (i.e. defined by the susceptibility contours). The presence of an existing correlation between the ground motions detected by this Geohazard Activity Map and the volcanic activity is not within the aims of this paper, requiring specific site information now not available. | ||||
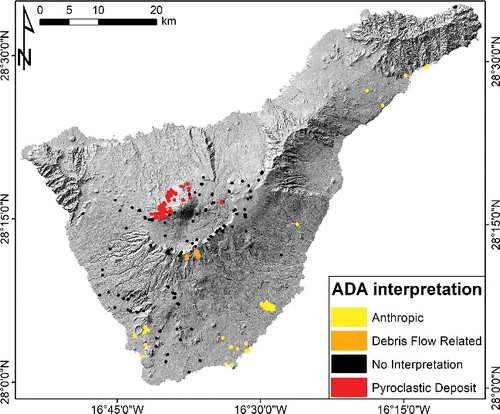
| (2) | Tenerife Geohazard Activity Map (). This map represents a first attempt of generating a catalogue of the potential slope instabilities and terrain settlement in the island, based on geological and geomorphological interpretation. The map is derived according to field observations, analysis of digital orthophotos (referred to years 2012 and 2015) and the available geological map (Carracedo et al. Citation2001) at a 1:25.000 scale. The final output is a geomorphological database in which pyroclastic deposit, debris flow and anthropic activity areas are mapped. In this sense, the Tenerife Geohazard Activity Map is derived by a geological interpretation that has been made combining the inputs data and field work. Hence, the ADA composing this map have been classified in four groups: (i) pyroclastic deposits in slopes greater than 20° where slope instabilities are responsible for the ADA; (ii) ADA related to already mapped debris flows; (iii) ADA related to anthropogenic causes (artificial fill and urban waste dumps compaction, quarries and mining activity); iv) ADA of unknown interpretation because of the lack of terrain or ancillary information. | ||||
Figure 5. Volcanic susceptibility areas with deformation map for the Tenerife island.
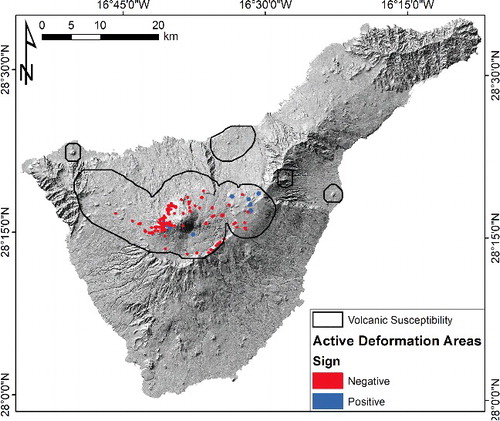
Figure 6. Geohazard Activity Map for the Tenerife Island derived from geological-geomorphological interpretation of field and ancillary data.
Comparing the two Geohazard Activity Maps derived for Tenerife, it is noticeable that some ADAs (mainly around the northern flank of the Teide volcano) are potentially related to multiple geohazards (volcanic motion and slope instability). At this stage, both the classifications are kept, but a field validation and a comparison with other data is necessary for a correct interpretation that will be performed in the future.
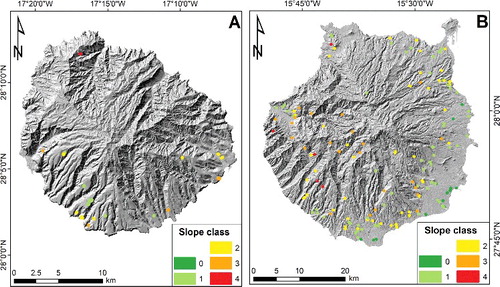
For the islands of Gran Canaria and La Gomera it is possible to derive only a simplified version of the Geohazard Activity Map, based on a 5-m DEM-derived slope map. This map is named Landslide Prone Active Areas and represents a qualitative classification of the terrain to define the possibility or not of a landslide movement (). Every ADA is assigned to a class value, ranging from 0 to 4, indicating how much a registered movement can be related to a landslide. The value 0 is assigned to those ADA with mean slope value lower than 5°, the value 1 (low degree landslide-prone area) is assigned to those ADA with slope angle ranging from 5° to 15°, value 2 (medium degree landslide-prone area) if the slope angle ranges from 15° to 25°, slope angles equal to 25° to 35° are assigned to the value of 3 (high degree landslide-prone area) while the value 4 is referred to the slope angles higher than 35° (very high degree landslide-prone area).
Figure 7. Landslide Prone Active Areas map for the Islands of La Gomera (A) and Gran Canaria (B).
Classified elements at risk maps
The vulnerability of a structure is defined as the ‘expected degree of loss experienced by the elements at risk for a given magnitude of hazard’ (Glade et al. Citation2005). Following this definition, we consider the ‘degree of loss’ of buildings and roads as a loss in serviceability, potentially arriving to the service limit state of an infrastructure. Moreover, the ‘given magnitude of hazard’ is represented by the mean LOS velocity of the PSs within the perimeter of each ADA. Many qualitative and quantitative classification systems for deriving the vulnerability of an element at risk have been proposed by different authors. Fell et al. (Citation2005) stated that, for a correct risk analysis, the elements at risk, structures or persons, should be quantified in terms of ‘vulnerability either as conditional probability of damage to property, or conditional probability of loss of life or injury’. Kong (Citation2002) subdivided the elements at risk into a system of four classes: general buildings, transportation infrastructures, population patterns and essential facilities. A similar generic classification has been used also by Calcaterra et al. (Citation2003), classifying the elements on the basis of the main land use (urban, industrial, infrastructures and agricultural). Papathoma-Köhle et al. (Citation2007) proposed an ‘elements at risk database’ that considered the characteristics of buildings and inhabitants, the use of the buildings and their importance in the local economy. This type of detailed structural analysis of buildings has been also proposed by Spence et al. (Citation2004) in the case of the Vesuvius pyroclastic flows. Conversely, Uzielli et al. (Citation2008) classified the elements at risk with a system of ‘susceptibility factors’ for buildings and people.
These bibliographic examples show that a unique way to manage the elements at risk catalogue does not exist. Moreover, the result is dependent on the quality and scale of detail of the input inventories. In this paper the available catalogues, provided by regional and local entities, contain only simple information about the location and the type of the structures: neither the structural state of the infrastructures nor the information about the occupancy of buildings were available.
In this framework, we propose a qualitative classification system based on the Strategic Vulnerability that considers the potential damages of a certain structure that is already used and that plays a crucial role in the risk management chain of an area or of a municipality. This value is defined for three scenarios, referred to the three Civil Protection phases ():
| (1) | First scenario – Prevention Phase. As defined by the European Union (Decision No 1313/2013/EU of the European Parliament), prevention means ‘any action aimed at reducing risks or mitigating adverse consequences of a disaster for people, the environment and property, including cultural heritage’. In particular, the proposed PSI-based methodology provides to this phase tools to reduce the potential risks by forecasting and mapping potential geohazards. For this scenario, we define three classes of Strategic Vulnerability:
| ||||||||||||||||||||||||||||
| (2) | Second scenario – Emergency Phase. The response to a certain geo-hydrogeological event is defined by the United Nations Office for Disaster Risk Reduction as ‘the provision of emergency services and public assistance during or immediately after a disaster in order to save lives, reduce health impacts, ensure public safety and meet the basic subsistence needs of the people affected’. In this phase, PSI-derived data are used to monitor the post-event residual deformations threatening the population and affecting the most strategic infrastructures used within the emergency chain as well as to map secondary geohazards induced by the main hydrogeological event. For this scenario, we define four classes of Strategic Vulnerability:
| ||||||||||||||||||||||||||||
| (3) | Third scenario – Recovery Phase. The recovery after a hydrogeological or volcanic event is defined by the United Nations Office for Disaster Risk Reduction as ‘the restoration of facilities, livelihoods and living conditions of disaster-affected communities including efforts to reduce disaster risk factors’. InSAR data are used in the Recovery Phase to evaluate the possible reactivation of already set off phenomena or the presence of precursors of new movements affecting the areas involved in the reconstruction. For this scenario, we define three classes of Strategic Vulnerability:
| ||||||||||||||||||||||||||||
Table 1. Strategic vulnerability values for the three different Civil Protection phases and for each type of element at risk considered.
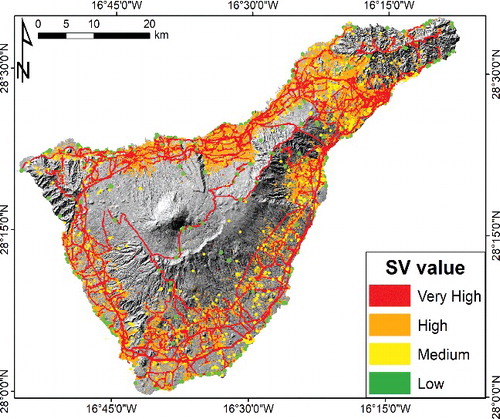
A simple procedure, managed in a GIS system, is applied for generating the final vulnerable elements map for the test sites. Firstly, every group of elements at risk (as shown in ) is associated to a value of Strategic Vulnerability depending on the chosen scenario. Then, each classified group is rasterized on the basis of its Strategic Vulnerability value. Finally, the different obtained raster layers are merged to obtain the final Reclassified Elements at Risk map. Regarding the strategy of analysis of the different formats of the input data we chose two different ways for the point and polygonal features. For what concern the point features, the raster cell size was fixed at 100 m in order to ensure an area of influence around the buildings and the structures and thus to guarantee the association with the neighbourhood ADA. For the polygonal feature, a buffer of 50 m is applied to the original shapefile and then a raster conversion, at 100m cell resolution, is performed. At each pixel of the Classified Elements at Risk Map is associated the Strategic Vulnerability class related to each Civil Protection phase (). When a single pixel represents different strategic elements at risk, with different Strategic Vulnerability values, only the highest Strategic Vulnerability class is assigned.
Figure 8. Classified Elements at Risk map for the Island of Tenerife. The Strategic Vulnerability value is referred to the Emergency Phase scenario.
Final output of the methodology
The information derived from the three intermediate products is finally merged to obtain the VEAM: each ADA is associated both to the Geohazard Activity Maps information, related to the potential geohazards (landslide, settlement or volcanic), and the Strategic Vulnerability class of the intersecting element at risk. The VEAM includes only the ADA that potentially affect one or more elements a risk, discarding the remaining ADA that do not coincide with elements found within the reclassified elements at risk catalogue, because they represent movements that are not affecting any infrastructure.
Three maps, produced for every scenario previously defined, constitute the final outputs of the methodology. These outputs contain not only the information related to the ADA but also to the territorial units in which the Islands can be subdivided. For the application of the proposed methodology, we chose to use the municipalities of the three islands as territorial units (21 for Gran Canaria, 6 for La Gomera and 31 for Tenerife). The final maps are composed as follows:
| (1) | Classified territorial units: polygons representing the chosen territory division. In this work the polygons represent the municipality boundaries (an example will be illustrated in the ‘Results’ Section). They are classified by the number of the VEAM-selected ADA. A colour scale is used for representing the classification. If no ADA are found the polygon are left blank; | ||||
| (2) | Pie charts: the pie charts represent the distribution of the VEAM-selected ADA in terms of their Strategic Vulnerability classification. The Strategic Vulnerability classes are symbolized by a colour scale, depending on the Civil Protection phase, as presented in . Each VEAM includes a pie chart for each territorial unit and a general pie chart representing the total distribution. The last one includes also the percentages of the VEAM-selected ADA for each Strategic Vulnerability class (see the ‘Results’ Section for an example of VEAM for the Emergency Phase). | ||||
A second output of the methodology is composed by a GIS database for each VEAM-selected ADA characterized by the following information:
| ▪ | Information over the geographical localization of the ADA (coordinates in a reference cartographic system, municipality and nearest road name or local toponym); | ||||
| ▪ | Brief geological information extracted from the available cartographic or bibliographic sources; | ||||
| ▪ | Mean LOS velocity, in terms of absolute value, of the Persistent Scatterers within each ADA; | ||||
| ▪ | Quality index that indicates the reliability of each ADA. It is based on the temporal and spatial noise level of the deformation time series of each Persistent Scatterer composing the ADA. For an in-depth explanation of the methodology used to derive the Quality Index we refer to Barra et al. (Citation2017b); | ||||
| ▪ | The higher Strategic Vulnerability class of the elements at risk included in the ADA, for each Civil Protection scenario; | ||||
| ▪ | Only for the Tenerife Island, a field indicating if the ADA can be associated or not with a volcanic-related deformation and to slope movement or ground settlement (see the Geohazard Activity Maps section); | ||||
| ▪ | For the Gran Canaria and La Gomera Islands, a field indicating if the ADA can be associated to a potential landslide-related motion (see the Geohazard Activity Maps section). | ||||
The two outputs of the methodology will be used to define those areas that represent a major threat for the Islands governments and so for the population. This is done throughout a selection process performed on the VEAM database that aims at choosing and at creating a ‘priority list’ of the most hazardous ADA. Field checks are finally required to verify these satellite-derived information, identifying ground evidences of active movements or possible future failures. At the moment, a campaign of field checks is being planned in accordance with the Civil Protection authority of the Canary Islands. The VEAM outputs will be also cross compared with available or newly acquired geophysical data, such as Global Positioning System or seismic and geoelectrical surveys.
Test site characterization
The Canary Islands Archipelago is located westward from the African coast and developed as a result of the eastward movement of the African plate over a mantle hotspot (Holik et al. Citation1991). In this geodynamical context, the western islands are the oldest in the archipelago (Acosta et al. Citation2003). Starting from the biggest one, Tenerife, a brief geological description of each island is now introduced.
Tenerife Island geological and geomorphological characterization
Tenerife is the biggest (2.057 km2) and most populated (889000 inhabitants) island in the Canary Archipelago. Its highest point, Mount Teide, with an elevation of 3.718 m a.s.l., is the third largest volcano in the world from its base at the bottom of the sea.
The current morphological complexity of the island is directly related to its volcanic evolution ((A)). The caldera system that is visible today in the centre of the island (Cañadas caldera) was produced by the vertical collapse of this edifice after an intense explosive volcanic activity (Martí et al. Citation1997; Martí and Gudmundsson Citation2000). The area is now partially occupied by the Teide-Pico Viejo strato-volcano and filled by the materials emitted in the different eruptions that took place. The island is also characterized by the presence of three rift zones with scatter vents, aligned cones and eruptive fissures. These structures are: Santiago del Teide (NW-SE rift zone), Dorsal (ENE-WSW rift zone) and the Southern Volcanic Zone (Carracedo Citation1996). The main geohazards are mainly related to the volcanic activity of the island (the Teide-Pico Viejo complex has a permanent and active magmatic chamber), involving also a regional seismicity activity with magnitude lower than 5.0 (Mezcua et al. Citation1992). The Island is characterized also by the presence of six large paleolandslides, whose age ranges from Upper Pliocene to Middle Pleistocene (Hürlimann et al. Citation2004). The largest and most representative phenomena are Güimar, La Orotava and Icod landslides ((A)). These instabilities produced large amphitheatres and their actual presence was confirmed by offshore geophysical data (Watts and Masson Citation2001). Their origin is related to a series of complex and concurrent causes, such as: the rifting activity along the island that produced gravitational sliding (Carracedo Citation1994), the presence of a level of volcanic breccia acting as an impermeable layer that creates a main sliding surface (Ancochea et al. Citation1999) and a direct mechanical relation with the collapse of the Cañadas caldera (Martí et al. Citation1997).
Figure 9. Simplified geological maps (overlaid on a 5 × 5 DEM-derived hillshade relief) and geographical localization of the three islands. (A) Geological map of Tenerife Island (modified after Sobradelo and Martí Citation2010); SRZ, Santiago rift zone; DRZ, dorsal rift zone; SVZ, southern volcanic zone; TPV, Teide-Pico Veijo stratovolcano. The black dashed lines represent the contour of the paleolandslides (modified after Hürlimann et al. Citation2004). AN, Anaga landslide; ED, East Dorsal landslide; GU, Güimar landslide; IC, Icod landslide; OR, La Orotava landslide; TN, Teno landslide. (B) Geological map of Gran Canaria Island (modified after Rodriguez-Gonzalez et al. Citation2009); PLN, Pico de Las Nieves. (C) Geological map of La Gomera Island (modified after Llanes et al. Citation2009). ADG, Alto de Garajonay; VLH, Vallehermoso area. (D) Geographical location of the three islands, the red contours represent the study areas.
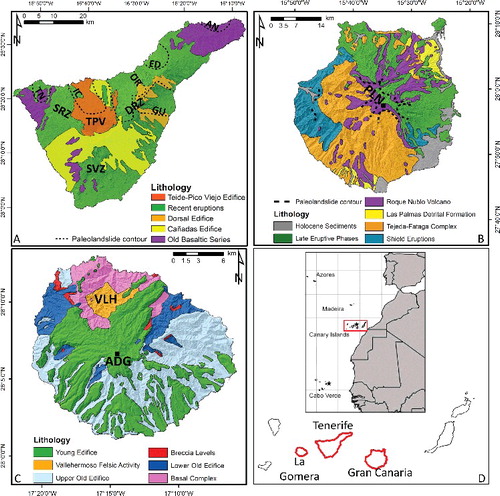
Gran Canaria geological and geomorphological characterization
Gran Canaria is the third island of the archipelago for surface (1532 km2) and its highest point is located at 1950 m a.s.l. in its central part (Pico de Las Nieves, (B)). The island shows a clear climatic distinction between the southern flanks, with arid to semi-arid conditions, and the northern flanks that are characterized by humid to sub-humid climatic conditions. Combining the climatic conditions and the age of volcanism, the island can be subdivided into four sectors: ‘young’ eastern sector with arid (SE) and humid (NE) climates and an ‘old’ western sector with the same internal climatic subdivision (Menendez et al. Citation2008).
As for Tenerife, its current morphology is determined by the emplacement of different volcanic cycles that started about 15 Ma with the formation of a shield volcano that afterward collapsed, forming the Tejeda caldera, subsequently filled by ignimbritic materials (‘Tejeda-Fataga complex’, (B)) that mantled the pre-existent slopes of the shield volcano (Carracedo et al. Citation2002). After this volcanic activity, an intense strong erosional trend took place (Carracedo et al. Citation2002), cutting deep the slopes of the shield volcano and forming the present-day network of ravines, locally known as ‘barrancos’. At present the residual slopes of the shield edifice dominates the southern sector of the island (Menendez et al. Citation2008). During this erosional phase, in the S-SE and N-NW sectors of the island a high volume of alluvial and fan-delta sediments was deposited, forming the ‘Las Palmas Detritic Formation’ (Schmincke Citation1993).
A new intense volcanic phase (Roque Nublo stratovolcano) took place in the central part of the island where lava and pyroclastic flows filled the valleys carved in the northern flank of the shield edifice, generating extensive northward sloping platform-lava surfaces that were subsequently re-incised by the action of new quaternary barrancos (Menendez et al. Citation2008). After the construction of the Roque Nublo stratovolcano several giant landslides, flank collapses and debris avalanches developed (Lomoschitz et al. Citation2008).
La Gomera geological and geomorphological characterization
With 380 km2, La Gomera is the sixth island for surface of the Archipelago; the Alto the Garajonay is its highest point, located at 1487 m a.s.l. ((C)).
The geological context reflects the three main growth stages of this volcanic island (Ancochea et al. Citation2004 Citation2006): the Basal Complex, the Old Edifice and the Young Edifice ((C)). In particular, the Basal Complex, which outcrops in the northern part of the island, is composed by mafic plutonic rocks (Cendrero Citation1971). After the erosion of this mafic complex, a new volcanic system, centred in the Vallehermoso area, took place. It is represented by the Old Edifice shield volcano, characterized by hundreds of meters of basaltic lava flows with felsic lavas on top of the sequence (‘Vallehermoso Felsic Rocks’, Ancochea et al. Citation2006). The most recent volcanic activity of the island is related to the basaltic, trachybasaltic, and trachyandesitic lava flows emitted during the activity of the Young Edifice, that do not cover the entire island, as the previous ones, but are limited to the central and south-eastern portion of the island (Llanes et al. Citation2009). After these latest events, the island is considered inactive and is only affected by intense fluvial and marine erosive phenomena (Llanes et al. Citation2009). This erosional stage is similar to the one recognized in the Gran Canaria Island (Paris et al. Citation2005).
Results
Applying the VEAM methodology to the test site areas we detect 108 ADA (28% of the total) that affect one or more elements at risk, involving 25 municipalities in total.
In the Gran Canaria Island, 65 VEAM-selected ADA are found, representing the 43% of the ADA of the island and covering 0.7 km2 ((A)). At least one of these potential hazard areas is detected in 13 municipalities, two of them register the presence of a number of ADA higher than 10 ((A)): Las Palmas de Gran Canaria and San Bartolomé de Tiranjana (16 and 15 ADA, respectively). The highest density of VEAM-selected ADA is found in the south-eastern part of the island, where the urban density is the highest, and in the Las Palmas de Gran Canaria municipality, that represent the most populated area of the island. The 90% of the VEAM-selected ADA in the Prevention phase scenario registered a High vulnerability value, being private houses, main roads and hotels. In the Emergency phase, the 38% of the ADA intersect elements at risk with ‘Very High’ vulnerability, mainly represented by roads, while, the 58% of the deformation detected affect private houses and touristic structures classified as ‘High’ Strategic Vulnerability value ((A)). In the Recovery phase, the greatest part (64% of the total) of the VEAM-selected ADA outline element at risk with ‘Medium’ vulnerability (private houses mainly).
Figure 10. VEAM-selected ADA for the three islands of the Canary Archipelago. The VEAM classification here presented is referred to the Emergency Phase scenario. (A) Gran Canaria island, (B) La Gomera island and (C) Tenerife island.
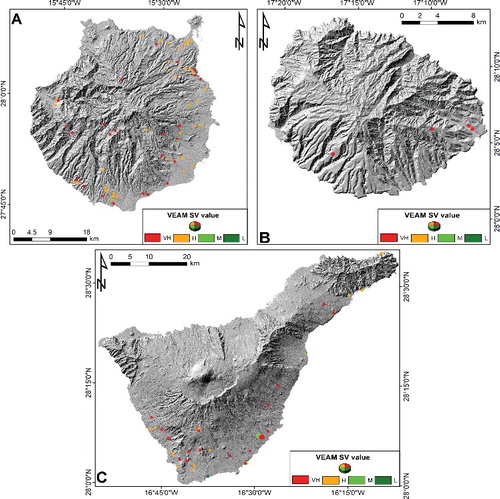
Figure 11. VEAM final output for the three islands test sites of the methodology. The VEAM here presented is referred to the second scenario – emergency phase. The islands are subdivided in municipalities considered as reference territorial units. (A) Gran Canaria island, (B) La Gomera island and (C) Tenerife island. All the maps are overlaid on a 5 × 5 DEM-derived hillshade. The black dots in (A) and (C) indicate two case studies explained in .
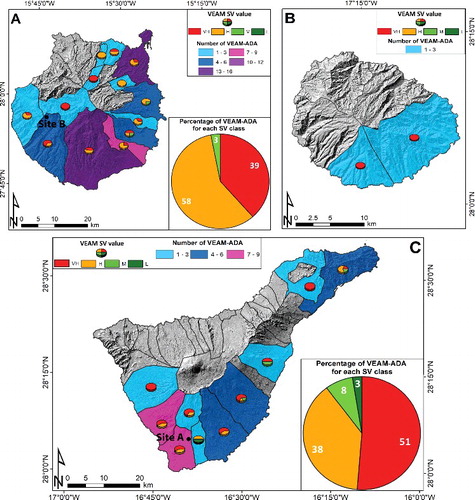
In La Gomera Island, 4 VEAM-selected ADA are registered (25% of the ADA), covering only 0.05 km2 ((B)). The municipalities of San Sebastián de La Gomera (3 areas with active deformation) and Alajeró (1 area with active deformation) are the only two administrative entities involved ((B)). The obtained results are highly dependent on the low density of measurement points and so of the resulting ADA, related to the vegetation cover of the central portion of the island, in addition to the absence of wide urban areas and of a dense road network. The definition of the vulnerability of the elements at risk affected by an active deformation give the same result for both the Prevention and Emergency phase, classifying all the ADA in the highest class of vulnerability (High and Very High for Prevention and Emergency scenarios, respectively). In the third scenario (Recovery phase) the 50% of the ADA are classified as ‘High’ vulnerability and 50% as ‘Medium’ vulnerability, the latter representing single or groups of private houses ().
Table 2. Summary of the results obtained in the Canary Islands. For each scenario are shown the number of ADA for each of the vulnerability class.
Finally, 39 VEAM-selected ADA are recorded in the Tenerife Island, representing the 18% of the Island ADA and covering a territory equal to 0.2 km2 ((C)). Ten municipalities are affected by active movements involving elements at risk; the maximum number of ADA, equal to 7, is registered in both the Adeje and Arona municipalities in the southern part of the island where the highest density of ADA was found ((C)). The Island of Tenerife shows the lowest percentage of VEAM-selected ADA in respect to the original number of ADA; this is due to the high density of areas falling into the Cañadas Caldera and around the steep slopes of the Teide and Pico Viejo volcanoes. In this area, that constitutes a national park and an UNESCO heritage, the road network is reduced to the strictly necessary and only few touristic edifices are found; this lead to a lower probability of intersection of the element at risk catalogue with the ADA map, resulting in the absence of these areas in the final VEAM output. For the Prevention phase scenario, the VEAM analysis applied to the Tenerife Island give as a result the 80% of the ADA affecting elements at risk with ‘High’ vulnerability, being road network and power line sectors and private houses. The 54% of the ADA in the Emergency phase scenario affect elements at risk with ‘Very High’ strategic vulnerability (road network and power line sectors), while 36% affect elements with ‘High’ vulnerability, essentially private houses. For the Recovery phase scenario, these percentages are similarly subdivided between the ‘High’ and ‘Medium’ vulnerability classes.
In two case studies are shown to better explain the type of result obtainable throughout the application of the VEAM methodology. The first example shows an ADA composed by seven measurement points with a mean velocity value equal to −6.5 mm/yr, negative sign coherent with a movement away from the sensor along the slope direction (SD – (A)). From the point of view of the potential geohazard causing the registered deformation, since the ADA do not fall within the Volcanic Susceptibility Areas with Deformation contours and the mean slope angle value is 20.5°, it could be classified as a landslide-prone area. The ADA registers a ‘Very High’ strategic vulnerability, value obtained choosing the Emergency phase scenario classification; in particular, the element that shows the maximum vulnerability in this scenario is the TF-28 road, placed at the edge of the slope affected by the deformation. This road constitutes the main road connection between the cities of Valle de San Lorenzo and San Miguel that is located 5 km eastward. InSAR data suggest a possible movement of a sector of the slope, that could not only impact the road, with a retrogressive movement, but also the private houses located at the bottom of the slope.
Figure 12. Selected case studies within the VEAM database for the Emergency phase scenario. (A) VEAM-selected ADA near Valle de San Lorenzo, southern part of the Tenerife Island. (B) VEAM-selected ADA along the GC-200 road near the Tasarte town in the south-eastern sector of the Gran Canaria Island. The black arrows indicate the slope direction (SD).
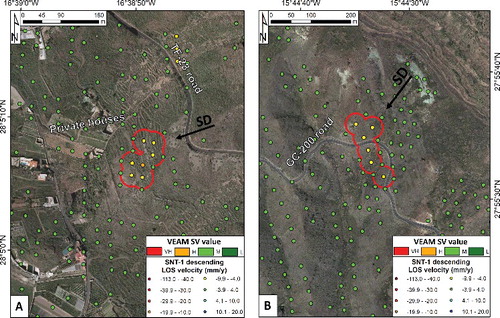
The second example exhibits a six measurement points ADA with mean velocity of −6.0 mm/yr affecting the GC-200 road in the sector that connects Tasarte with Mogan ((B)). This coastal road is considered as one of the most hazardous roads in Spain regarding rockfalls (Sarro et al. Citation2017) and is a critical connection for the town and villages of the western part of the Gran Canaria Island with the biggest centres of the north (i.e. Las Palmas de Gran Canaria); moreover, this road is heavily used by local, commercial and touristic traffic because it is more direct and larger than the mountainous roads of the centre of the island (Longpré et al. Citation2008 ). The ADA accounts for a mean slope angle of 28° classified and it could be also classified as a landslide prone area. Considering the Emergency phase scenario, the GC-200 road is classified as a ‘Very high’ vulnerable element at risk, representing a main transport route for the island. As shown by InSAR data, this situation requires certain attention because a possible landslide movement affecting this section of the road track could lead to its partial or complete interruption, causing social and economic repercussions for the population of the island. However, due to the low magnitude and reduce extent of both ADA, no direct action seems to be necessary (e.g. field work). Nevertheless, this ADA should be targeted in future monitoring upgrades performed with new Sentinel-1 acquisitions. In the case that the ADA magnitude and extension is increased fieldwork should be necessary to map the threatening landslide as well as the implementation of in situ monitoring techniques.
Discussion
The proposed methodology permitted to detect 108 areas of ‘potential risk’ in the three islands selected as test site for the procedure. The most powerful VEAM feature is its discriminatory ability to derive, in a reasonable time, those areas that recorded active deformation affecting one or more elements at risk starting from a very high number of input measurements (more than 1 million in this case). This is done by using a reproducible workflow that allows to drastically reduce the time needed for analysing a whole interferometric dataset on large areas (around 4000 km2 for the test sites proposed).
The VEAM indicates in a simple way where and with which intensity a geohazard is affecting a territorial unit (municipality or district, depending on the working scale) and an element at risk, classified on the basis of its Strategic Vulnerability. This is the main feature of the methodology, designed to be a part of the risk management chain of the Civil Protection Authorities and intended as a way to facilitate the definition of the more hazardous areas of a territory starting from large datasets of measurement, thus providing a list of potential active phenomena that are affecting the infrastructures of a region, a municipality or a city. Thanks to this type of results, a campaign of periodical checks and ground surveys can be implemented in the Civil Protection Authorities procedures.
Another important feature is the scalability and versatility of the methodology; in fact, as shown by the test site applications, it is pertinent to completely different environmental contexts at different working scales, from a single municipality to an entire region. For example, in this paper we used as territorial units the municipalities of the island but it is possible to enlarge the scale of analysis, using cities, single district or other type of territorial subsets (i.e. slope units).
The methodology is also suited for a multi-temporal update of the InSAR dataset because of the relatively short time needed for its application. Using satellites with high revisit time such as Sentinel-1 (6 days using both satellites of the constellation) it is possible to update the results with a high temporal frequency, evaluating the presence of new ADA and the evolution of the already detected ones. The idea is to plan a new update of the Deformation Map, and so of the derived products (ADA map, Geohazard Activity Maps, VEAM) every 6 months or less by adding the new InSAR data (i.e. the interferograms) to the already existing interferograms network.
The applicability of the methodology and the expected results are influenced by intrinsic factors and limitations of the input data. From the interferometric point of view, the methodology can be applied using every type of SAR images (C-, X- and L-band sensors) as input of the InSAR analysis. The major limitation in the use of this type of data is the maximum displacement measurable between two acquisitions that is equal to λ/4, where λ is the wavelength of the radar signal, i.e. 1.4 cm for C-band sensors; considering not only the wavelength but also the revisiting time, the maximum deformation rate detectable by Sentinel-1 is 42.6 cm/yr (Crosetto et al. Citation2016). For this reason, phenomena with deformation rates below these thresholds can be successfully detected, such as volcanic deformations, subsidence and ‘slow-moving landslide’ (as defined by Cruden and Varnes Citation1996). Another limitation is the impossibility of finding reliable results in densely vegetated areas, where the coherence of the images falls down not allowing to obtain a network of measurement points suitable for the approach proposed. In addition, the level of information contained in the elements at risk catalogue is another crucial issue that can invalidate the obtainable results; in fact, detailed data about the road network and the type of buildings are at least needed for the main urban agglomerations of the area of interest.
The classification proposed for the elements at risk was designed considering Civil Protection Authorities requirements, but it can be modified depending on specific needs of the final users without compromising the performances of the system.
Conclusions
In this work, we present a methodology, named VEAM, for the generation of impact assessment maps starting from InSAR-derived displacement data. The methodology aims at providing a simple product to the Civil Protection Authorities in which the areas of active deformation, defined on the basis of a velocity threshold and a clustering law, are classified on the basis of the vulnerability of the elements at risk present in these areas. The methodology has been tested in the Canary Islands (in particular Gran Canaria, La Gomera and Tenerife) where Sentinel-1 data and a catalogue of elements at risk were used as input of the proposed approach. The methodology allowed to detect more than 100 areas (involving 25 municipalities) that registered deformation rates above 4 mm/yr affecting one or more elements at risk categorized on the basis of a triple scenario classification system.
The obtained results are conceived to reduce the time needed for the analysis of an entire InSAR dataset (composed by millions of measurements), detecting those areas that represent a critical issue for a territorial unit (municipality) and that can be monitored and validated by ground check surveys. Moreover, this working strategy can be applied in other environments, using also different types of input InSAR data. The final goal is to provide a reproducible work flow that could be used not only by the Canary Islands Civil Protection but by other European Entities, adapting the methodology, in particular the vulnerability classification, to the needs of other entities.
Acknowledgements
This work was carried out in the framework of the European Project ‘SAFETY – Sentinel-1 for geohazard prevention and forecasting’, ECHO/SUB/2015/718679/Prev02-SAFETY. The authors thank Dr. Alicia Felpeto of the Instituto Geográfico Nacional (Madrid, Spain) for providing the volcanic susceptibility map.
Disclosure statement
No potential conflict of interest was reported by the authors.
References
- Abidin HZ, Andreas H, Gumilar I, Sidiq TP, Fukuda Y. 2013. Land subsidence in coastal city of Semarang (Indonesia): characteristics, impacts and causes. Geomat Nat Haz Risk. 4:226–240.
- Acosta J, Uchupi E, Muñoz A, Herranz P, Palomo C, Ballesteros M. 2003. Geologic evolution of the Canarian Islands of Lanzarote, Fuerteventura, Gran Canaria and La Gomera and comparison of landslides at these islands with those at Tenerife, La Palma and El Hierro. Mar Geophys Res. 24:1–40.
- Ancochea E, Huertas MJ, Cantagrel JM, Coello J, Fúster JM, Arnaud N, Ibarrola E. 1999. Evolution of the Cañadas edifice and its implications for the origin of the Cañadas Caldera (Tenerife, Canary Islands). J Volcanol Geotherm Res. 88:177–199.
- Ancochea E, Brändle JL, Cubas CR, Hernán F, Herrera R, Huertas MJ. 2004. La Gomera. In: Vera JA, editor. Geología de España [Geology of Spain]. Madrid: InSGE-IGME; p. 658–660. Spanish.
- Ancochea E, Hernán F, Huertas MJ, Brändle JL, Herrera R. (2006.) A new chronostratigraphical and evolutionary model for La Gomera: implications for the overall evolution of the Canarian Archipelago. J Volcanol Geother Res. 157:271–293.
- Barra A, Monserrat O, Mazzanti P, Esposito C, Crosetto M, Scarascia Mugnozza G. 2016. First insights on the potential of Sentinel-1 for landslides detection. Geomat Nat Haz Risk. 7:1–10.
- Barra A, Solari L, Béjar-Pizarro M, Monserrat O, Herrera G, Bianchini S, Crosetto M, Mateos RM, Sarro R, Moretti S. 2017a. Sentinel-1 data exploitation for geohazard activity map generation. Proceedings of the 19th EGU General Assembly; Apr 23–28; Vienna, Austria.
- Barra A, Solari L, Béjar-Pizarro M, Monserrat O, Bianchini S, Herrera G, Crosetto M, Sarro R, González-Alonso E, Mateos RM, et al. 2017b. A Methodology to Detect and Update Active Deformation Areas Based on Sentinel-1 SAR Images. Remote Sens. 9:1002.
- Béjar-Pizarro M, Ezquerro P, Herrera G, Tomás R, Guardiola-Albert C, Hernández JMR, Fernandez Merodo JA, Marchamalo M, Martínez R. 2017. Mapping groundwater level and aquifer storage variations from InSAR measurements in the Madrid aquifer, Central Spain. J Hydrol. 547:678–689.
- Bianchini S, Herrera G, Mateos RM, Notti D, Garcia I, Mora O, Moretti S. 2013. Landslide activity maps generation by means of Persistent Scatterer Interferometry. Remote Sens. 5:6198–6222.
- Bianchini S, Raspini F, Ciampalini A, Lagomarsino D, Bianchi M, Bellotti F, Casagli N. 2016. Mapping landslide phenomena in landlocked developing countries by means of satellite remote sensing data: the case of Dilijan (Armenia) area. Geomat Nat Haz Risk. 1–17.
- Bonforte A, Guglielmino F, Coltelli M, Ferretti A, Puglisi G. 2011. Structural assessment of Mount Etna volcano from permanent scatterers analysis. Geochem Geophy Geosy. 12:1–19.
- Calcaterra D, de Riso R, Santo A. 2003. Landslide hazard and risk mapping: experiences from Campania, Italy. In: Picarelli L, editor. Fast slope movements, prediction and prevention for risk mitigation. Bologna: Patron Editore; p. 63–70.
- Calvello M, Peduto D, Arena L. 2016. Combined use of statistical and DInSAR data analyses to define the state of activity of slow-moving landslides. Landslides. 14:473–489.
- Carracedo JC. 1994. The Canary Island: an example of structural control on the growth of large oceanic-island volcanoes. J Volcanol Geotherm Res. 60:225–241.
- Carracedo JC. 1996. Morphological and structural evolution of the western Canary Islands: hotspot-induced three-armed rifts or regional tectonic trends? J Volcanol Geotherm Res. 72:151–162.
- Carracedo JC, de la Nuez J, Pérez Torrado FJ, Rodriguez Badiola E, Guillou H. 2001. Geological map of the Teide-Pico Viejo volcanoes and the northwest and northeast rifts of Tenerife. Digital. CSIC database. [ accessed 2017 Jul 25]. http://hdl.handle.net/10261/4431
- Carracedo JC, Pérez-Torrado FJ, Ancochea E, Meco J, Hernán F, Cubas CR, Casillas R, Rodríguez-Badiola E, Ahijado A. 2002. Cenozoic volcanism II, The Canary Islands. In: Gibsson W, Moreno T, editors. The geology of Spain. London: The Geological Society; p. 439–472.
- Cendrero, A. 1971. Estudio geológico y petrológico del complejo basal de la isla de La Gomera (Canarias) [Geological study of the basal complex in the La Gomera Island (Canaries)]. Estud Geol. 27:3–73. Spanish.
- Ciampalini A, Raspini F, Lagomarsino D, Catani F, Casagli N. 2016. Landslide susceptibility map refinement using PSInSAR data. Remote Sens Environ. 184:302–315.
- Crosetto M, Monserrat O, Cuevas-González M, Devanthéry N, Crippa B. 2016. Persistent scatterer interferometry: a review. ISPRS J Photogramm Remote Sens. 115:78–89.
- Cruden DM, Varnes DJ. 1996. Landslide types and processes. In: Turner AK, Schuster RL. Landslides: investigation and Mitigation, Transportation research board special report (247). Washington (DC): National Academy Press; p. 36–75
- Devanthéry M, Crosetto O, Monserrat M, Cuevas-González M, Crippa B. 2014. An approach to persistent scatterer interferometry. Remote Sens. 6:6662–6679.
- Dai FC, Lee CF, Ngai YY. 2002. Landslide risk assessment and management: an overview. Eng Geol. 64:65–87.
- Farr TG, Rosen PA, Caro E, Crippen R, Duren R, Hensley S, et al. 2007. The shuttle radar topography mission. Rev Geophys. 45:1–33.
- Fell R, Ho KK, Lacasse S, Leroi E. 2005. A framework for landslide risk assessment and management. In: Hungr O, Fell P, Couture R, Eberhardt E, editors. Landslide risk management. London: Taylor & Francis Group; p. 3–25.
- Fell R, Corominas J, Bonnard C, Cascini L, Leroi E, Savage WZ. 2008. Guidelines for landslide susceptibility, hazard and risk zoning for land-use planning. Eng Geol. 102:99–111.
- Glade T, Anderson M, Crozier M. 2005. Landslide hazard and risk. Chichester: John Wiley & Sons Publisher Ltd.
- Hanssen R. (2001.) Radar interferometry. Dordrecht: Kluwer Academic Publishers.
- Herrera G, Gutiérrez F, García-Davalillo JC, Guerrero J, Notti D, Galve JP, Fernandez-Merodo JA, Cooksley G. 2013. Multi-sensor advanced DInSAR monitoring of very slow landslides: the Tena Valley case study (Central Spanish Pyrenees). Remote Sens Environ. 128:31–43.
- Hölbling D, Füreder P, Antolini F, Cigna F, Casagli N, Lang S. 2012. A semi-automated object-based approach for landslide detection validated by persistent scatterer interferometry measures and landslide inventories. Remote Sens. 4:1310–1336.
- Holik JS, Rabinowitz PD, Austin JA. 1991. Effects of Canary hotspot volcanism on structure of oceanic-crust off Morocco. J Geophys Res Solid Earth Planets. 96:12039–12067.
- Hürlimann M, Martı́ J, Ledesma A. 2004. Morphological and geological aspects related to large slope failures on oceanic islands: the huge La Orotava landslides on Tenerife, Canary Islands. Geomorphology. 62:143–158.
- Kim JW, Lu Z, Qu F, Hu X. 2015. Pre-2014 mudslides at Oso revealed by InSAR and multi-source DEM analysis. Geomat Nat Haz Risk. 6:184–194.
- Kong WK. 2002. Risk assessment of slopes. Q J Eng Geol. 35:213–222.
- Lagios E, Papadimitriou P, Novali F, Sakkas V, Fumagalli A, Vlachou K, Del Conte S. 2012. Combined seismicity pattern analysis, DGPS and PSInSAR studies in the broader area of Cephalonia (Greece). Tectonophysics. 524:43–58.
- Lagios E, Sakkas V, Novali F, Bellotti F, Ferretti A, Vlachou K, Dietrich V. 2013. SqueeSAR™ and GPS ground deformation monitoring of Santorini Volcano (1992–2012): tectonic implications. Tectonophysics. 594:38–59.
- Lee WJ, Lu Z, Jung HS, Ji L. 2017. Measurement of small co-seismic deformation field from multi-temporal SAR interferometry: application to the 19 September 2004 Huntoon Valley earthquake. Geomat Nat Haz Risk. 1–17.
- Llanes P, Herrera R, Gómez M, Muñoz A, Acosta J, Uchupi E, Smith D. 2009. Geological evolution of the volcanic island La Gomera, Canary Islands, from analysis of its geomorphology. Mar Geol. 264:123–139.
- Lomoschitz A, Hervas J, Yepes J, Meco J. 2008. Characterisation of a Pleistocene debris-avalanche deposit in the Tenteniguada Basin, Gran Canaria Island, Spain Landslides. 5:227–234.
- Longpré MA, del Potro R, Troll VR, Nicoll GR. 2008. Engineering geology and future stability of the El Risco landslide, NW-Gran Canaria, Spain. Bull Eng Geol Environ. 67:165.
- Martí J, Hurlimann M, Ablay GJ, Gudmundsson A. 1997. Vertical and lateral collapses in Tenerife and other ocean volcanic islands. Geology. 25:879–882.
- Martí J, Gudmundsson A. 2000. The Las Cañadas caldera (Tenerife, Canary Islands): an overlapping collapse caldera generated by magma-chamber migration. J Volcanol Geotherm Res. 103:161–174.
- Martí J, Felpeto A. 2010. Methodology for the computation of the volcanic susceptibility. Example for mafic and felsic eruptions on Tenerife (Canary Islands). J Volcanol Geotherm Res. 195:69–77.
- Massironi M, Zampieri D, Bianchi M, Schiavo A, Franceschini A. 2009. Use of PSInSAR™ data to infer active tectonics: Clues on the differential uplift across the Giudicarie belt (Central-Eastern Alps, Italy). Tectonophysics. 476:297–303.
- Massonnet D, Feigl KL. 1998. Radar interferometry and its application to changes in the Earth's surface. Rev Geophys. 36:441–500.
- Menendez I, Silva PG, Martin-Betancor M, Perez-Torrado FJ, Guillou H, Scaillet S. 2008. Fluvial dissection, isostatic uplift, and geomorphological evolution of volcanic islands (Gran Canaria, Canary Islands, Spain). Geomorphology. 102:189–203.
- Mezcua J, Buforn E, Udías A, Rueda J. 1992. Seismotectonics of the Canary Islands. Tectonophysics. 208:447–452.
- Montoya L, Masser I. 2005. Management of natural hazard risk in Cartago, Costa Rica. Habitat Int. 29:493–509.
- Notti D, Davalillo JC, Herrera G, Mora O. 2010. Assessment of the performance of X-band satellite radar data for landslide mapping and monitoring: Upper Tena Valley case study. Nat Hazards Earth Sys. 10:1865.
- Notti D, Herrera G, Bianchini S, Meisina C, García-Davalillo JC, Zucca F. 2014. A methodology for improving landslide PSI data analysis. Int J Remote Sens. 35:2186–2214.
- Oliveira SC, Zêzere JL, Catalão J, Nico G. 2015. The contribution of PSInSAR interferometry to landslide hazard in weak rock-dominated areas. Landslides. 12:703–719.
- Papathoma-Köhle M, Neuhäuser B, Ratzinger K, Wenzel H, Dominey-Howes D. 2007. Elements at risk as a framework for assessing the vulnerability of communities to landslides. Nat Hazards Earth Sys. 7:765–779.
- Paris R, Guillou H, Carracedo JC, Pérez-Torrado FJ. 2005. Volcanic and morphological evolution of La Gomera (Canary Islands), based on new K–Ar ages and magnetic stratigraphy: implications for oceanic island evolution. J Geol Soc. London 162:501–512.
- Peltier A, Bianchi M, Kaminski E, Komorowski JC, Rucci A, Staudacher T. 2010. PSInSAR as a new tool to monitor pre‐eruptive volcano ground deformation: Validation using GPS measurements on Piton de la Fournaise. Geophys Res Lett. 37:1–5.
- Rodriguez-Gonzalez A, Fernandez‐Turiel JL, Perez‐Torrado FJ, Hansen A, Aulinas M, Carracedo JC, Gimeno D, Guillou H, Paris R, Paterne M. 2009. The Holocene volcanic history of Gran Canaria island: implications for volcanic hazards. J Quaternary Sci. 24:697–709.
- Raspini F, Bardi F, Bianchini S, Ciampalini A, Del Ventisette C, Farina P, Ferrigno F, Solari L, Casagli, N. 2016. The contribution of satellite SAR-derived displacement measurements in landslide risk management practices. Nat Hazards. 84:1–25.
- Righini G, Pancioli V, Casagli N. 2012. Updating landslide inventory maps using Persistent Scatterer Interferometry (PSI). Int J Remote Sens. 33:2068–2096.
- Roessner S, Wetzel HU, Kaufmann H, Sarnagoev A. 2005. Potential of satellite remote sensing and GIS for landslide hazard assessment in Southern Kyrgyzstan (Central Asia). Nat Hazards. 35:395–416.
- Salvati P, Pernice U, Bianchi C, Marchesini I, Fiorucci F, Guzzetti F. 2016. Communication strategies to address geohydrological risks: the POLARIS web initiative in Italy. Nat Hazard Earth Sys. 16:1487–1497.
- Sarro R, Mateos RM, Herrera G, García-Moreno I, Reichenbach P, Carralero IP, Naranjo J, Bejar-Pizarro M, Monserrat O, Solari L, et al. 2017. Methodology for assessing rockfall susceptibility within the ambit of civil protection: the Safety project. Proceedings of the 6th Interdisciplinary Workshop on Rockfall Protection, Barcelona, Spain.
- Schmincke HU. 1993. Geological field guide of Gran Canaria. 6th ed. Kiel: Pluto Press.
- Sobradelo R, Martí J. 1993. Bayesian event tree for long-term volcanic hazard assessment: Application to Teide-Pico Viejo stratovolcanoes, Tenerife, Canary Islands. J Geophys Res B: Solid Earth. 115:B5.
- Solari L, Ciampalini A, Raspini F, Bianchini S, Moretti S. 2016. PSInSAR analysis in the Pisa Urban Area (Italy): a case study of subsidence related to stratigraphical factors and urbanization. Remote Sens. 8:120.
- Spence RJ, Baxter PJ, Zuccaro G. 2004. Building vulnerability and human casualty estimation for a pyroclastic flow: a model and its application to Vesuvius. J Volcanol Geotherm Res. 133:321–343.
- Tomás R, Romero R, Mulas J, Marturià JJ, Mallorquí JJ, López-Sánchez JM, Herrera G, Gutiérrez F, González PJ, Fernández J, et al. 2014. Radar interferometry techniques for the study of ground subsidence phenomena: a review of practical issues through cases in Spain. Environ Earth Sci. 71:163–181.
- Torres R, Snoeij P, Geudtner D, Bibby D, Davidson M, Attema E, Potin P, Rommen B, Floury N, Brown M, et al. 2012. GMES Sentinel-1 mission. Remote Sens Environ. 120:9–24.
- Uzielli M, Nadim F, Lacasse S, Kaynia AM. 2008. A conceptual framework for quantitative estimation of physical vulnerability to landslides. Eng Geol. 102:251–256.
- Vilardo G, Isaia R, Ventura G, De Martino P, Terranova C. 2010. InSAR Permanent Scatterer analysis reveals fault re-activation during inflation and deflation episodes at Campi Flegrei caldera. Remote Sens Environ. 114:2373–2383.
- Watts A, Masson D. 2001. New sonar evidence for recent catastrophic collapses of the north flank of Tenerife, Canary Islands. Bull Volcanol. 63:8–19.