
ABSTRACT
Landslides bring damage to urbanization and cause negative effects on the quality of agricultural and forest areas and rivers. Therefore, it is of vital importance to detect displacements in landslide areas causing the loss of life and property. Different measurement methods such as Global Navigation Satellite System (GNSS) measurements, remote sensing etc. are used for monitoring movements in landslide areas and revealing surface deformations. Co-Registration of Optically Sensed Images and Correlation (Cosi-Corr) method (Remote sensing method) is one of these methods.
Although the Cosi-Corr method is used commonly to determine the displacements in dune, glacier, and earthquake areas, there are very few studies related to its use in landslide areas. In this study, the mass movements occurring in the study area were determined by the Cosi-Corr method and the use of very high resolution optical satellite images. General geomorphologic evaluations were performed related to the mass movements in the study area. Consequently, this study shows to be applicable of the Cosi-Corr method in determining the mass movements associated with slow-motion landslides.
1. Introduction
Landslide damages are mostly evaluated by considering earthquakes and excessive precipitation, which are the most important factors that trigger landslides. Hence, the dimensions of landslide damages are estimated to be lower than they are (Malet et al. Citation2000; Gili et al. Citation2000). However, landslides may also occasionally occur without natural triggering factors such as earthquakes or excessive precipitation. It is very important to monitor landslides and understand their dynamics in order to reduce or avoid the negative effects of landslides. The measurement of the surface displacements (determination of surface deformations) and the analysis of the movement caused by load effects are the easiest way to observe the development of landslides (Gili et al. Citation2000; Malet et al. Citation2000).
Different methods are used for monitoring movements in landslide areas and revealing surface deformations (Gili et al. Citation2000; Malet et al. Citation2000; Longoni et al. Citation2014; Yu et al. Citation2015; Ozturk et al. Citation2016; Thiebes et al. Citation2016; Uhlemann et al. Citation2016). In recent years, a remote sensing method, which is called the Co-Registration of Optically Sensed Images and Correlation (Cosi-Corr), has been developed by the California Institute of Technology for the determination of deformations and mass movements. The Cosi-Corr extension works as a part of ENVI software. It is proposed to be used free of charge by researchers in scientific studies (Ayoub et al. Citation2009). In this method, the correlations between two periodical images are determined by the normalized cross-spectrum along with the Fourier shift theorem after performing orthorectification and resampling without the need for additional information such as the measurements of ground-control points (GCPs) in the field by GNSS. Then, horizontal displacements between these two images are determined and these values can be represented by vectors (Leprince et al. Citation2007).
Displacements in the horizontal direction that occur in glacier, dune and landslide areas, especially in earthquake regions, can be measured in a similar way to the periodic measurement approach by GNSS by making use of aerial photograph or satellite image pairs of different time periods, and surface ruptures can be mapped correctly. In this method, the relative accuracy of approximately 1/20 pixel can be achieved with the Sub-pixel correlation (Leprince et al. Citation2007). For example, the resolution of Worldview 1 satellite image is 50 cm. In this case, a relative displacement of 50 cm / 20 = 2.5 cm occurring within the time specified in an area can be determined by using the Worldview satellite images of that area from different dates by the Cosi-Corr method.
Many researchers have carried out studies on different scales in dune, glacier, landslide and earthquake areas using this method. Some of these studies are as follows. Herman et al. (Citation2011) revealed the movement of ice masses in New Zealand, the south of the Alps using Advanced Spaceborne Thermal Emission and Reflection Radiometer (ASTER) satellite images and compared the obtained results with the results obtained from the GNSS measurements. Avouac et al. (Citation2006) examined the surface deformation, which occurred as a result of the Kashmir, Pakistan earthquake that took place on October 8, 2005, using ASTER satellite images and also performed the seismic analysis. Taylor et al. (Citation2008) determined the co-seismic displacements during the 7.9-magnitude earthquake that occurred in Denali in November 2002 with the help of Satellites Pour l'Observation de la Terre (SPOT) satellite images. Necsoiu et al. (Citation2009) researched the changes in the sand-deposit area in the Kobuk river valley (Alaska) using ASTER satellite images. Scherler et al. (Citation2008) stated the displacement by using SPOT satellite images in the glacier region located in Khumbu (region of Mount Everest) in Nepal. Ayoub et al. (Citation2009) determined fault ruptures and displacements resulted from the 7.1-magnitude California Hector Mine earthquake and the 7.3- magnitude California Landers earthquake by using the aerial photographs. Barisin et al. (Citation2009) detected the horizontal displacements that occurred on the Afar crack surface in September 2005 by using SPOT satellite images and the Cosi-Corr method. Konca et al. (Citation2010) researched the fault rupture process that occurred in Düzce in 1999 by the intensity of 7.1 by making use of SPOT satellite images, GNSS, and INSAR. The El Mayor-Cucapah earthquake that occurred in Mexico in 2010 was investigated in a detailed manner by the GNSS, INSAR and Cosi-Corr methods in the study carried out by Wei et al. (Citation2011). Leprince et al. (Citation2008) applied the Cosi-Corr method in the La Valetta landslide in the Ubaye valley located in the French Alps by making use of SPOT 5 satellite images. As a result of this study, they determined a displacement which was close to maximum 9 m per year. Furthermore, they demonstrated that the results of this study were consistent with the results obtained by InSAR (Squarzoni et al. Citation2003). Hermas et al. (Citation2012) examined the displacements that occurred in the (dune) region where sand dunes are found in Egypt by using SPOT satellite images, compared the results with the studies which were previously carried out in this region with other methods and emphasized that the Cosi-Corr method was consistent with the other results. In the study carried out in Ethiopia's Afar region by Rosu et al. (Citation2015), the displacements caused by the earthquake were determined using optical satellite images, and the results obtained from this study were compared with the software performing the similar function.
Upon evaluating the studies in the literature, the study which was carried out in Barcelonnette located in the south of the Ubaye valley in the French alps (Stumpf et al. Citation2014) is one of the few studies related to the application of the Cosi-Corr method in landslide areas in the literature. In addition, Lucieer et al. (Citation2014) researched the displacements resulted from landslide by Unmanned Aerial Vehicle (UAV), Cosi-Corr and structure from motion (SfM) methods and in Tasmania. Briefly, despite the fact that the Cosi-Corr method is used in dune, glacier, and earthquake areas, there are a few studies related to its use in landslide areas. It is extremely important to determine displacements in landslide areas causing the loss of life and property that frequently occur in the world.
In this study, mass movements arising from landslides were determined by using very high resolution optical satellite images (Worldview 1) and the Cosi-Corr method. General assessments related to the characteristic of the landslide and geomorphology of the study area were performed. Thus, the existing landslide risk in the study area was revealed.
2. The study area
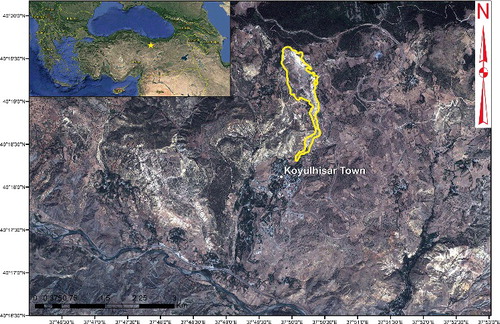
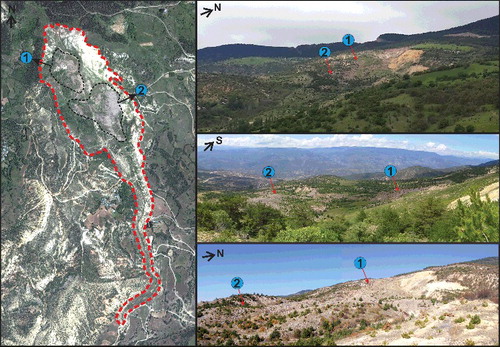
The city of Koyulhisar (Turkey) is located within the Northern Anatolian Fault Zone (NAFZ), a tectonically-active fault where rocks are generally faulted and cataclastic and contain discontinuities (). Many old and new landslides have taken place here given many steep slopes and often threaten settled areas. Huge landslides happened in Koyulhisar city on August 19, 1998 and June 20, 2000. As a result of them, 14 people lost their lives and Koyulhisar city centre, forests and agricultural areas took a knock (Sendir and ve Yılmaz Citation2002).
Figure 1. The study area (Koyulhisar City, Turkey) and landslide border (in yellow colour).
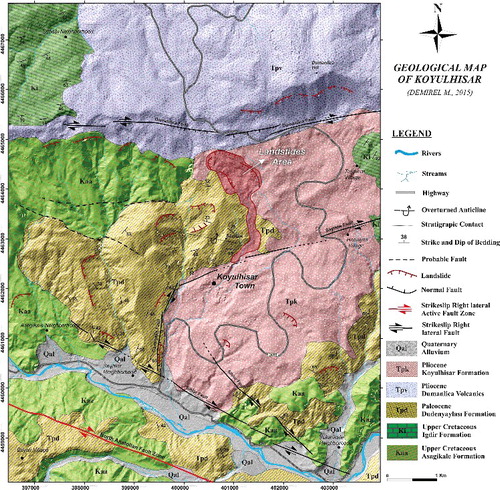
The study area is located on the North Anatolian Fault Zone and it is represented by the strike-slip right lateral fault belt. In addition, the Şıhlar Fault, Çamlıyaka Fault, Dumanlıca Fault and Saytepe Fault are present in this region closely related to Koyulhisar city centre (). These faults in the region trigger landslides due to the lithology of this region. Especially the sediments within the Koyulhisar formation become active under the effect of these active faults and they cause landslides by moving on the water-saturated ground (Tatar et al. Citation2000).
Figure 2. The geological map of the study area (Demirel Citation2015).
Very large old landslide masses are observed in the areas of Eocene clayey levels, Lower Miocene clayey and gypsum levels and Plio-Quaternary terrace sediments in Koyulhisar district center and its vicinity. Most of these landslides have a circular–rotational mechanism in general. The district centre of Koyulhisar is situated on an old landslide, which has occurred in a circular–rotational form. Moreover, these old landslide masses are active and it has maintained its continuous activity over time. However, this activity is not massive, but it is usually local landslides that are formed on the main mass (Tatar et al. Citation2000).
Slides are observed as debris flow mostly in northern Koyulhisar, commonly after a heavy winter. The landslides that occurred in 1998 and 2000 took place after heaviest winters and due to snow melting springs in recent years (Sendir and ve Yılmaz Citation2002; Hastaoglu et al., Citation2015). A previous study showed that potential slope instabilities within the study area have generally southern tendency (S, SW–SE) (Sendir and ve Yılmaz Citation2002). Observations of old and new landslides between the Şıhlar Fault in the south and the Dumanlıca Fault in the north indicated a complex landslide system made up of a large combination of landslides (Hastaoglu et al. Citation2015; Türk and Görüm Citation2015).
3. Material and methods
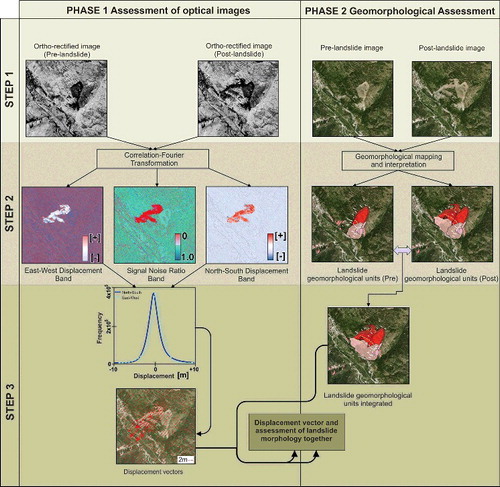
The operational steps followed in this study process are presented in .
Figure 3. The methods followed in the study.
The data presented below were used within the scope of this study.
Worldview 1 basic panchromatic optical satellite images (11 August 2013 and 26 August 2014) in resolution 50 cm,
Very high accuracy ortho-image (August 2013, absolute accuracy about 5–10 cm) produced by aerial photogrammetry for absolute georeferencing accuracy,
Very high accuracy Digital Elevation Model (DEM – August 2013, absolute accuracy about 10 cm) produced by aerial photogrammetry for accurate modelling topography effects.
Landslide inventory data (It was used to emphasize to be risky in terms of landslide of the study area. Landslides happened in 1998 and 2000 are on landslide area determined in landslide inventory data).
In this study, The Worldview-1 satellite image was used. It offers a high-capacity, panchromatic imaging system which features 0.50 m resolution imagery at nadir. Operating at an altitude of 496 km, WorldView-1 satellite has an average revisit time of 1.7 days and is capable of collecting up to 750,000 square km per day of half-meter imagery.
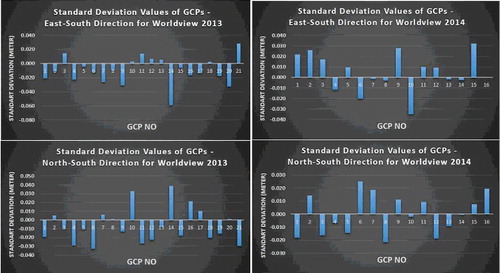
Areal displacements and the direction of mass movements can be determined by using optical satellite images and the Cosi-Corr method. Worldview 1 optical satellite images were obtained (August 11, 2013 and August 26, 2014, purchased by scheduling). The very high accuracy (absolute accuracy about 5–10 cm) ortho-image generated by aerial photogrammetry in August 2013 and DEM were used to ensure high georeferencing accuracy and to avoid negative topography effects. Mass movements and horizontal displacements were determined by performing orthorectification, co-registration and correlation by using the Cosi-Corr software in the study area. The existing ortho-image (produced by aerial photogrammetry) was used as the first master image for raw Worldview optical image (11 August 2013). Tie points were selected on stable features in the appropriate distribution between ortho-image and raw Worldview image (11 August 2013). These tie points were optimized using the sub-pixel correlation and converted into GCPs for precise orthorectification. 21 GCPs were used and the average misregistration between the ortho-image and Worldview image (11 August 2013) was 12 mm (mm), with a standard deviation of 27 mm (). Tie points were then selected on stable features in the appropriate distribution between this first master ortho-image (from Worldview images on 11 August 2013) and raw Worldview image (26 August 2014). Tie points for each image were optimized using the sub-pixel correlation and converted to GCPs for orthorectification. 16 GCPs were created between image pairs. The average misregistration was 5 mm, with a standard deviation of 23 mm ().
Figure 4. Distributions of errors and standard deviation values of GCPs.
The quality of the results was assessed from the signal-to-noise ratio (SNR) band and the histogram of the SNR band (Leprince et al. Citation2007). The histogram shows the SNR values against the number of samples. The SNR value of 0 refers to no correlation and 1 shows that the result is highly correlated. indicates the histogram of a coherence image (). The 32 × 4 (window × pixel size) is detected to be the best combination. It is only shown to range from 0.97 to 1 in due to the fact that most of the values are very close to one.
Figure 5. It shows the SNR value against the number of samples. Despite the fact that the SNR bands from 64 × 8, 64 × 16, 64 × 32 (window × step size) have a similar value and trend, the SNR from 32 × 4 combination has more affinity to the correlation value of 1.
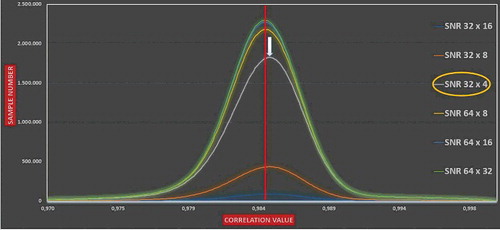
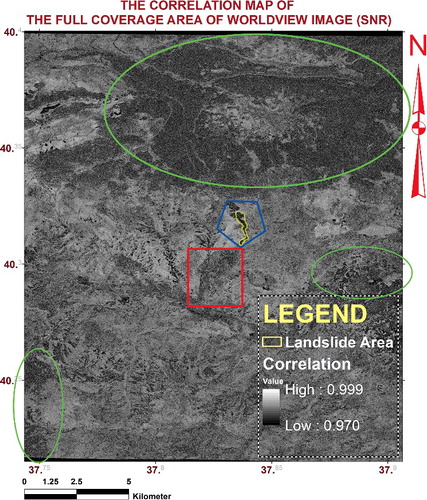
Figure 6. It shows the SNR band of the Worldview 1 (11 August 2013) and Worldview 1 (26 August 2014) image correlation. Although the SNR ranges from 0 to 1, here it is shown to be from 0.97 to 1 for a better coherence. Decorrelation areas (cloud cover, landslide, vegetation, etc.) are shown in different geometric figures such as an ellipse, rectangle and polygon. The ellipses in green colour indicate forest areas. The rectangle in red colour shows the centre of Koyulhisar city. The polygon in blue colour indicates the landslide area.
4. Results and discussion
The displacements were determined by integration of the north–south (NS) and east–west (EW) directions (). It was detected that these mass movements revealed by considering the borders of the landslides that had previously occurred in the region in 1998 and in 2000 were compatible with the topographic structure and slope of the field. The profile and cross-sections were determined within the landslide area. The profile (AA′) and cross-sections (BB′, CC′, DD′, EE′) were taken within the landslide area, and the displacements along this profile and cross-sections were detected ( and ).
Figure 7. The displacement map and mass movements obtained by the Cosi-Corr method.
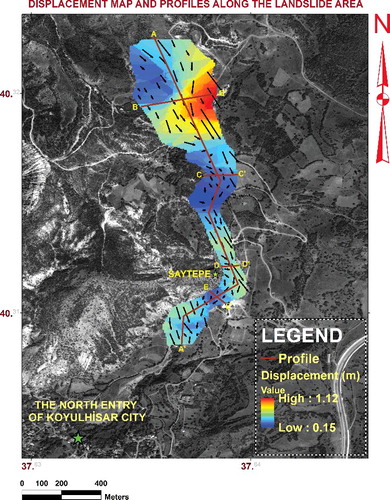
Figure 8. Displacements obtained along the profile and cross-sections.
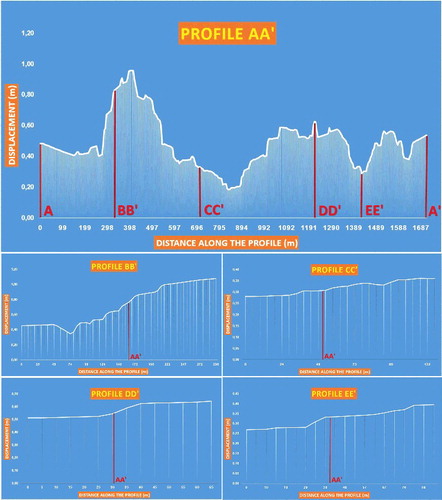
While the displacement values are higher in the upper part of the landslide area due to the topographical (slope, aspect, etc.) and lithological structure ( and ), they decelerate at the CC' cross-section (along the profile AA′). Then, they accelerate from top to bottom and reach a minimum at the EE′ cross-section vicinity (along the profile AA′). This is due to the Saytepe hill which is situated here (). The Saytepe hill is a natural obstacle reducing the potential danger that may arise at the BB' cross-section located in one of the topmost sections of the landslide, with the highest displacement values being measured in this section (between 0.45 m and 1.10 m). In other cross-sections (CC′, DD‘, EE’), displacement values range from approximately 5 to 10 cm.
On the other hand, Tatar et al. (Citation2000) state that the landslides that occur in the vicinity of Koyulhisar are in the form of circular rotation and they still continue their activity. However, they have emphasized that these activities are not massive and are usually local landslides that are formed on the main mass. The results obtained within the scope of this study confirm almost all of these interpretations.
After analysing and evaluation of satellite images, field studies have been performed for geomorphological evaluations in the study area (phase 2 in ). In the detailed examinations performed within the landslide area, currently ongoing tension cracks (between 15 and 45 cm in depth), sliding surfaces and step-shaped falls are observed. On the other hand, the directions of the movements obtained by Cosi-Corr were observed to be consistent with the field study. Furthermore, the rock and block sized materials that have been previously ruptured within the landslide under the effect of snow and rain in the winter months move in the direction of the slope inclination. These block-sized materials are made up of volcanic rocks of the Dumanlıca Formation and start to move along the slope inclination in the soft soil formed after the clayey units under it have been saturated with water. This movement may accelerate depending on the time and creep. The block-rock sized materials moving within the landslide are presented in . As a result of the field studies, Koyulhisar landslide and many secondary landslide in the region have been inspected by hydro-meteorological conditions and structural factors.
Figure 9. The block-rock-sized materials moving within the landslide.
5. Conclusion
In this study, the mass movements occurred in the study area was determined by the Cosi-Corr method and very high resolution satellite images. Afterwards, field studies were performed for geomorphological evaluations in the study area. The results revealed with Cosi-Corr method was also confirmed by the field studies carried out in the landslide area. Land surveying such as GNSS, terrestrial surveying and other measurements is not required in this method. The Cosi-Corr extension (a part of ENVI software) is free of charge for scientifically researches. Determination of area-based movements instead of point movements such as GNSS and similar methods brings to the fore to the Cosi-Corr method. In addition, it is more economic and more efficiency in determining displacement movements in studies which high accuracy is not required in landslide areas. To reveal non-systematic mass movements accurately is of vital importance. This study shows that very high resolution optical satellite images and Cosi-Corr method can be used to determine the mass movements in slow-motion landslides and geomorphological evaluations.
The present lithological and topographical status of the city of Koyulhisar provides a suitable environment for the formation of landslides. There are huge old landslide masses in the city centre. The vast majority of these landslides develop as a circular–rotational motion. The front of this mass of old landslides is open and poses a danger for the future. Moreover, the Saytepe hill, located on the flow route of mass, acts as a natural barrier that reduces a potential great danger.
Acknowledgements
The author thanks The Scientific Technological Research Council of Turkey (TUBITAK) for supporting the studies under TUBITAK Project.
Disclosure statement
No potential conflict of interest was reported by the author.
Additional information
Funding
References
- Avouac JP, Ayoub F, Leprince S, Konca O, Helmberger DV. 2006. The 2005, Mw 7.6 ''Kashmir earthquake: sub-pixel correlation of ASTER images and seismic waveforms analysis. Earth Planet Sci Lett. 249:514–528.
- Ayoub F, Leprince S, Avouac JP. 2009. Co-registration and correlation of aerial photographs for ground deformation measurements. ISPRS J Photogramm Remote Sens. 64:551–560.
- Barisin I, Leprince S, Parsons B, Wright T. 2009. Surface displacements in the September 2005 afar rifting event from satellite image matching: asymmetric uplift and faulting. Geophys Res Lett. 36:L07301. doi:10.1029/2008GL036431.
- Demirel M. 2015. Monitoring Koyulhisar (Sivas) landslide by GPS and PS-Insar methods and its geological features [Master of Science Thesis]. Sivas: Cumhuriyet University, Institute of Natural Science.
- Gili JA, Corominas J, Rius J. 2000. Using global positioning system techniques in landslide monitoring. Eng Geol. 55:167–192.
- Hastaoğlu KÖ, Türk T, Koçbulut F, Şanlı F, Poyraz F, Yılmaz I, Şanlı DU. 2015. Monitoring landslides and risk analysis based on disaster information system by GNSS and PS-InSAR methods: landslides in Koyulhisar city. Report under TÜBİTAK Project 111Y111. Sivas: Cumhuriyet University, Engineering Faculty.
- Herman F, Anderson B, Leprince S. 2011. Mountain glacier velocity variation during a retreat/advance cycle quantified using sub-pixel analysis of ASTER images. J Glaciol. 57(202):197–207.
- Hermas E, Leprince S, El-Magd IA. 2012. Retrieving sand dune movements using sub-pixel correlation of multi-temporal optical remote sensing imagery, northwet Sinai Peninsula, Egypt. Remote Sens Environ. 121:51–60.
- Konca O, Leprince S, Avouac JP, Helmberger DV. 2010. Rupture process of the 1999 Mw 7.1 Duzce earthquake from joint analysis of SPOT, GPS, InSAR, strong-motion, and Teleseismic data: a supershear rupture with variable rupture velocity. Bull Seismol Soc Am. 100(1):267–288.
- Leprince S, Barbot S, Ayoub F, Avouac JP. 2007. Automatic and precise orthorectification, coregistration and subpixel correlation of satellite images, application to ground deformation measurements. IEEE Trans Geosci Remote Sens. 45(6):1529–1558.
- Leprince S, Berthier E, Ayoub F, Delacourt C, Avouac JP. 2008. Monitoring earth surface dynamics with optical imagery. EOS Trans Amer Geophys Union. 89(1):1–12.
- Longoni L, Papini M, Arosio D, Zanzi L, Brambilla D. 2014. A new geological model for Spriana landslide, Bull Eng Geol Environ. 73:959. https://doi.org/10.1007/s10064-014-0610-z
- Lucieer A, Jong SMD, Turner D. 2014. Mapping landslide displacements using structure from motion (SfM) and image correlation of multi-temporal UAV photography. Prog Phys Geog. 38(1):97–116.
- Malet JP, Hartig S, Calais E, Maquaire O. 2000. Apport du GPS au Suivi en Continu des Mouvements de Terrrain: application au Glissement-Coulee de Super-Sauze (Alpes-de-Haute-Provence, France). Earth Planet Sci. 331:175–182.
- Necsoiu M, Leprince S, Hooper MD, Dinwiddie CL, McGinnis NR, Walter GR. 2009. Monitoring migration rates of an active subarctic dune field using optical imagery. Remote Sens Environ. 113:2441–2447.
- Ozturk U, Tarakegn YA, Longoni L, Brambilla D, Papini M, Jensen J. 2016. A simplified early-warning system for imminent landslide prediction based on failure index fragility curves developed through numerical analysis. Geomat Nat Hazards Risk. 7(4):1406–1425. doi:10.1080/19475705.2015.1058863
- Rosu A-M, Pierrot-Deseilligny M, Delorme A, Binet R, Klinger Y. 2015. Measurement of ground displacement from optical satellite image correlation using the free open-source software MicMac. ISPRS J Photogramm Remote Sens. 100:48–59.
- Scherler D, Leprince S, Strecker MR. 2008. Glacier-surface velocities in alpine terrain from optical satellite imagery-accuracy improvement and quality assessment. Remote Sens Environ. 112:3806–3819.
- Sendir H, ve Yılmaz I. 2002. Structural, geomorphological and geomechanical aspects of the Koyulhisar landslides in the North Anatolian Fault Zone (Sivas, Turkey). Env Geol. 42:52–60.
- Squarzoni C, Delacourt C, Allemand P. 2003. Nine years of spatial and temporal evolution of the “La Valette” landslide observed by SAR interferometry. Eng Geol. 68:53–66.
- Stumpf A, Malet J-P, Allemand P, Ulrich P. 2014. Surface reconstruction and landslide displacement measurements with Pléiades satellite images. ISPRS J Photogramm Remote Sens. 95: September 2014, 1–12.
- Tatar O, Aykanat D, Koçbulut F, Yılmaz I, Sendir H, Kürçer A, Sağlam B. 2000. Koyulhisar İlçe Merkezi ve İlçe Emniyet Amirliği Hizmet Binası Heyelan Etüd ve Değerlendirme Raporu. Sivas: Cumhuriyet University, Engineering Faculty.
- Taylor M, Leprince S, Avouac JP, Sieh K. 2008. Detecting coseismic displacements in glaciated regions: an example from the great November 2002 Denali earthquake using SPOT horizontal offsets. Earth Planet Sci Lett. 270:209–220.
- Thiebes E, Tomelleri A, Mejia-Aguilar M, Rabanser R, Schlögel M, Mulas, Corsini A. 2016. Landslides and engineered slopes. experience, theory and practice. In: Proceedings of the 12th International Symposium on Landslides; 12–19 June 2016; Napoli, Italy: CRC Press; p. 1897–1902.
- Türk T, Görüm T. 2015. Determination of the horizontal displacements in the landslide areas by optical satellite images: a case study in North Anatolian Fault Zone (NAFZ) and around the city of Koyulhisar. Report under TÜBİTAK Project 113Y188. Sivas: Cumhuriyet University, Engineering Faculty.
- Uhlemann S, Smith A, Chambers J, Dixon N, Dijkstra T, Haslam E, Meldrum P, Merritt A, Gunn D, Mackay J. 2016. Assessment of ground-based monitoring techniques applied to landslide investigations. Geomorphology. 253:438–451.
- Yu Y, Shang Y, Sun H, Wang E. 2015. Displacement evolution of a creeping landslide stabilized with piles. Natural Hazards. 75:1959. https://doi.org/10.1007/s11069-014-1406-y
- Wei S, Fielding E, Leprince S, Sladen A, Avouac J, Helmberger D, Hauksson E, Chu R, Simons M, Hudnut K, et al. 2011. Nature Geosci. 4:615–618.