
 ?Mathematical formulae have been encoded as MathML and are displayed in this HTML version using MathJax in order to improve their display. Uncheck the box to turn MathJax off. This feature requires Javascript. Click on a formula to zoom.
Abstract
The main focus in this article is given on the erosion potential method (EPM) modification. The aim was to provide a seasonal assessment, in addition to annual erosion assessment for the case study Dubračina catchment, Croatia. Seasonal assessment of erosion processes in the catchment will contribute to planning strategies that would benefit local community and enable the more appropriate and timely definition of erosion mitigation and protection measures. Original EPM was used for erosion intensity and sediment production assessment for two time periods: the past and the present time. The overall classification of erosion intensity categorises the erosion processes in the catchment as slight, although excessive erosion processes are present in some areas. For the method modification purpose, three main model parameters were changed: precipitation, soil protection coefficient and temperature. The greatest soil loss was found to occur in autumn, followed by summer, spring and winter period. The results indicated good erosion intensity and soil loss approximation obtained with the modified EPM and 13% soil loss deviation in comparison to the results obtained with original EPM. The erosion intensity, land cover map for both the present time and summer season and soil surface change over a two-year time period were verified.
1. Introduction
The dominant geomorphic process for much of Earth’s land surface is soil erosion by water (Toy et al. Citation2002). Erosion can occur in all types of soil at different rates and in different forms. Some of these erosion types occur in isolation and are influenced by various factors affecting erosion (such as climate and land cover) (Merritt et al. Citation2003). The most important elements that influence the rate of erosion are climate, soil, topography, vegetation cover and anthropogenic factors (Morgan Citation2005). Climate conditions are the main cause for high erosion rates in the Mediterranean countries, according to Kosmas et al. (Citation1997). Soil loss also varies with vegetation cover and land use management practices, which make both extremely influential factors in erosion formation and overall soil loss in the Mediterranean (Kosmas et al. Citation1997).
There are a variety of methodologies and models that can be applied to erosion sediment production assessment (Merritt et al. Citation2003, de Vente and Poesen Citation2005). The concept behind them differs; each model integrates different scientific methods and modelling approaches (Thiemann Citation2006). Water erosion models differ not only in the output information they provide (e.g. erosion sediment production, sediment transportation and/or erosion intensity) but also in terms of complexity, the process considered and the data required for model calibration and model application (de Vente and Poesen Citation2005).
The geographic information systems (GIS) and remote sensing (RS) technologies today complement existing erosion models by enabling easier observations of land cover changes (using RS) and are used as a practical tool for model development and analysis (GIS) (Alam et al. Citation2016). The three combined result in a useful decision-making tool for stakeholders and decision makers in land management (Alam et al. Citation2016). Many authors such as Alam et al. (Citation2016) in the Mangla catchment, Pakistan; Khosrokhani and Pradhan (Citation2014) in Kuala Lumpur, Malaysia; Al-Bakri et al. (Citation2016) in Yarmouk catchment, Jordan; and many others complemented erosion models with GIS and RS technology. Others, such as Šurda et al. (Citation2007), used GIS in Topolcianky, Slovakia or RS such as Paiboonvorachat and Oyana (Citation2011) in the Nan catchment, Thailand.
Frequently used time interval for which erosion sediment production is calculated is one year. Today, increasing interest is given to event-based calculation of sediment production, but those models are mainly complex, physical-based models (Merritt et al. Citation2003). Less attention is given to seasonal erosion sediment production assessments, which can contribute to the planning strategies and implementation of erosion mitigation and prevention measures and benefit the local community. Interesting research was done by Cerdà (Citation2002) that evaluated the seasonal sediment production oscillations in the Monnegre River catchment, Spain; by Millward and Mersey (Citation1999) that modified the RUSLE (Revised Universal Soil Loss Equation) model to calculate the erosivity values for each season in Río Ayuquíla, Mexico; by Cilek et al. (Citation2015) that used PESERA (Pan-European Soil Erosion Risk Assessment) model on Egribuk catchment, Turkey, for monthly soil loss assessment; by Kwaad (Citation1991) that estimated the value of soil loss in the summer season in South-Limbourg, Netherlands; by Megnounif et al. (Citation2007) that studied seasonal sediment production in the Upper Tafna catchment in Algeria; by Rudra et al. (Citation1986) that presented the GAMES (the Guelph model for evaluating the effects of agricultural management systems on erosion and sedimentation) model, seeking to provide a seasonal sediment production and sediment yield process; by Coote et al. (Citation1987) that analysed the seasonal variations in soil erodibility in Ontario; and by Gallart et al. (Citation2002), in the Vallcebre catchments, Spain.
In this article, the erosion processes in the case study area of Dubračina catchment, Croatia, are analysed. Noted erosion-related problems in the catchment date from the 19th century and have developed to excessive erosion processes in two of Dubračina`s sub-catchments: Slani Potok and Mala Dubračina. Various erosion mitigation and prevention measures have been conducted but failed to prevent further increase in erosion processes in the most endangered areas.
The aim of this article is to provide a seasonal assessment of erosion intensity and sediment production, in addition to annual erosion assessment for the case study Dubračina catchment to contribute to planning strategies that would benefit the local community and enable more appropriate and timely definition of erosion mitigation and protection measures in the area. Due to the limited number of measured parameters and available data, as well as the lack of previous detailed research on erosion processes in the catchment, the erosion potential method (EPM) was selected. This method was developed for catchments with karstic terrain and torrential rivers (Gavrilović Citation1972, Gavrilović et al. Citation2008), all of which are the characteristics of the Dubračina catchment. The method was developed for annual assessment of the erosion processes (Gavrilović Citation1972).
In this article, after a short presentation of the study area and the EPM intended for the annual erosion intensity and sediment production assessment, the main focus is on the EPM modification that is proposed by the authors to provide a seasonal assessment of the erosion processes in the catchment. The method was complemented using GIS and RS for data analysis and model development. The results showing annual and seasonal erosion intensity and sediment production and the application of proposed modification are presented and discussed. In addition, the past and present land cover maps are derived based on Landsat data for the catchment area and later verified using visual land survey method for the map representing the present.
2. Materials and methods
2.1. Case study: Dubračina catchment
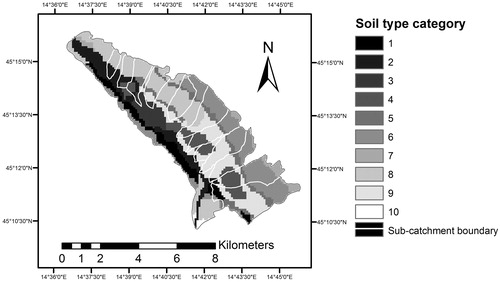
The EPM was applied on a small catchment in Croatia, the Dubračina River catchment. The catchment has an area of 43 km2 and is characterised by steep slopes in its lower and upper part, with an elevation difference of 920 m and a complex soil structure, as shown in .
Figure 1. Soil type distribution and category description for the Dubračina catchment.
During the rainy season, the density of the water network increases throughout the Dubračina catchment area, activating all torrential tributaries (; ) and forming additional water paths with torrential characteristics. This phenomenon directly triggers erosion processes in the area. The area around the Slani potok and Mala Dubračina sub-catchments are covered with flysh material, which is generally considered impervious and has low infiltration coefficient. Intensive water erosion processes are especially visible in the Slani Potok sub-catchment area in the form of splash and gully erosion, with characteristics of excessive erosion.
Figure 2. Distribution of the Dubračina catchment sub-catchments.
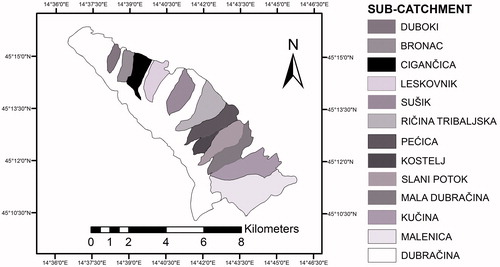
Table 1. Characteristics of Dubračina catchment and its sub-catchments.
Problems related to water erosion have been known to exist in the Dubračina catchment since the 19th century. The first land instability map was produced in the 1970s, after a severe flash flood in the 1960s caused major damage to the river structures and initiated numerous landslides in the area. Since then, several attempts have been made to mitigate the erosion processes in the catchment, including reforestation measures, river regulation and the construction and maintenance of structures to prevent and mitigate erosion and flash flooding, but they have had no significant effect on the intensity of the erosion processes in the area. To date, maps showing the erosion intensity and sediment production in the catchment on an annual or seasonal level that can also distinguish the areas that are more or less affected and endangered by erosion processes do not exist. Such maps would enable the more appropriate and timely definition of erosion mitigation and protection measures, which could minimise the structural measures, which are the most expensive to implement.
2.2. Erosion potential method
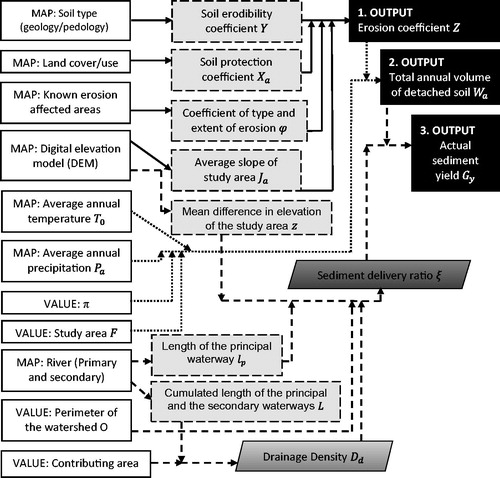
The EPM (also known as the Gavrilović method) was developed by Gavrilović based on field research conducted in the Morava River Catchment area in Serbia and has, over the years, been applied worldwide in areas threatened by water-induced erosion processes (see the review by Dragičević et al. Citation2016). The erosion model presented in this article () is based on the EPM and is used to provide three results: the erosion coefficient (-) (EquationEquation (1)
(1)
(1) ), the total annual volume of detached soil Wa (m3/year) (EquationEquation (2)
(2)
(2) ) and the actual sediment yield Gy (m3/year) (EquationEquation (4)
(4)
(4) ):
(1)
(1)
where Y is the soil erodibility coefficient (-), Xa is the soil protection coefficient (-), is the coefficient of type and extent of erosion (-) and Ja is the average slope of the study area (%). The erosion coefficient is the only method output that gives both numerical and descriptive information about the area susceptibility to erosion processes ().
(2)
(2)
where T is the temperature coefficient (-) (EquationEquation (3)(3)
(3) ), Pa is the average annual precipitation (mm) and F is the study area (km2).
Figure 3. Flow chart of the model based on the EPM.
Temperature coefficient is calculated using EquationEquation (3)(3)
(3) :
(3)
(3)
where T0 is the average annual temperature (°C).
(4)
(4)
where ξ is the sediment delivery ratio (-) and can be calculated using the modified EquationEquation (5)(5)
(5) proposed by Lazarevic (de Vente and Poesen Citation2005):
(5)
(5)
where O is the perimeter of the study area (km), z is the mean difference in the elevation of the study area (km), lp is the length of the principal waterway (km) and Dd is the drainage density (km/km2) (EquationEquation (6)(6)
(6) ):
(6)
(6)
where la is the cumulative length of the secondary waterways (km) and L is the cumulated length of the principal and secondary waterways (km).
The soil protection coefficient, soil erodibility coefficient and coefficient of type and extent of erosion are determined using tables that provide descriptive and numerical evaluations for these parameters ().
Table 2. Descriptive evaluation of the method parameters (de Vente and Poesen Citation2005; Haghizadeh et al. Citation2009) and the numerical and descriptive evaluation for the erosion coefficient Z applicable in the Mediterranean area (de Vente and Poesen Citation2005).
Erosion intensity and sediment production for the Dubračina catchment using an erosion model based on the EPM were assessed for two time periods: the past (1961–1990) and the present (1991–2020). The input data that differ for both time-series are as follows:
Average annual precipitation
,
Average annual temperature
Soil protection coefficient
The average annual precipitation and average annual temperature
for the past time period (1961–1990) were obtained from the Croatian Meteorological and Hydrological Service in the form of spatial distribution maps. The maps representing the present data (1991–2020) for these two parameters were obtained from, and described in more detail in article given by, Dragičević et al. (Citation2017).
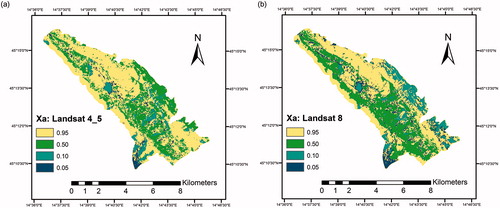
The soil protection coefficient for the past is based on the land cover maps derived from the Landsat 4 and 5 data scene from August 1984 (), and that for the present time is based on the Landsat 8 data scene from August 2013 (). The land cover map based on the Landsat scene was obtained using supervised classification of the data in the ERDAS Imagine 2014 software and included six (6) land cover classes: water, urban area, medium dense vegetation, bare rock, bare soil to rare vegetation and dense vegetation. The land cover map representing the present derived from the Landsat images was verified using the visual land survey method and by observing twenty (20) on-site locations in July 2016.
Figure 4. Soil protection coefficient according to numerical evaluation of different land cover/use maps: (a) Landsat 4 and 5 data source, (b) Landsat 8 data source.
2.3. EPM modification
In this section of the article, an explanation for the modification of the Gavrilović method for the season soil erosion intensity and sediment production assessment is presented. For this purpose, three main parameters are changed in relation to the existing version of the Gavrilović model: temperature, precipitation and soil protection coefficient.
The average seasonal temperature , average seasonal precipitation
and soil protection coefficient
representing seasonal soil cover are used. The average seasonal temperature
and average seasonal precipitation
are derived using the same methodology as Dragičević et al. (Citation2017) for the present, with assumptions that the spatial distribution remained unchanged, and the differences in the values were derived from the change in the average values between the time periods using input data obtained from the Croatian Meteorological and Hydrological Service for all four past time seasons (1961–1990). The soil protection coefficient
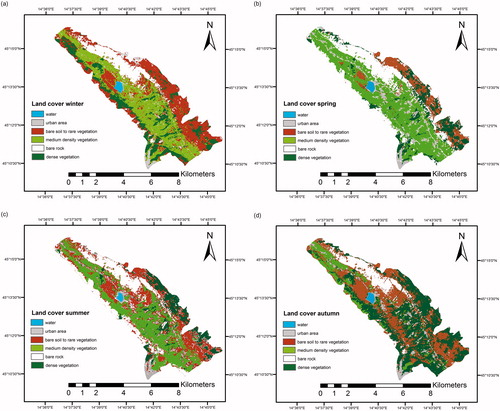
is based on Landsat 8 data from January 2016, April 2014, August 2013 and October 2014, representing winter, spring, summer and autumn (). Ideally, all data (Landsat images) would originate from the same year; however, due to a large amount of lower quality data and the large amount of clouds, the chosen dates were selected as the most appropriate and the closest in time with good-quality data.
Figure 5. Land cover for the Dubračina catchment based on Landsat 8 images: (a) winter; (b) spring; (c) summer; (d) autumn.
3. Results and discussion
3.1. Erosion intensity and sediment production assessment for the past and present
The erosion coefficient , which indicates the erosion intensity in the catchment, the total annual volume of the detached soil
, which indicates the overall erosion sediment production on an annual basis, and the actual sediment yield
, which indicates the erosion sediment yield transported downstream over one year, were derived in a form of maps for the Dubračina catchment. For each output parameter (
,
and
), two maps were generated ( ), one representing the past (1961–1990) and the other representing the present (1991–2020). The maps showing the change in the time series for
,
and
are presented in , which clearly indicates the areas of increase/decrease in the values.
Figure 6. Erosion coefficient Z for the Dubračina catchment based on the EPM: (a) past time 1961–1990, (b) present time 1991–2020.
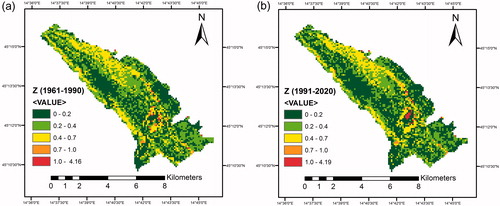
Figure 7. Total annual volume of the detached soil Wa in m3/cell/year for the Dubračina catchment based on the EPM: (a) past time 1961–1990, (b) present time 1991–2020.
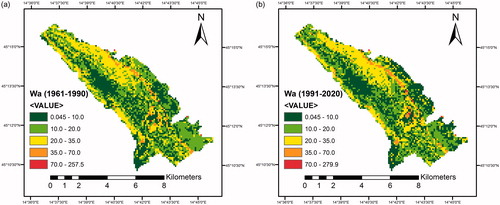
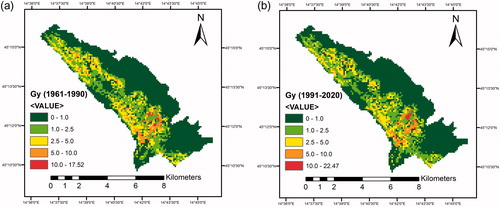
Figure 8. Actual sediment yield in m3/cell/year for the Dubračina catchment based on the EPM: (a) past time 1961–1990, (b) present time 1991–2020.
As seen in and , the most noticeable spatial change in erosion coefficient was recorded around the Slani Potok and Mala Dubračina sub-catchments, where the area encompassed by excessive erosion (
has increased from the past to the present. The change in the mean values of the past and the present is approximately 9% (), showing an overall decrease in erosion intensity in the catchment over the years; greater changes are noted on the sub-catchments Kučina, Leskovnik, Slani Potok, Mala Dubračina and Ričina Tribaljska.
Similar changes are observed on the spatial distribution map representing the total annual volume of the detached soil , between the time periods. The average change in values throughout the catchment is found to decrease by 3% from the past to the present (). In the past, the average value of the detached soil in the catchment was 1564 m3/km2/year, and in the present, the value is 1512 m3/km2/year. Based on these values, it can be concluded that this change is not significant; however, when the minimum and maximum value changes within the sub-catchments are considered (), for example, the change in
per sub-catchment, sub-catchments of Leskovnik, Ričina Tribaljska, Slani Potok, Mala Dubračina and Kučina contribute the most to the overall change in
values; they all exhibit values that increase/decrease by up to several times the average values for the entire catchment. This is mostly due to expansion of areas affected by medium to excessive erosion processes that are mostly oriented around Slani Potok and Mala Dubračina sub-catchments.
Table 3. Descriptive statistics for the derived past and present model outputs (,
,
) for the entire catchment of Dubračina.
Table 4. The minimum, mean and maximum change in sub-catchments between the time series for all three model outputs (Z, Wa, Gy).
The changes in all three model outputs (,
and
) shown in indicate that the greatest change occurs around the sub-catchments of Slani Potok and Mala Dubračina (see also ).
The calculated value for the total annual volume of the detached soil for the present time is 64 811m3/catchment/year, and that for the past is 67 073 m3/catchment/year, corresponding to an overall decrease in erosion production by 3.4%. The actual sediment yield indicates a change of 4.3%, from a value of 5 573 m3/catchment/year in the past to a value of 5 332 m3/catchment/year in the present time.
The current erosion intensity in the catchment and the erosion sediment production and transportation are represented by the model outputs from 1991 to 2020 time-series. Very slight erosion covers the largest area of the catchment, approximately 44.98%, followed by slight erosion at 34.19%, moderate erosion at 17.11% and severe and excessive erosion, which together cover approximately 3.72% of the catchment area. Overall, the average erosion coefficient for the Dubračina catchment is 0.25, which classifies it as an area of slight erosion. Although the overall classification categorises the erosion processes in the catchment as slight, the maximum values reach 4.189, which is more than 4 times higher than the defined boundary value for the excessive erosion class.
3.2. Seasonal erosion intensity and sediment production assessment using the EPM modification
Of three modified parameters, only the soil protection coefficient affects all three model outputs. This parameter is based on seasonal land cover maps obtained from Landsat images. The greatest change in land cover is found between the dense, medium dense and bare soil categories and the rare vegetation category. The changes in the urban area are related to the ‘errors’ in misinterpreting the urban area and bare rock categories shown and described later in the verification section. Bare rock is most noticeable in the spring and summer, whereas in the autumn and winter, the bare soil to rare vegetation category is most noticeable. The bare soil to rare vegetation is the least widespread in the spring, when medium dense vegetation covers the largest area in the catchment. Dense vegetation is the most widespread in the autumn and decreases from winter to summer, changing its category to medium dense vegetation.
When changing the soil protection coefficient based on different land cover maps, with each representing one season, the value range of the model output erosion coefficient is not changed, but the spatial distribution of its values is changed, as shown in .
Figure 9. Erosion coefficient (a) winter, (b) spring, (c) summer, (d) autumn.
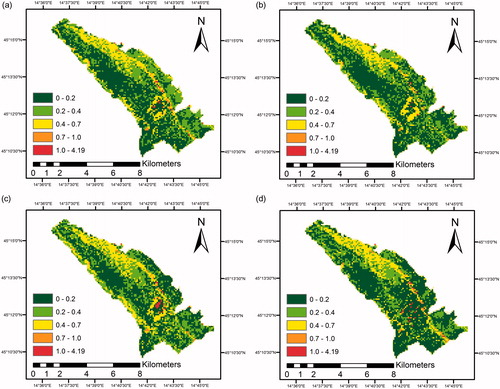
The mean values for the erosion coefficient () indicate that the catchment should be the most exposed to erosion processes during the summer (0.25) and winter (0.24) but that it is least exposed during the spring (0.22) and autumn (0.2). This is not actually the case because when deriving the erosion coefficient, not all of the significant factors that influence erosion, such as temperature and precipitation, are considered. In reality, higher values for the erosion coefficient indicate that the soil type and vegetation cover are more effective at protecting the top soil surface at a given time of year. This corresponds to the change in land cover over one year, where during the winter and summer, the vegetation cover is decreasing and is less dense, whereas during the spring, the vegetation is at its peak.
Table 5. Descriptive statistics obtained using the EPM model and the representative model outputs.
The other two modified parameters average seasonal temperature and precipitation affect only the total seasonal volume of the detached soil and the actual sediment yield
.
The descriptive statistics, including the minimum, mean and maximum values and the standard deviation, are given for all three model outputs and
for each season (winter, spring, summer and autumn), with the sum representing the soil volume for the entire catchment given only for
and
, in .
and show the distribution of soil loss, transported sediment yield and erosion coefficient at different times of year. The greatest soil loss occurs in autumn, followed by summer, spring and winter.
Figure 10. Estimation of erosion coefficient (), redistribution of the soil loss (
) and transported sediment yield (
) within the seasons and comparison with annual soil loss for present time (
).
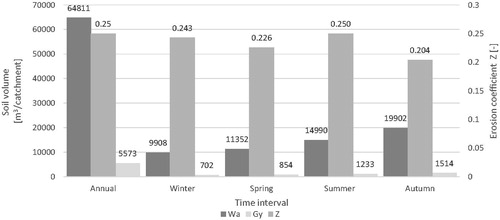
Because temperature and precipitation have a significant influence on soil loss and the Gavrilović model, their influence is observed in the values for each season. The time of year with the most rain in the Dubračina catchment is autumn (517.3 mm for the present), followed by winter, spring and summer. The high values of soil loss in summer are a result of the contribution of high temperature to rainfall. The lowest values for soil loss are obtained for the winter period, which is expected because of the lower temperature and lower precipitation.
When comparing the values for the total volume of the detached soil on an annual basis () for the Dubračina catchment in the present time period with the summarised seasonal values
, it can be noted that the seasonal values (sum of 56 152 m3/catchment/year) are approximately 13.4% lower than those predicted for the entire year (64 811 m3/catchment/year). This result does not match the derived annual production entirely, but it is a good approximation of its values. The greatest influence on this change is the vegetation cover or land cover. Because it was not possible to obtain Landsat images for all seasons in the same year, the use of land cover maps derived from such images is the largest contributor to the observed difference in the obtained values. Because the temperature and precipitation are averaged values representing a season but are still distributed proportionally within the year, they are considered to have a smaller impact on the difference in the derived values for soil loss in the catchment.
3.3. Model verification
3.3.1. Verification of the Landsat derived land cover map for the present time
The verification refers to the land cover map for the present time (1991–2020) and the summer season (August 2013). For each location (), GPS coordinates were noted, as was photographic documentation of the site and descriptive observation notes of the onsite and close surrounding vegetation cover. The observation was made in July 2016 to correspond to the same year period for which the land cover for the present time was made (August 2013). For each location, observation notes were compared in the ERDAS Imagine software to the land cover category derived from the Landsat data.
Figure 11. Observation points on the land cover representing the present time and the summer season from 6.8.2013.
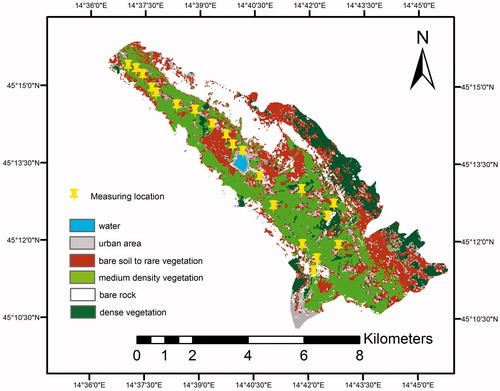
The observed vegetation cover on the chosen location corresponded well to those obtained with the Landsat 8 image land cover classification. On all surveyed locations, the vegetation cover or land cover corresponds to that obtained using ERDAS Imagine software and Landsat 8 images. Smaller errors were noted in five (5) locations when comparing the close surroundings of the locations. These errors refer to the replacement of smaller regions of urban areas with the bare rock category obtained with Landsat 8 in four (4) locations. In one (1) location, the urban area was derived from the Landsat images, whereas bare soil to rare vegetation areas were observed directly via the field survey.
3.3.2. Verification of the erosion coefficient map
According to Ypsilantis (Citation2011), the relative degree of erosion can be estimated by observing certain visual signs, such as gullies, flow paths and depositions; these monitoring methods can provide a qualitative assessment of erosion. This method of erosion monitoring has been used since the 1970s and provides relatively quick estimation of the erosion processes (erosion intensity) in the catchments; in addition, it enables multiple observations during one field survey and the identification of the potential erosion problems on the catchment. This method was used to observe the erosion processes representing erosion intensity in the catchment at 20 different locations (), for which GPS coordinates were noted, as were any visual signs of erosion processes, the presence of soil loss, gully formation or sediment deposition on the site or in the riverbed. The notes were then compared with the erosion coefficient values that define the erosion intensity categorisation for each chosen location.
Table 6. EPM and field survey erosion coefficient estimation on 20 different locations.
Very good results were obtained from the comparison of the field survey and the erosion coefficient obtained using the Gavrilović model for the present time series. Most of the observed points (eleven) correspond to very slight erosion, six points correspond to slight erosion and one point corresponds to each of medium, severe and excessive erosion.
In some points, the erosion coefficient was found to correspond to very slight to slight erosion, and some sediment yield was noted within the riverbeds. These sediments are the result of erosion processes in the upper part of the sub-catchments and not the location itself.
3.3.3. Investigation location – upper part of the Slani Potok sub-catchment – surface soil loss
The location that was selected for the verification of surface soil changes is located on the upper part of the Slani Potok sub-catchment ().
Figure 12. Chosen location for surface soil loss observations: (a) the location in the Dubračina catchment, (b) photograph of the location taken in June 2014, (c) photograph of the location taken in June 2015 and (d) photograph of the location taken in July 2016.
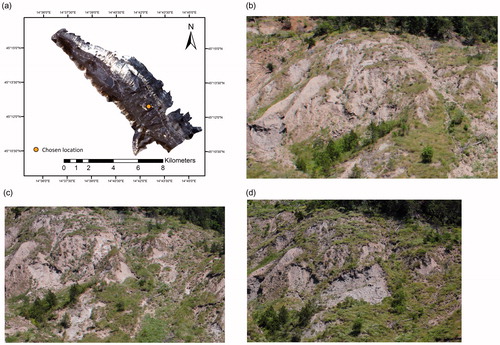
The location is characterised by excessive erosion processes (erosion coefficient values larger than 1.0), and it is the most exposed area to water erosion in the entire catchment. The annual soil loss production in this location, as estimated using the Gavrilović model, is 6620 m3/km2/year. The indication of the intensity of the erosion processes and the proportion of the change can be seen with only a visual comparison of the site presented in , with each photograph taken with a 1-year time delay, starting in June 2014 and ending in July 2016.
The change in the soil surface in noticeable by visual observation and reveals the two-year change in the area affected by excessive erosion in the Slani Potok sub-catchment, where the images were taken with a one-year delay. The changes between each year are significant, as seen in , and the soil surface change was substantial. On the image representing June 2014, the area observed is bare soil partially covered with vegetation, mainly grass and low shrubs. The image taken in June 2015 shows the one-year change in soil surface and cover; the area covered with bare soil has increased significantly, and the area covered with vegetation has decreased. In addition, the changes in soil surface and topography are evident, mostly in areas now covered only with bare soil. These changes are even more evident in the image taken in July 2016.
Note that this is only one small segment of the area affected by excessive erosion and is only the indication of the proportion of soil surface changes in this area. Also, the qualitative observations were conducted due to inability to conduct quantitative field measurements that could easily be compared with EPM model output total annual volume of the detached soil. In absence of quantitative measurements the visual observation were selected and provided only the indication that the model preforms according to the expectations.
4. Conclusion
The estimated values and maps derived by the EPM for Dubračina catchment presented in this article include outputs for the erosion coefficient (intensity), the total annual volume of the detached soil and the actual sediment yield for the past (1961–1990) and present time (1991–2020). The most noticeable spatial change in the erosion coefficient between the time series is located near the Slani Potok and Mala Dubračina sub-catchments, where the area affected by excessive erosion was found to increase from past to present. The overall decrease in the average values of the total annual volume of the detached soil is noted from the past (1564 m3/km2/year) to the present (1512 m3/km2/year) time; however, this change in values was not found to be significant, in contrast to the change observed in the spatial distribution visible on the maps.
The modification of the EPM was made to produce seasonal model outputs by changing three main model parameters: precipitation, soil protection coefficient and temperature. The greatest soil loss within the cycle of a year in Dubračina catchment was found to occur in autumn (19,902 m3/catchment/season), followed by summer (14,989 m3/catchment/season), spring (11,351 m3/catchment/season) and winter (9905 m3/catchment/season). The deviation between the annually derived values for the sediment production and overall production during the four-season time period was found to be approximately 13%. It can be concluded that the model based on modified EPM intended for the seasonal soil erosion assessment provides a good approximation of soil erosion and can be used for future research.
The model output erosion intensity, land cover map for the present and the summer and the soil surface change were verified using a visual survey monitoring method and a GPS device. All verifications revealed good results, and the high accuracy of the derived maps was confirmed. The research presented in this article has shown that the EPM model works well and can differentiate areas highly susceptible to erosion form those less so. However, for more specific and accurate analysis on model performance estimating the amount of soil loss, quantitative measurements are needed.
Acknowledgments
This research was based on the work conducted within the following projects: Croatian-Japanese project ‘Risk identification and Land-Use Planning for Disaster Mitigation of Landslides and Floods in Croatia’, ‘Hydrology of Sensitive Water Resources in Karst’ (114-0982709-2549) financed by the Ministry of Science, Education and Sports of the Republic of Croatia and Hydrology of water resources and risk identification of flooding and mudflows in the karst areas (13.05.1.1.03.) and Soil Management in Karstic, Sensitive and Protected Areas (13.05.1.3.08) both financed by University of Rijeka.
Disclosure statement
No potential conflict of interest was reported by the authors.
Additional information
Funding
References
- Al-Bakri JT, Brown L, Gedalof Z, Berg A, Nickling W, Khresat S, Salahat M, Saoub H. 2016. Modelling desertification risk in the north-west of Jordan using geospatial and remote sensing techniques. Geomat Nat Haz Risk. 7(2):531–549. doi: 10.1080/19475705.2014.945102
- Alam M, Hussain RR, Islam ABMS. 2016. Impact assessment of rainfall vegetation on sedimentation and predicting erosion-prone region by GIS and RS. Geomat Nat Haz Risk. 7(2):667–679.
- Cerdà A. 2002. The effect of season and parent material on water erosion on highly eroded soils in eastern Spain. J Arid Environ. 52:319–337.
- Cilek A, Berberoglu S, Kirkby M, Irvine B, Donmez C, Erdogan MA. 2015. Erosion modelling in a Mediterranean subcatchment under climate change scenarios using Pan-European Soil Erosion Risk Assessment (PESERA). The International Archives of the Photogrammetry, Remote Sensing and Spatial Information Sciences XL-7/W3. Proceedings of the 36th International Symposium on Remote Sensing of Environment; May 11–15; Berlin, Germany. p. 359–365. doi: 10.5194/isprsarchives-XL-7-W3-359-2015
- Coote DR, Malcolm-McGovern CA, Wall GJ, Dickinson WT, Rudra RP. 1987. Seasonal variation of erodibility indices based on shear strength and aggregate stability in some Ontario soils. Can J Soil Sci. 68:405–416.
- de Vente J, Poesen J. 2005. Predicting soil erosion and sediment yield at the basin scale: scale issues and semi-quantitative models. Earth Sci Rev. 71(1–2):95–125.
- Dragičević N, Karleuša B, Ožanić N. 2016. A review of the Gavrilović method (Erosion Potential Method) application. Građevinar. 68(9):715–725.
- Dragičević N, Karleuša B, Ožanić N. 2017. Erosion Potential Method (Gavrilović Method) sensitivity analysis. Soil Water Res. 12:51–59.
- Gallart F, Llorens P, Latron J, Regüés D. 2002. Hydrological processes and their seasonal controls in a small Mediterranean mountain catchment in the Pyrenees. Hydrol Earth Syst Sci. 6(3):527–537. doi: 10.5194/hess-6-527-2002
- Gavrilović S. 1972. Inženjering o bujičnim tokovima i eroziji. Izgradnja (special issue), PPT, Beograd.
- Gavrilović Z, Stefanovic M, Milovanovic I, Cotric J, Milojevic M. 2008. Torrent classification-base of rational management of erosive regions. OP Conference Series: earth and environmental Science 2008. Proceedings of the 24th Conference of the Danubian countries on the hydrological forecasting and hydrological bases of water management; June 2–4; Bled. IOPscience. p. 1–8.
- Haghizadeh A, Teang Shui L, Godarzi E. 2009. Forecasting sediment with erosion potential method with emphasis on Land use changes at basin, electronic. J Geotech Eng. 14:1–12.
- Khosrokhani M, Pradhan B. 2014. Spatio-temporal assessment of soil erosion at Kuala Lumpur metropolitan city using remote sensing data and GIS. Geomat Nat Haz Risk. 5(3):252–270. doi: 10.1080/19475705.2013.794164
- Kosmas C, Danalatos N, Cammeraat LH, Chabart M, Diamantopoulos J, Farand R, Gutierrez L, Jacob A, Marques H, Martinez-Fernandez J, et al. 1997. The effect of land use on runoff and soil erosion rates under Mediterranean conditions. CATENA. 29:45–59.
- Kwaad FJPM. 1991. Summer and winter regimes of runoff generation and soil erosion on cultivated loess soils (the Netherlands). Earth Surf Process Landf. 16:653–662. doi: 10.1002/esp.3290160709
- Megnounif A, Terfous A, Ghenaim AM, Poulet JB. 2007. Key processes influencing erosion and sediment transport in a semi-arid Mediterranean area: the Upper Tafna catchment, Algeria. Hydrol Sci J. 52(6):1271–1284. doi: 10.1623/hysj.52.6.1271
- Merritt WS, Letcher RA, Jakeman AJ. 2003. A review of erosion and sediment transport models. Environ Model Softw. 18:761–799. doi: 10.1016/S1364-8152(03)00078-1
- Millward AA, Mersey JE. 1999. Adapting the RUSLE to model soil erosion potential in a mountainous tropical watershed. CATENA. 38:109–129. doi: 10.1016/S0341-8162(99)00067-3
- Morgan RP. 2005. Soil erosion & conservation. Oxford: Blackweel Science.
- Paiboonvorachat C, Oyana TJ. 2011. Land-cover changes and potential impacts on soil erosion in the Nan watershed Thailand. Int J Remote Sens. 32(21):6587–6609. doi: 10.1080/01431161.2010.512935
- Rudra RP, Dickinson WT, Clark DJ, Wall GJ. 1986. GAMES – a screening model of soil erosion and fluvial sedimentation on agricultural watershed. Can Water Resour J. 11(4):58–71. doi: 10.4296/cwrj1104058
- Šurda P, Šimonides I, Antal J. 2007. A determination of area of potential erosion by geographic information systems. J Environ Eng Landsc Manag. 15(3):144–152. doi: 10.1080/16486897.2007.9636922
- Thiemann SD. 2006. Detection and assessment of erosion and soil erosion risk in the watershed of the Bilate River-Southern Ethiopian Rifft Valley [dissertation]. Berlin: Freie University Berlin, Institute for Geographic Sciences.
- Toy TJ, Foster GR, Renard KG. 2002. Soil erosion: processes, prediction, measurement and control. New York: Wiley.
- Ypsilantis WG. 2011. Upland soil erosion monitoring and assessment: an overview. Tech Note 438. Denver: Bureau of Land Management, National Operations Center.