
 ?Mathematical formulae have been encoded as MathML and are displayed in this HTML version using MathJax in order to improve their display. Uncheck the box to turn MathJax off. This feature requires Javascript. Click on a formula to zoom.
Abstract
Floods cause catastrophic destruction to life and livelihood in South Asia than any other parts of the world. This research assessed long term (2001 to 2015) flood risk at South Asia level using eight-day Moderate Resolution Imaging Spectroradiometer data and subsequently expanded this methodology to identify potential zones for piloting flood index insurance scheme in Bihar, India. Bihar was further assessed for sub-regional segmentation of its 37 districts into four flood risk zones based on k-means clustering and Getis-Ord Gi* analysis of multi-modal dataset consisting of demographics, meteorological, agricultural, flood characteristics and economic loss from floods. Satellite based risk assessment identified parts of Indus basin in Pakistan, Ganges basin in North India and majority of Bangladesh as flood hotspots. Site prioritization for flood index insurance in Bihar identified Madhubani, Darbhanga, Muzaffarpur and Sitamarhi districts as very high flood risk districts by both methods signifying large impact of any potential interventions implemented in these districts.
1. Introduction
Floods affect more population than any other weather-related peril. Floods accounts for 47% of natural disasters occurred during the period 1995–2015 affecting 2.3 billion people worldwide and causing total economic loss of $662 billion (UNISDR and CRED Citation2015). Globally 800 million people live in flood prone area with an average annual exposure of 70 million (UNISDR Citation2011). Rising populations, socio-economic development in flood prone areas and climate change will make 2 billion people vulnerable to flood disasters annually by 2050 (UNU Citation2004). Top 15 countries ranked on number of people affected by river flooding accounted for nearly 80 percent of the total population affected every year. Top flood prone counties lie in South Asia, where largest exposed population to flood risk currently resides (World Bank Citation2015).
In South Asian countries, floods affected more than 1 billion people in past 20 years (EMDAT 2015). India has 0.8% of its $1.87 trillion GDP exposed to flood risk and could increase more than 10-fold by 2030 (WRI Citation2015). The summary of catastrophic flood events in the South Asian countries between 2004 and 2016 along with the economic losses and insurance payouts are provided in . Global climate change is likely to increase frequency and severity of flooding in South Asia (Turner and Annamalai Citation2012; IPCC Citation2014) threatening agricultural production and increase uncertainty for small-scale farmers whose livelihoods serve the rural economy in these regions necessitating an integrated approach to overall risk reduction. Structural measures to confine floodwater within pre-designated area are the most common mitigation strategies implemented in South Asia to reduce damages. However, the scale and magnitude of flood risk in South Asia necessitates coherence in strategies combining investments in structural measure along with non-structural interventions to build resilience of vulnerable communities. The integrated flood risk management strategies consisting of both structural and non-structural measures need to based on long-term flood risk assessment at multiple scales integrating cause–effect factors of flood events.
Table 1. Major flood events, human and economic damages in South Asia (2005–2016).
Application of free satellite data sources for flood mapping applications have become imperative process as a part of disaster risk management. Possessing wide spatio-temporal coverage, spectral band indices such as Normalized Difference Water Index (NDWI) (McFeeters Citation1996) and the Land Surface Water Index (LSWI) (Xiao et al. Citation2004) derived from Moderate Resolution Imaging Spectroradiometer (MODIS) provide long-term coverage of flood pattern suitable for identifying hotspots. Increased availability of satellite data and tools for flood risk monitoring used to derive long-term flood patterns (Amarnath et al. Citation2017). When the satellite derived spatio-temporally dense flood maps are integrated with data from secondary sources on historical flood impacts, it is possible to classify regions into flood zones with homogeneous characteristics of different risk level.
Regionalization of flood risk area involves spatial association of criteria/factors to identify homogeneity in a multidimensional space (Booij Citation2005; Minea Citation2013; Xu et al. Citation2013). However, representation of multiple dimensions of vulnerability in the dataset complicates quantifying of relative impact of these factors through single scorecard (Rogelis et al. Citation2016). Often multi-criteria decision analysis methods are employed to analyse an integrated dataset representing various bio-physical and socio-economic factors to an optimal decision (Hwang and Lin Citation1987; Ghanbarpour et al. Citation2013). Chavoshi et al. (2012) and Rahmati et al. (Citation2016) listed several multi-criteria decision analysis methods previously used for regionalization of flood risk area. Cluster analysis is a one such approach where homogeneous groups of regions are created based on a multidimensional space of various factors/criteria characteristics relating to flood response (Tasker Citation1982; Bhaskar and O’Connor Citation1989). Several studies on clustering techniques to identify flood risk zones with associated biophysical and socioeconomic variables namely K-means for regional flood frequency analysis in Central India (Burn and Goel Citation2000); comparison of hierarchical and Non-Hierarchical Clustering, k-means, Fuzzy C-Means and Kohonen methods to delineate hydrologic homogenous regions in Caspian Sea Watersheds (Chavoshi et al. 2012) and natural breaks classification (Jenks), k-means, fuzzy c-mean and gaussian mixture model for potential flood prone areas mapping (Papaioannou et al. Citation2015) in Xerias River watershed, Greece. The selection of appropriate clustering method for delineating homogenous flood vulnerable regions targeting index insurance depends on availability of site-specific dataset covering wide range of factors. Although studies advocate regionalization of flood zones based on hydrographic boundaries, it is seldom possible in regions like South Asia due to data availability at administrative levels and restriction on data sharing mechanism in transboundary basins. In addition, selecting administrative units as the basis for regionalization of flood risk area enables authorities to decide resource allocation such as subsidies for insurance premium (Sanyal and Lu Citation2006).
International Water Management Institute (IWMI) is leading a project to design and pilot meso-scale index insurance in flood prone regions for vulnerable agricultural communities in two countries, India and Bangladesh. As such, no precedence or methodology exist in South Asia or other parts of developing world to identify homogenous flood risk regions based on multidimensional space specifically collated for piloting flood index insurance purposes. In response to the knowledge gap, this research study was undertaken to assess a comprehensive methodology for regionalization of flood risk zones and subsequent site prioritization among administrative units through application of two clustering techniques namely k-means and Getis-Ord Gi* on multi-component dataset from different sources (1985–2015). This study assessed flood risk at South Asia level using long term (2001–2016) MODIS satellite based data to delineate regional flood hotspots and subsequently applied two statistical approaches (K-means cluster and Getis-Ord Gi*) to prioritize districts in one of the identified flood hotspot – Bihar, India into risk categories for piloting flood index insurance. The prioritization approach applied in this study is directly transferable to other states or sub-national areas in other countries for prioritizing flood risk zones to pilot flood specific agricultural insurance schemes. The outputs will aid to scale-up the flood specific insurance products from proposed pilot area to other locations in Bihar associated with different risk factors.
2. Study area
Monsoonal climate, large rural population and dense agricultural activities in flood plains affected by extreme flood events inflicting huge human and economic losses dominate most of the South Asian countries. Bihar is an Indian state bounded by Himalayan foothills and terai region of Nepal in the north and alluvial rich Indo-Gangetic plains in the remaining direction between 24°20′10″ N to 27°31′15″ N and 83°19′50″ E to 88°17′40″ (). The rainfall is dominated by south-west monsoon (June–September) which contributes 80% to 90% of the total rainfall received. provides a synoptic view of socio-hydrological indicators for Bihar. During the monsoon season, river flows increases up to 50 times of summer flows causing devastating floods. Average daily temperatures vary from 38 °C in summer to 8 °C in winter. In Bihar, 28 out of 38 districts are considered flood prone (of which 15 districts are worst affected) causing huge loss of property, lives, farmlands and infrastructure. As such, 73.63% of the geographical area of Bihar is considered to be prone to floods. Agriculture is the backbone of Bihar's economy covering 70% of its geographical area, employing 76% of workforce and generating nearly 42% of the Gross Domestic Product. Principal food crops are paddy, wheat, maize and pulses (DoA Citation2015). During the 2008 Kosi floods, over 1416 km2 of paddy, 72 km2of maize and 971 km2of other crops were adversely affected, with affected population of 500,000.
Figure 1. Location map of Bihar state, India with district boundaries and the major river networks.
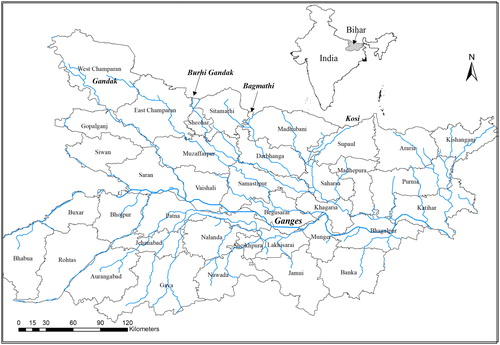
Table 2. Bihar – Key indicators.
3. Materials and methods
3.1. Primary and secondary data sources
A composite time series dataset describing cause and effects of floods in Bihar was aggregated at district level. This dataset contains factors influencing occurrence of floods such as rainfall, impacts from floods such as inundated extent, specific impacts on agriculture such as crop affected area and after effects of floods such as human and economic damages. Most these dataset are time series data covering the period 1991–2013 sourced from multitude of sources. Name of the variable, time period of availability and its data source is shown in . In total, 23 variables corresponding to 37 districts were aggregated in the master dataset for further analysis.
Table 3. Variables included in delineating of flood risk zones.
3.2. Methodology
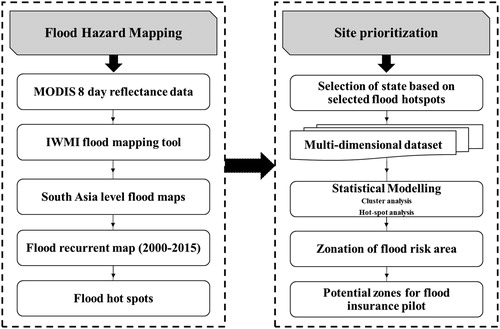
A comprehensive methodology for the entire process from data collection to assessment using cluster analysis to identify inherent similarity among flood risk in the districts is presented in . The methodology involves utilizing 15 years of MODIS eight-day surface reflectance data between 2000 and 2015 for mapping flood inundation extent for South Asia. Upon creating a flood frequency map from the long-term MODIS data, the geographic focus of the study was further pruned to Bihar for prioritizing the districts. The followed in regionalization of flood risk area in Bihar is summarized in . Two flood risk regionalization methods (i) cluster and (ii) hot spot analysis methods were used to group districts in Bihar into four risk zones. These two approaches were primarily selected for ease of application along with the intention to transfer for other basins by other stakeholders in the future. From the result of flood risk zonation, a district with large potential and impact was selected for piloting a flood index insurance scheme.
Figure 2. Research methodology for regionalization and prioritization of flood risk areas for index insurance product development.
3.2.1. Flood hazard mapping
IWMI flood mapping tool (Amarnath Citation2014; Amarnath and Rajah Citation2016) was used to extract the inundated water pixels from MODIS (MOD09A1) eight-day composite surface reflectance product with 500 m spatial resolution. IWMI flood mapping tool is based on the method employed by Xiao et al. (Citation2005) for mapping paddy fields using inundation. In total, 645 8-day composite surface reflectance scenes covering from 2000 to 2015 were downloaded for flood inundation mapping to discriminate water-related pixels and non-flood pixels. The flood mapping algorithm uses land-water indices consisting of Enhanced Vegetation Index (EVI), Land Surface Water Index (LSWI) and DVEL representing difference between EVI and LSWI were computed for every 8-day composite.
(1)
(1)
Where, is the reflectance of near infrared (841–875 nm, band 2),
is the reflectance of red band (621–670 nm, band 1),
is the reflectance of blue band (459–479 nm, band 3),
is the reflectance of short-wave infrared (1628–1652 nm, band 6).
(2)
(2)
Where, G is a gain factor, L is a canopy background adjustment factor, C1 and C2 are coefficient of the aerosol resistance term. The parameters for the EVI calculation has define as G = 2.5, L = 1, C1 = 6 and C2 = 7.5
(3)
(3)
Based on the above indices calculated by IWMI’s flood mapping algorithm, a pixel is deemed to represent water when EVI values is less than or equal to 0.05 and the LSWI value less than or equal to 0 or pixels which have the EVI values less than or equal to 0.3 and DVEL values less than or equal to 0.05. Time series of flood inundation maps developed based on the above method for the period 2001 to 2015 were aggregated to derive annual flood extent.
3.2.2. District prioritization approach
Two statistical methods (1) k-means clustering and (2) Hotspot analysis (Getis and Ord Citation1992) were used for evaluate the site prioritized map of districts in Bihar.
K-mean clustering: The k-means is an unsupervised clustering method which divides the dataset into a pre-determined number of clusters by iteratively minimizing square error criterion expressing the distances between the data points and prototypical elements of a cluster (Hartigan and Wong Citation1979). The steps involved in kmeans method to derive the flood risk zones consist of Decide on ‘k’ number of clusters representing number of flood risk zones
Selection of random ‘k’ cluster centres
Estimation of the distance of each district to the k cluster centres, and transfer district to nearest clusters based on the distance to the cluster centre
Calculate mean of districts within each cluster and assign k cluster centres to the mean of their cluster.
Reassign districts closest to the new cluster centre
The above two steps are repeated until convergence of the objective function defined below to a minimum. It is defined as
(4)
(4)
where, k – number of clusters; x – district used in the classification; and ci is the centre of cluster i that belongs to cluster Ci.
Silhouette coefficient was used to estimate cluster quality (Everitt et al. Citation2011). Silhouette coefficient represents the optimum number of clusters which signifies homogeneity within the specified group.
(5)
(5)
where ai – s the average distance of object i to all other objects in its cluster; for object i and any cluster not containing it, calculate the average distance of the object to all the objects in the given cluster and bi – the minimum such value with respect to all clusters.
Optimum number of clusters for the data were determined based on the largest magnitude of average silhouette coefficient for different number of clusters for the given dataset. By selecting the number of clusters containing largest average silhouette coefficient, the samples within the cluster were considered to be homogenous and samples between different clusters represent heterogeneity. This will enable to assign appropriate risk classes to the derived number of clusters.
Hot Spot analysis (Getis-Ord Gi* statistic): The second method for flood hazard mapping involves two step process, hotspot analysis with Getis-Ord Gi* statistics followed by weighted overlay analysis. The Hot Spot Analysis tool in available in ArcMap 10.1 was used to calculate the Getis-Ord Gi* statistic for each variable in a composite dataset. Two statistical metrics z-score and p-value which are associated with standard normal distribution to describe whether features with either high or low values cluster spatially. The Gi* statistic returned for each feature in the dataset is a z-score. Smaller p-values indicates that corresponding data is very unlike to have a spatial pattern whereas the higher p-values represent larger contribution for the spatial pattern from the given parameter. To be a statistically significant hot spot (district in this case), a feature will have a high value and be surrounded by other features with high values as well.
(6)
(6)
(7)
(7)
(8)
(8)
Where G* statics of z-score, xj is the attribute value for feature j, wi,j is the spatial weight between feature i and j, n is equal to the total number of features. and S are the mean and standard deviation of the feature.
Only z-values were considered for the preparation of annual indicator map. Based on selection criteria given in , three distinct ranks were assigned to districts indicating similarity or variations for a particular variable from z-score. This process is repeated for all the variables listed in to derive z-score based rank for each of 37 districts. Aggregated rank value for each variable was derived from sum of individual yearly rank scores of the variable. The aggregated rank were further classified in four flood risk zones such as low, moderate, high and Very high.
Table 4. Ranking criteria for zonation of districts for flood risk regionalization based on z-score.
3.2.3. Data harmonization and processing
Since significant portion of data were collated from secondary sources, each of the variables in composite dataset were evaluated for outliers to identify observations which are deemed unlikely based on comparison with maximum, minimum, mean, standard deviation and knowledge of realistically possible values. In particular, variables in ‘Flood Affected Area’ displayed significant anomalies upon employing outlier detection methods. A comparison was made between flood affected area and geographical extent of the districts to determine unrealistic values. The analysis revealed two years 1997 and 1999 where the values of three variables in flood affected area for 37 districts were found to be unreliable along with sporadic values in other time periods. These data were excluded from further analysis since large magnitude of variables tend to skew grouping patterns of districts in statistical analysis.
The corrected multi-variable district wise data consists of different units with absolute value ranging from zero to tens of thousands. Dataset were normalized using Equation (14) to standardize the existing range of independent variables in different uinits present in master dataset.
(9)
(9)
Where X′ – normalized value of the variable, X – Actual value of the variable, XSD – Standard Deviation value of the variable range.
4. Results and Discussion
4.1. Spatio-temporal flood hazard analysis
The spatial extent of inundation from four major flood events (2004, 2007, 2008 and 2010) located geographically across South Asia can be visualized and assessed from maps based on MODIS/TERRA data shown in . The magnitude of flood hazard from these individual major flood events can be deduced from the impact across large swaths of area often extending across administrative boundaries between the South Asian countries. The weekly flood inundation maps were aggregated into monthly and annual flood inundation map to derive frequency of flooding in each pixel across South Asia for the period of 15 years to produce flood recurrent map (). The flood recurrent map of South Asia show three main hotspots located in Indus basin – Pakistan [], Ganges basin – east India [], and Brahmaputra basin - Bangladesh [] respectively. These flood hotspots registered frequent occurrence of flood events within the 15 year mapping period. High population density and intense agricultural activities in these regions coupled with flood hazard increases the vulnerability of the inhabitants.
Figure 3. Mapping spatial distribution of major flood events in South Asia (a) 2004 Bangladesh flood; (b) 2007 Ganges flood in North India; (c) 2008 Kosi flood in Bihar, India and (d) 2010 Indus flood in Pakistan.
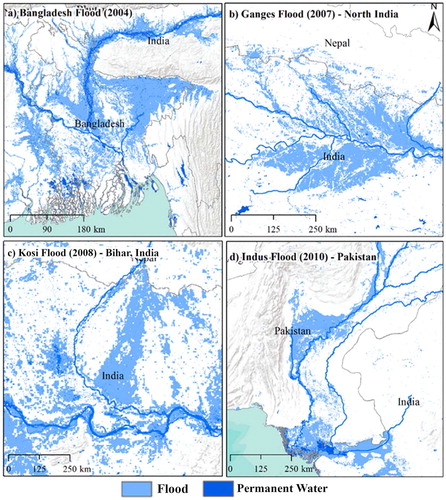
Figure 4. Flood recurrent map of South Asia (2000 to 2015) and major flood hotspots in Pakistan (A); Bihar, India (B) and Bangladesh (C).
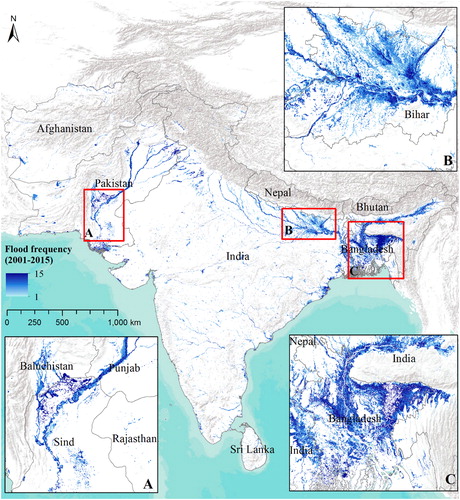
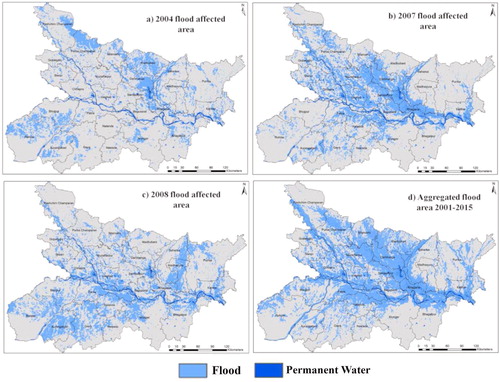
The flood hotspot in lower reaches of Ganges basin [] lies in the state of Bihar, India was selected for regionalization of flood risk area based on district boundaries. Nearly 46% of India’s flood prone area lies within ten states, of which 35% of area lies within top two states namely Uttar Pradesh and Bihar. The magnitude of flood hazard in Bihar can be deduced from the fact that total geographical area of Uttar Pradesh is 2.5 times more than Bihar (94,163 km2) but both witness similar annual average flood prone area (∼7 million ha). Bihar is the most flood prone state in India with 55% of its geographical area affected by frequent flooding []. Assam, a relatively smaller state in North East India follows Bihar with 50% geographical area prone to flooding albeit followed by its larger neighbouring states West Bengal and Uttar Pradesh with 37 and 32% respectively. The flood hazard areas based on 15 years of MODIS flood maps along with three major flood events in 2004, 2007 and 2008 are shown in . Bihar is divided into North and South Bihar with the demarcation being River Ganges which cut across the state into two halves. The MODIS flood hazard maps reiterates that Norths is at high risk of recurrent flood event compared to South Bihar, with the farmer being fed by upstream heavy rainfall in Nepal Himalayas []. In some years such as 2008 and recent 2016 flooding, South Bihar was more affected than the North because of heavy rainfall in catchment areas of small rivers flowing in the Southern part []. Still the risk to South Bihar is significantly lower compared to North Bihar which is evident in the aggregated flood maps []
Figure 5. Mapping flood prone areas in Bihar using MODIS data for major flood events in (a) 2004, (b) 2007, (c) 2008 and (d) recurrent flood extent between 2001 and 2015.
4.2. Validation of flood risk mapping
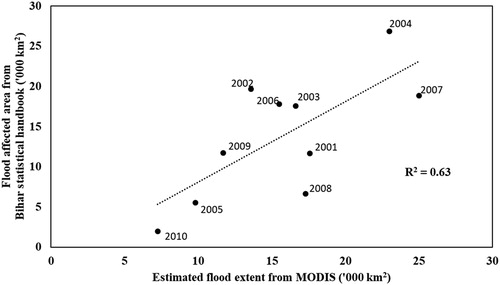
The yearly aggregated estimate of flood extents from MODIS was compared with official estimates published by Bihar government in its statistical handbook (DES and DPD Citation2012) for a period of ten years from 2001 to 2010. This yielded a reasonable correlation of 0.63 (). Spatio-temporal flood maps indicate that, on an average 15,000 km2 of Bihar’s geographical area was flooded every year with minimum of 7200 km2 in 2010 and 25,000 km2 in 2007. While there are appreciable difference between MODIS and Bihar statistical handbook estimates of flood affected area particularly in 2002 and 2008, it must be noted that these official estimates are based on aggregated reports from relevant administrative authorities on the ground before satellite based assessment were mooted by Flood Management Information Center (FMISC), Bihar. The quantified dense spatio-temporal flood parameters from MODIS/Terra based mapping are similar to the governmental estimates (FMISC Citation2016). Subsequently, the flood frequency and inundated area used for regionalization of flood risk area in Bihar.
Figure 6. Estimated flood extent from MODIS compared with Bihar statistical handbook areal flood extent.
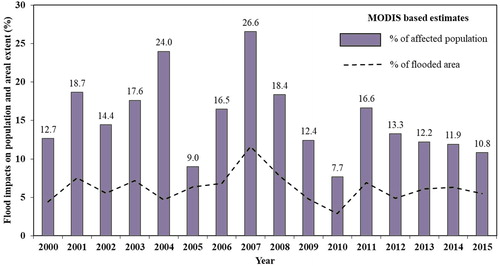
By overlaying the gridded population data onto the yearly flood maps derived from MODIS, flood affected population were quantified (). On an average 6 million people were affected by flooding each year, highest being 11 million people from catastrophic 2007 flooding. There exists strong correlation (0.88) between flood affected area and percentage of population affected by flood events. However unlike the affected population estimates based on gridded secondary data, no such direct relations were possible due to absence of similar dataset for crop loss. However, comparison between MODIS flood extent and crop loss information from DES and DPD (Citation2012), indicate that for similar flood affected area between 15,000 and 18,000 km2, crop loss estimates could vary widely between 0.5 and 40 million USD. The flood extent for the years 2001 and 2003 being nearly the same, observed crop loss witnessed twofold increase. This indicate that the relation between flood extent doesn’t necessarily translate into expected crop loss, rather the timing of occurrence play a larger role in determining the extent of economic loss from agricultural activities. Abovementioned findings have larger bearing on the provision of insurance and affordability of the premium. By offering insurance only for predominant crop growing season which coincides with monsoonal flood events, the premium will be affordable for smallholders in conjunction with government subsidy while being viable for insurance industry.
Figure 7. Estimated percentage of yearly flood extent from MODIS and corresponding percentage of affected population in Bihar.
4.3. Flood risk regionalization of Bihar districts
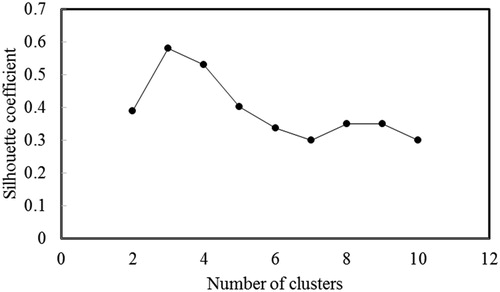
K-means clustering were performed on the normalized dataset. Number of clusters to classify the dataset ranged from two to 10 to determine optimum number of clusters at which districts within individual cluster be similar and different from the districts in other cluster. Average silhouette coefficient for corresponding cluster numbers 2–10 are shown in . The average silhouette coefficient is largest (0.58) when number of clusters are equal to 3. However, the difference in average silhouette coefficient between cluster numbers 3 and 4 are minimal (0.05). Thus, the homogeneity of districts within individual cluster can be effectively categorized in both the cluster numbers (3 and 4). So it was decided to use four number of clusters to delineate 37 districts in Bihar into four risk zones: low, moderate, high and very high.
Figure 8. Number of clusters and corresponding average silhouette coefficient.
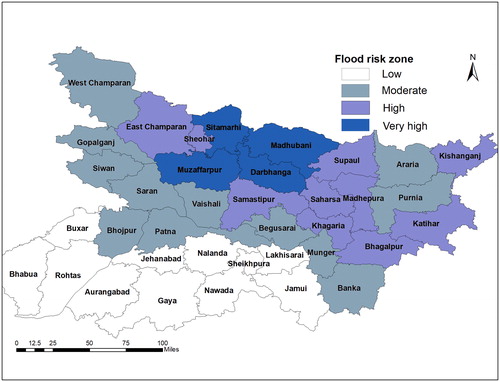
Zones delineated from kmeans consists of 12 districts in Zone 1 and Zone 2, four districts in Zone 3 and eight districts in Zone 4. Out of four risk zones, three zones (1, 3 and 4) consists entirely of districts which are in geographical proximity to each other and located in three distinct river basins. Zone 1 consists of districts in South Bihar away from the Ganges River, districts adjoining main channel of river Ganges comprises Zone 2, South flowing rivers of Kosi basin forms Zone 3 and districts containing tributaries of Ganges flowing from mountainous Nepal regions in North Bihar forms Zone 4 (River Burhi Gandak, Bagmathi etc.). Three districts Kathihar, Sheohar and West Champaran grouped in Zone 2 were further assessed due to geographical discontinuity with rest of the districts within the same cluster.
Sheohar is the smallest district in Bihar in terms of geographical area (350 km2) and are much smaller than average geographical area of remaining districts in the same cluster due to which it is excluded from evaluation. Katihar and West Champaran districts were further evaluated to assess whether the districts has to be reassigned to other Zones. Two variables, monthly inundated area and total flood affected area were used for evaluation of the zones to which these two districts were assigned. The absolute value of two variables, monthly inundated area and total flood affected area for West Champaran was compared with its corresponding values of geographically adjacent neighbour East Champaran, which belongs to Zone 4. While monthly inundated area for these two districts along the time period shows similar peaks and trends, there exist substantial variation in yearly flood affected area between these two districts. So the physical risk from flooding in these two districts are inherently different which corresponds with the assignment to different zones although geographically connected.
Using normalized dataset, mean value for each district encompassing all the variables were calculated and clustered according to the initial zonation results. Most of the Normalized mean values of districts in Zone 1 are within 0.4–0.5 with a cluster-wise average of 0.5 being lowest among four zones. No noticeable trends in district wise normalized mean values in remaining three zones. However when cluster-wise average is calculated for the remaining three zones, significant differences in the final value of Zone 2, and 4 are noticeable. The normalized mean value for the initial clustering output indicates insignificant difference between cluster 2 (0.62) and cluster 3 (0.64) signifying the existence of districts which can be interchanged between the two clusters. However, after the evaluation and subsequent movement of Katihar to Zone 3 substantial difference is observed in the normalized mean values. Higher normalized mean values of the cluster indicate overall large absolute values present in the integrated dataset denoting probability of higher risk faced by the clustered districts. The final flood risk zonation based on the evaluation and refinement is shown in .
Figure 9. Final zonation of 37 districts into four risk zones based on k-means cluster.
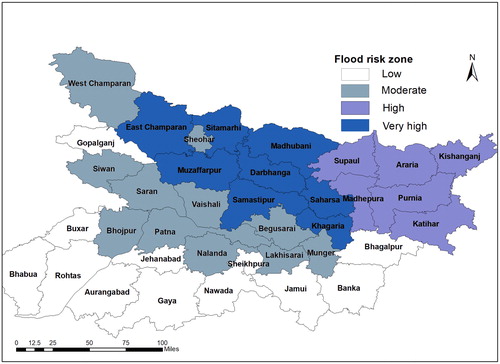
Getis–Ord Gi* spatial statistical analysis was applied to individual variables in to categorize zones among Bihar districts. Rainfall distribution across districts indicates that there exists high variability even within the districts of North Bihar. North-east and North-West districts of Bihar witness high to very high rainfall along with Muzaffarpur while the central districts of Darbhanga, Samastipur and Vaishali receive moderate rainfall similar to their counterparts in South Bihar. The spatial patterns in rainfall does not corresponds completely with spatial patterns in observed flood inundation grouping. Maximum flood inundation hotspots lie in five districts of Darbhanga, Muzaffarpur, Samastipur, Vaishali and Saharsa which are located in North-Central portions of Bihar state. Flat slope, presence of dense network of river channels and significant rainfall contribution from upstream Himalayan regions transformed these five districts into high risk category. Five districts from North and North-east Bihar located on the foothills of Himalayas along with Muzaffarpur, Darbhanga and Saharsa suffered heavy damages to houses and villages. Ten districts were clustered into very high economic loss category mainly from North Bihar while four districts in North-Eastern part suffered moderate to high economic loss. Three districts Muzaffarpur, Darbhanga and Sitamarhi consistently recorded large agricultural damage and large number of population at risk due to flooding. The final risk zonation map indicates that four districts Muzaffarpur, Darbanga, Sitamarhi and Madubhani are considered to be high risk by Getis-Ord Gi* method (). As expected, none of the districts in South Bihar can be deemed as high risk category. Districts of Ganges are deemed as moderate risks along with Araria and Purnia districts in North Bihar.
Figure 10. Final risk zonation of districts based on Getis-Ord Gi*analysis.
4.4. Comparison of the k-means and Getis-Ord Gi* for flood risk regionalization
Comparison of flood hazard zones derived from the two applied statistical methods are shown in . Of 37 districts classified into four flood risk zones, 25 districts corresponds to the same risk classes in both k-means and Getis-Ord Gi*analysis. Both methods delineated nine common districts in low risk category, eight districts in moderate category, and four districts in high and very high risk categories (). Both exploratory methods performed well in delineating, low and moderate risk classes (with 90% accuracy) while deviated slightly (50–60% common districts) in grouping high and very risk category districts. K-means clustered eight districts in high risk category while Getis-Ord Gi* demarcated only four districts. East Champaran, Khagaria, Samastipur and Saharasa grouped in very high risk category by k-means method is classified into moderate risk zone by Getis-Ord Gi*. Most often the districts which were not in agreement in both methods are classified to nearest risk category. In spite of differences in final outcomes of risk categories, 68% of districts were grouped under same classes in both methods. Except for two or three districts, final regionalization maps from both methods indicate strong influence of geographical proximity in deciding the individual group homogeneity which is in contrary to the watershed based regionalization results by Chavosi et al. (2012) where geographical closeness did not influence cluster homogeneity.
Figure 11. Number of districts within four flood risk zones identified from k-means, Getis-Ord Gi* and districts in same risk category in both methods.
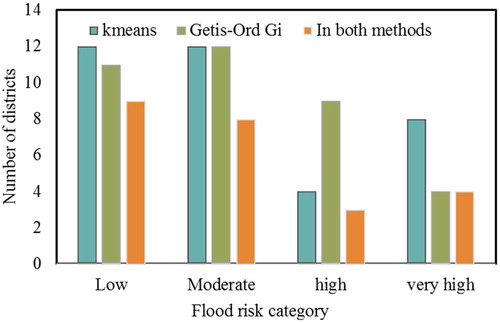
Table 5. Comparison of district Zonation outputs from k-means clustering and Getis-Ord Gi* analysis.
Regionalization of flood risk area using k-means and Getis-Ord Gi* integrated predominantly public domain datasets available from the government publications and repositories. Most of the Indian states publishes annual statistical abstract which contains detailed data on disaster impacts. The results from regionalization will allow prioritization of resources at regional level (district) where further local level assessments can be focussed for planning of mitigation measures, emergency planning and vulnerability reduction (Kappes et al. Citation2012). Regionalization using k-mean clustering contains low influence of subjective weights, thus avoiding the large variations influenced by expert’s perspective (Müller et al. Citation2011). Application of k-means and Getis-Ord Gi* enabled to reiterate and confirm risk category of 70% of the districts within the study domain emphasizing the use of multiple statistical techniques to perform flood risk regionalization (Papaioannou et al. Citation2015) and such prioritization based on only thematic layers can be dependable to maximum extent (Chowdary et al. Citation2013).
4.5. Making a case for flood insurance in Bihar
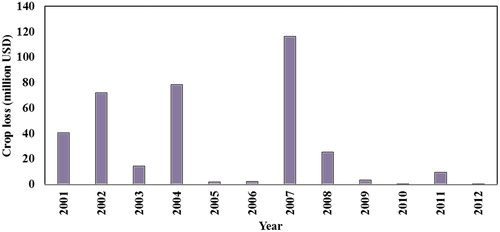
Floods caused 324USD million worth of crop damages (2000–2012) to the agricultural sector in Bihar which contributes 18.9% of Gross State Domestic Product but employs 78% of the total population which is much higher than the national average (Reference). Even during the relatively dry years of 2005–2006 and 2009–2012, 3 million USD worth of average crop damage occurred due to minor flood events (). These flood induced losses poses huge financial burden on the 33 million people who depend on agriculture sector and living below the poverty line of 2 USD per day (DoA Citation2015). Total economic loss due to flood induced crop damage for districts located in very high and high zonation category during 2001–2012 is estimated as $231 million and $64 million respectively (DES and DPD Citation2012). This financial loss estimate is a conservative figure since not all the losses in these region are properly documented owing to lack of proper monitoring and reporting mechanism.
Figure 12. Financial loss from crop damage due to floods for the period 2001–2012.
Report of Task Force on agriculture estimated 43 billion USD of financial requirement from 2015 to 2022 for development of all aspects of agriculture in Bihar (Niti Ayog Citation2015). Disaster management activities related to agriculture alone is earmarked for 1.6 billion USD from total financial outlay within this period. However, majority of this 1.6 billion USD is envisaged to be used as relief fund and input subsidy for the affected farmers from disaster events. As a part of subsidized crop insurance scheme for farmers across Bihar, 120 million USD is expected to be spent by the administration in next seven years. In spite of all these valiant efforts, time gap in insurance payouts for the suffered crop loss are not expected to be less than 10 months from current average of 16 months. In addition, no support is provided to farmers abandoning farming activities due to waterlogging from flood events. This indicate dearth of linkages between long term risk reduction and crop insurance schemes in developing countries which needs to be addressed in design and implementation stage (Surminski and Oramas-Dorta Citation2013). Flood index insurance is capable of addressing some of these issues in Bihar where potential exists for risk transfer mechanism through operationalizing a parametric flood insurance as link between short term coping mechanisms and long term risk reduction activities. As a flood specific insurance product can be considered as associated product of the Pradhan Mantri Fasal Bima Yojana (PMFBY), a pan India wide subsidized crop insurance scheme to provide financial support to farmers suffering crop loss/damage due to natural calamities/adverse weather conditions, to stabilize the income of farmers.
5. Conclusions
The MODIS 8-day reflectance data was used to derive long term (2001–2015) spatio-temporal flood patterns for South Asia. Three flood hotspots located in lower parts of Indus basin in Pakistan, Gangetic plains in Bihar, India and Bangladesh regions were identified to suffer from recurrent flood impacts. Two statistical exploratory methods, k-means clustering and hot spot analysis were used to prioritize 37 districts in Bihar state into four flood risk zones namely low, moderate, high and very high for flood index insurance purposes. Overall 50% of districts grouped into flood hazard zones were in agreement in both statistical methods. Madhubani, Darbhanga, Muzaffarpur and Sitamarhi districts are categorized as very high risk districts by both methods signifying any interventions or risk transfer mechanisms such as parametric flood insurance introduced in these districts has the potential to mitigate on an average minimum of $20 million per year economic losses suffered by smallholder farmer communities. Muzzafarpur district, which is the closest high flood risk district to the capital city Patna has been chosen to pilot flood index insurance for increasing the climate resilience of smallholder farmers.
Acknowledgments
The authors would like to thank Flood Management Improvement Support Centre (FMISC) and Disaster Management Department (DDM), Bihar for sharing relevant data for this study.
Disclosure statement
No potential conflict of interest was reported by the authors.
Additional information
Funding
References
- Amarnath G. 2014. An algorithm for rapid flood inundation mapping from optical data using a reflectance differencing technique. J Flood Risk Manag. 7:239–250.
- Amarnath G, Rajah A. 2016. An evaluation of flood inundation mapping from MODIS and ALOS satellites for Pakistan. Geomatics Nat Hazards Risk. 7:1526–1537.
- Amarnath G, Matheswaran K, Pandey P, Alahacoon N, Yoshimoto S. 2017. Flood mapping tools for disaster preparedness and emergency response using satellite data and hydrodynamic models: A case study of Bagmathi Basin, India. Proc Natl Acad Sci India Sect A Phys Sci. doi:10.1007/s40010-017-0461-7
- Aon Benfield. 2015. Global Catastrophe Recap. http://thoughtleadership.aonbenfield.com/Documents/20151208-if-november-global-recap.pdf
- Bhaskar NR O'Connor CA. 1989. Comparison of method of residuals and cluster analysis for flood regionalization, J Water Resour Plann Manage. 115:793–808.
- Booij MJ. 2005. Impact of climate change on river flooding assessed with different spatial model resolutions. J Hydrol. 303:176–198.
- Burn DH, Goel NK. 2000. The formation of groups for regional flood frequency analysis. Hydrol Sci J. 45:97–112.
- Chavoshi S, Sulaiman WNA, Saghafian B, Sulaiman MNB, Latifah AM. 2012. Soft and hard clustering methods for delineation of hydrological homogeneous regions in the southern strip of the Caspian Sea Watershed. J Flood Risk Manage. 5:282–294.
- Chowdary VM, Chakraborthy D, Jeyaram A, Murthy YVNK, Sharma JR, Dadhwal VK. 2013. Multi-criteria decision making approach for watershed prioritization using analytic hierarchy process technique and GIS. Water Resour Manag. 27:3555–3571.
- DoA. 2015. Agricultural scenario. Bihar: Department of Agriculture. Available from: http://krishi.bih.nic.in/
- DES and DPD. 2012. Bihar statistical Handbook 2012. Directorate of Economics and Statistics and Department of planning and Development, Government of Bihar. Available from: http://www.indiaenvironmentportal.org.in/content/379391/bihar-statistical-hand-book-2012/
- Everitt BS, Landau S, Leese M, Stahl D. 2011. Cluster analysis. 5th ed. Chichester: John Wiley.
- FMISC. 2016. Bihar flood reports from 1987-2010. Flood Information system center (FMIS-Bihar). Available from: fmis.bih.nic.in & http://disastermgmt.bih.nic.in/
- Getis A, Ord JK. 1992. The analysis of spatial association by use of distance statistics. Geogr Anal. 24:189–206.
- Ghanbarpour MR, Salimi S, Hipel KW. 2013. A comparative evaluation of flood mitigation alternatives using GIS-based river hydraulics modelling and multicriteria decision analysis. J Flood Risk Manag. 6:319–331.
- Hartigan JA, Wong MA. 1979. Algorithm AS 136: A k-means clustering algorithm. Appl Stat. 28:100–108.
- Hwang C, Lin M. 1987. Group decision making under multiple criteria: Methods and applications. Berlin: Springer-Verlag.
- IPCC. 2014. Climate Change 2014: Impacts, Adaptation, and Vulnerability. Contribution of Working Group II to the Fifth Assessment Report of the Intergovernmental Panel on Climate Change [Field CB, Barros VR, Dokken DJ, Mach KJ, Mastrandrea MD, Bilir TE, Chatterjee M, Ebi KL, Estrada OL, Genova RC, Girma B, Kissel KS, Levy AN, MacCracken S, Mastrandrea PR, and White LL, editors.]. Cambridge, United Kingdom and New York (NY): Cambridge University Press. Available from: http://www.ipcc.ch/report/ar5/wg2/
- Kappes MS, Papathoma-Köhle M, Keiler M. 2012. Assessing physical vulnerability for multi-hazards using an indicator-based methodology. Appl Geogr. 32:577–590.
- McFeeters SK. 1996. The use of the Normalized Difference Water Index (NDWI) in the delineation of open water features. Int J Remote Sens. 17:1425–1432.
- Minea G. 2013. Assessment of the flash-flood potential of Basca River catchment (Romania) based on physiographic factors. Central Eur J Geosci. 5:344–353.
- Müller A, Reiter J, Weiland U. 2011. Assessment of urban vulnerability towards floods using an indicator-based approach – a case study for Santiago de Chile. Nat Hazards Earth Syst Sci. 11:2107–2123.
- Niti Ayog. 2015. Report of the Task Force on Agriculture. Government of India. Available from: http://niti.gov.in/writereaddata/files/Bihar.pdf
- Papaioannou G, Vasiliades L, Loukas A. 2015. Multi-Criteria Analysis Framework for Potential Flood Prone Areas Mapping. Water Resour Manag. 29:399–418.
- Rahmati O, Zeinivand H, Besharat M. 2016. Flood hazard zoning in Yasooj region, Iran, using GIS and multi-criteria decision analysis. Geomatics, Nat Hazards Risk. 7:1000–1017.
- Rogelis MC, Werner M, Obregón N, Wright N. 2016. Regional prioritisation of flood risk in mountainous areas. Nat Hazards Earth Syst Sci. 16:833–853.
- Sanyal J, Lu XX. 2006. GIS-based flood hazard mapping at different administrative scales: A case study in Gangetic West Bengal, India. Singap J Trop Geogr. 27:207–220.
- Surminski S, Oramas-Dorta D. 2013. Do flood insurance schemes in developing countries provide incentives to reduce physical risks? Munich Re Programme Technical Paper No. 18, The Munich Re Programme: Evaluating the Economics of Climate Risks and Opportunities in the Insurance Sector. Available from: http://www.cccep.ac.uk/wp-content/uploads/2015/10/WP119-flood-insurance-schemes-developing-countries.pdf
- Tasker GD. 1982. Comparing methods of hydrologic regionalization. JAWRA J Am Water Resour Assoc. 18:965–970.
- Turner AG, Annamalai H. 2012. Climate change and the South Asian summer monsoon. Nat Clim Chang. 2:587–595.
- UNISDR. 2011. Global Assessment Report on Disaster Risk Reduction. Geneva, Switzerland: United Nations International Strategy for Disaster Reduction. Available from: http://www.preventionweb.net/english/hyogo/gar/2011/en/home/download.html
- UNISDR. 2015. The Human Cost of Weather-Related Disasters 1995–2015. United Nations Office for Disaster Risk Reduction and Centre for Research on the Epidemiology of Disasters. Available from: http://cred.be/HCWRD
- UNU. 2004. Two billion vulnerable to floods by 2050; number expected to double or more in two generations. United Nations University. http://www.unu.edu/news/ehs/floods.doc
- World Bank. 2015. World development report 2014: risk and opportunity—managing risk for development. Washington, DC. doi:10.1596/978-0-8213-9903–3
- Xiao X, Hollinger D, Aber JD, Goltz M, Davidson EA, Zhang QY. 2004 Satellite-based modeling of gross primary production in an evergreen needle leaf forest. Remote Sens Environ. 89:519–534.
- Xiao X, Boles S, Liu J, Zhuang D, Frolking S, Li C, Salas W, Moore B. 2005. Mapping paddy rice agriculture in southern China using multi-temporal MODIS images. Remote Sens Environ. 95:480–492.
- Xu C, Chen Y, Chen Y, Zhao R, Ding H. 2013. Responses of surface runoff to climate change and human activities in the arid region of Central Asia: a case study in the Tarim River Basin, China. Environ Manag. 51:926–938.
- WRI. 2015. Aqueduct Global Flood Analyzer. World Resources Institute. Available from: floods.wri.org