
 ?Mathematical formulae have been encoded as MathML and are displayed in this HTML version using MathJax in order to improve their display. Uncheck the box to turn MathJax off. This feature requires Javascript. Click on a formula to zoom.
Abstract
The Basilicata region summarizes many basic features of the biogeographic complexity characterizing Mediterranean countries. The intricate geomorphology and the long history of human management generated the current landscapes, which include both high-value ecosystems and areas prone to desertification. Preserving goods and services provided by such composite land cover mosaics poses many problems due to the interference/overlap of diverse natural and anthropic factors which make the correct selection of relevant parameters and the interpretation of observational data rather difficult. Here, we study interconnections between local climate and vegetation activity by correlating parameters characterizing the interannual statistics of the NDVI (Normalized Difference Vegetation Index), derived from satellite data, with a recently devised multivariate statistical index of meteoclimatic variability. We used a 15-year sequence of remote images concerning a set of plots located around meteorological ground stations of the central-eastern part of the region to pick up spatial structures in the vegetation–climate relationships. Our analyses were able to correlate spatial heterogeneity to variations in water exchanges between vegetation and atmosphere. This study represents a first step to improve the description of relevant processes to protect natural habitats and quality agriculture, therefore combating land degradation and climate change detrimental effects.
1. Introduction
One of the major concerns of Smart Communities is to balance the protection of the environment with the economic and social growth (Loperte and Cosmi Citation2015). Green economy partially responds to this basic requirement through the integral and sustainable exploitation of bioresources by using scientific knowledge and technological innovations as the substrate to ensure the effectiveness of the green approach. The role played by Smart Communities is crucial to design management guidelines and to verify the successful integration of economic, environmental and social goals in the long term. In order to achieve such an integration, decision makers need factual information on relevant processes affecting natural resources, correctly seen within the heterogeneity of different biogeographic contexts.
The rich natural heritage and the large availability of bioresources and biodiversity make the Basilicata region a good place to implement green strategies in a general scenario of climate change. Not only more sustainable economic strategies could be a good opportunity for the low-income rural areas that are present in the region, but a smart approach could also be the key tool to solve or, at least, to minimize some heavy problems threatening this region. Climate change, variations in land use and anthropogenic pressure have caused land degradation and desertification phenomena rather significant in the Mediterranean countries. Several studies indicate that some areas of the Basilicata region are particularly prone to land degradation (Piccarreta et al. Citation2006; Basso et al. Citation2010; Imbrenda et al. Citation2013; Citation2014; Statuto et al. Citation2017) stressing on the importance of forest expansion and management to improve community resilience (Kelly et al. Citation2015).
Elements of such complex landscapes are often organized in small patches characterized by different levels of naturality. When studying aspects of biodiversity at the agroecosystem level, attention should be paid to both habitat diversity within one agroecosystem and agroecosystem diversity at regional and even larger scales. Many conservation actions to address local problems have to be therefore integrated in large-scale plans accounting for natural/anthropic ecosystem networks more than single local ecosystems. This demand of integrated management straightforwardly leads back to the need of a holistic approach to the monitoring useful to inform decision. In particular, long-term sustainable plans for the exploitation of natural resources need to integrate the risk linked to potential disturbing factors in the right climatic and physical context. Therefore, monitoring the link between vegetation activity and climate is one of the main preconditions to implement successful sustainability strategies.
In this work, we combined satellite vegetation data, widely used for monitoring vegetation health (Bajocco et al. Citation2012; Tasumi et al. Citation2014; Eckert et al. Citation2015; Ramos et al. Citation2015; Greco et al. Citation2018) with a recently developed multivariate statistical index (Di Leo et al. Citation2015; Giorgio et al. Citation2017) to study how local-scale vegetation activity is linked to climate spatial heterogeneity. Our analysis focused on the eastern part of the region which is largely used for agricultural activities and also includes areas vulnerable to land degradation and desertification (Lanfredi et al. Citation2015). Here, preserving ecosystem goods and services for enhancing the local economy requires a better understanding of local vegetation–climate processes to reinforce resilience and combat the negative interference between climate change (warming, drought and so on) and anthropic stress (water overexploitation, intensive farming and so on).
2. Vegetation cover and climate: the rationale behind the work
Interactions between climate and vegetation are intrinsically bidirectional (Arora Citation2002). Climate controls the spatial distribution of the major vegetation types on a global scale. In turn, the presence of vegetation cover and its type alter physical characteristics of the land surface like albedo, roughness, evapotranspiration (biogeophysical mechanisms) and atmospheric gas composition, for example CO2 and CH4 (biogeochemical effects). The existence of a strict link between land cover annual cycles (phenology) and seasonality of meteorological variables is well known. Especially temperature plays a basic role in the seasonal timing of ecosystem phenologies (Simoniello et al. Citation2012), which feedback on the global climate mainly through the water and carbon cycles.
One of the many challenges for sustainability is understanding how vegetation may respond to changes in climate (e.g. due to increase in greenhouse gas concentrations) and, conversely, how changes in vegetation cover (e.g. due to human management) may affect evapotranspiration, soil moisture and, consequently, the CO2 content in a future climate.
In the long term, considering the annual phenology as the basic temporal unit, we can look at how meteorological irregularities cumulate/vary in time investigating the contextual variability in vegetation productivity on interannual scales. Due to the complexity of the mechanisms involved, estimating the correlation of vegetation parameters with single climate variables could not be the best strategy as variations in climate produce correlated changes in multiple physical variables. As an example, analyses using ecosystem models suggest that biological systems are more sensitive to changes in energy and water balance (Schimel et al. Citation1997) than to temperature or precipitation in themselves (Bachelet et al. Citation2001).
An analysis of the coherence between climate variability and vegetation productivity could therefore benefit from an integrated approach to the problem by handling climate as a multivariate system rather than as a mere collection of independent parameters and looking at the correlation between vegetation activity and indexes representative of this multivariate structure rather than to correlation with single variables. Statistical dependence, if any, could indicate indirectly what are the likely mechanisms that drive the main vegetation–climate relationships in the long term.
2.1. Study area
Basilicata (Southern Italy) is a region with strong orographic contrasts (). The 46.8% of its territory is mountain, 45.2% is hilly and only 8% is flat. Land cover in this region largely reflects orography. In general, natural forested areas are present at high elevation, whereas man managed covers mostly characterize level areas (). The central-eastern part of the region, which is one of the warmest European areas (Lanfredi et al. Citation2015), includes bare clay hills largely affected by erosion (Summa et al. Citation2007; Liberti et al. Citation2009) and the Metaponto alluvial plain where salinization phenomena are frequent (Satriani et al. Citation2012; Imbrenda et al. Citation2018). In spite of its vulnerability, the Metaponto plain represents the main agricultural area of the region, with intensive farming.
Figure 1. Digital elevation model (DEM) of the Basilicata region provided by the Basin Authority (projected to UTM zone 33N at reference datum WGS84). The locations of the meteorological stations are reported on the DEM. Source: (http://rsdi.regione.basilicata.it/Catalogo/srv/ita/search?hl=ita#|r_basili:28FFB196-1EAA-49B4-769D-78C030B75042)
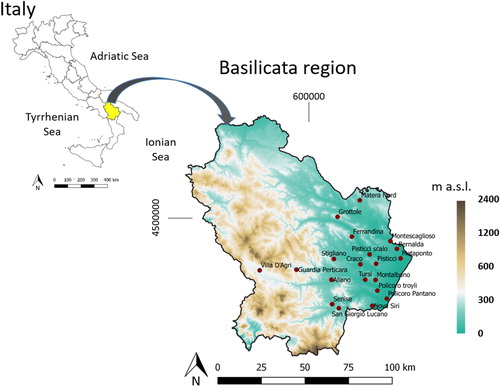
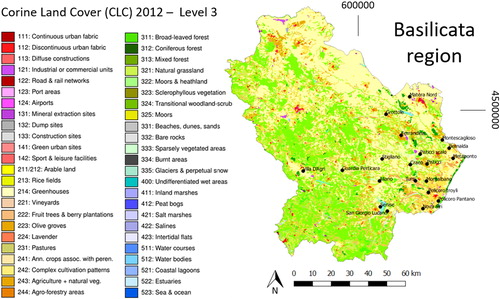
Figure 2. CORINE Land Cover (CLC2012) map of the Basilicata region (projected to UTM zone 33N at reference datum WGS84) downloaded from the Italian National Institute for Environmental Protection and Research (ISPRA) (Source: http://www.sinanet.isprambiente.it/it/sia-ispra/download-mais/). The strong fragmentation of the study area clearly appears from the map.
In the hilly central areas, the daily temperature range is very high both in summer (18–22 °C) and in winter (10–15 °C), and drought is severe. Along the coast, the climate is typically Mediterranean, with cool wet winters and hot dry summers. The marked bi-seasonality and the large daily temperature range expose land to erosion and are predisposing factors for vegetation stress (Simoniello et al. Citation2015). A dry sub-humid climate characterizes the eastern part of the region where most of the vulnerable areas are located.
3. Data
3.1. Meteorological data
Meteorological data used in this study were collected from 2000 to 2014 by the Regional Agency for Development and Innovation in Agriculture (Italian acronym – ALSIA) in 20 sampling sites of the Basilicata region ().
Table 1. Geographic features of the sampling stations.
The investigated area disposes of a sufficient density of meteorological stations, which are more rare in impervious mountain areas.
All the ALSIA monitoring sites are equipped with instruments for continuous and automatic measurement of agro-meteorological parameters. The examined variables are as follows: minimum air daily temperature (Tmin in °C), maximum air daily temperature (Tmax in °C), minimum daily relative humidity (RHmin in %), maximum daily relative humidity (RHmax in %) and daily precipitations (P in mm). In , for each monitoring station and for each year, available data are shown. We took into account only annual series in which the percentage of data missing is lower than 5% and in which there are more than three consecutive days of missing. The remaining data missing were filled using the mean value of nearest neighbours.
Table 2. Available database of meteorological data. Number of analyzed matrices.
3.2. Satellite data
The assessment of vegetation conditions during the examined period (2000–2014) was made using the NDVI (Normalized Difference Vegetation Index) time series derived from the MODIS (Moderate Resolution Imaging Spectroradiometer) sensor on board NASA’s TERRA satellite. This index is available as product MOD13Q1 – vegetation indices – Collection 5, which is a composite of 16 days with 250 m of spatial resolution (available from the NASA Land Processes Distributed Active Archive Center, see https://earthexplorer.usgs.gov/). Annual time series were constructed from the initial database by considering the maximum annual values, according to the usual MVC (maximum value composite) procedure, which is adopted by the remote sensing community to obtain an estimation of the annual vegetation productivity.
3.3. Ancillary data
To identify possible vegetation covers in the vicinity of each meteorological station, we used:
Aerial photographs (1:10,000, with a resolution less than 1 m) for the years 2000, 2008 and 2013 of Basilicata, all freely accessible as WMS layers in GIS environment from the Regional Geoportal of Basilicata Region (http://rsdi.regione.basilicata.it/);
High-resolution Google Earth images.
4. Methods
4.1. Multivariate index NPCI
We analyzed H bi-dimensional annual matrices (with h = 1,…, H and H = 247, see ). We considered N descriptors (N = 7): Tm (°C) average air daily temperature, Tmin (°C) minimum air daily temperature, Tmax (°C) maximum air daily temperature, RHm (%) average daily relative humidity, RHmin (%) minimum daily relative humidity, RHmax (%) maximum daily relative humidity and P (mm) daily precipitations.
For each matrix Mh = [365 sampling days × N descriptors], principal components analysis (PCA) was applied in order to highlight the correlation structure implicitly contained in the data set. For each PCA run, the NPCI (Normal Principal Component Index) values were calculated (Di Leo et al. Citation2015; Giorgio et al. Citation2017). NPCI estimates a standardized weight for each descriptor in the correlation structure. It allows to assess quantitatively the role of each descriptor in the different years and, at the same time, the role of the different descriptors in each year.
Moreover, for each station and for each descriptor, we calculated the range of NPCI in the investigated period. High values of NPCI indicate high variations in weight of the variable in the correlation structure, and low values of NPCI indicate the presence of a stable correlation structure over the time.
For highlighting differences among the sampling stations, we applied an unsupervised clustering algorithm to the ranges of NPCI and calculated for each station group the centroid values.
4.2. NDVI and NDVI_range
We adopted NDVI as an adequate proxy for vegetation productivity profitably used in various biogeographic regions and at different spatial scales (D’Emilio et al. Citation2018; Liu et al. Citation2018; Sulla-Menashe et al. Citation2018). NDVI is computed as follows:
where and
are the reflectances at the near-infrared and red wavelengths of the adopted sensor (in this case, the index is directly available as product MOD13Q1, see Section 3.2).
We initially considered different parameters characterizing the NDVI temporal statistics in each site (mean, maximum, minimum, variability range). Our analyses led to select the range of the MVC-NDVI as the final, most explicative parameter summarizing vegetation productivity variation per each pixel p:
Finally, the mean value around the meteorological stations was calculated for different plot sizes (250, 500, 1000 and 2000 m) to perform correlations with meteorological data.
5. Results
5.1. Analysis of NPCI
We analyzed 247 yearly matrices (for each year, at least 12 matrices were available and for each sampling station at least 9 years of data were available).
For each matrix, NPCI values with the corresponding range on the investigated period were calculated. In , the plot of mean values of NPCI of meteorological parameters for each sampling station is shown.
Figure 3. Mean values of NPCI calculated for each sampling station and for each meteorological variable in the period (2000–2014): NPCITmin, NPCITmax, NPCIRHmin, NPCIRHmax and NPCIP.
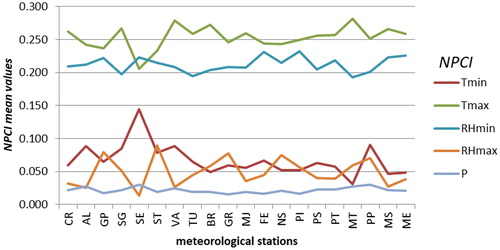
As shown in a previous paper (Giorgio et al. Citation2017), a low mean value of NPCI suggests that the descriptor has a constant weight in the examined period, whereas a high mean value of NPCI suggests that the descriptor has high variations in the correlation structure. If estimated over the whole study area, the NPCI of the precipitations has the lowest mean value (NPCIP = 0.021 ± 0.004); the minimum temperature and the maximum relative humidity present lower mean values of NPCI (NPCITmin = 0.067 ± 0.024 and NPCIRHmax = 0.049 ± 0.021) with respect to the maximum temperature and minimum relative humidity (NPCITmax = 0.253 ± 0.017 and NPCIRHmin = 0.212 ± 0.012).
For highlighting differences between the sampling stations, we applied an unsupervised clustering algorithm (D’Emilio et al. Citation2013) to the ranges of NPCI (r-NPCI) estimated over the 15-year period. Centroid values were calculated for each group of stations.
In , we show the dendrogram of r-NPCI. This figure highlights the presence of two clusters, cluster A and cluster B. Inside each of these clusters, other two sub-clusters are present. The first sub-cluster A1 of the cluster A is composed by the sampling stations of Pisticci Scalo (PS), Craco (CR), Matera (MT), Montalbano Jonico (MJ) and Bernalda (BR). The second sub-cluster A2 is composed by the sampling stations of Tursi (TU), Stigliano (ST), San Giorgio Lucano (SG) and Policoro Pantano (PP). The first sub-cluster B1 of the cluster B is composed by the sampling stations of Metaponto (ME), Montescaglioso (MS), Nova Siri (NS), Ferrandina (FE), Grottole (GR) and Senise (SE). The second sub-cluster B2 is composed by the sampling stations of Villa d’Agri (VA), Aliano (AL), Policoro Troyli (PT), Pisticci (PI) and Guardia Perticara (GP).
Figure 4. Dendrogram of NPCI range (r-NPCI).
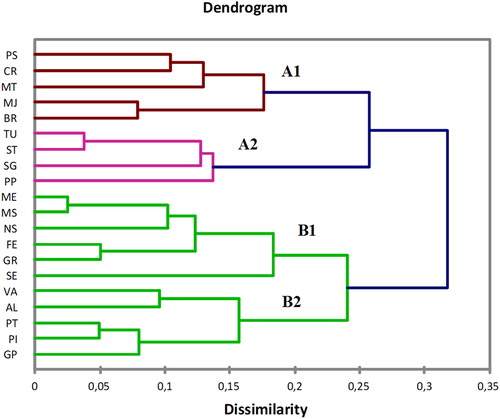
As shown in , the clustering procedure puts in evidence groups with different behaviours both for r-NPCITmin and r-NPCITmax, and r-NPCIRHmin and r-NPCIRHmax. In particular, r-NPCITmin is very variable in the sampling stations that are included in the A2 and B2 groups and r-NPCITmax is variable for the A2 sampling stations. Summarizing the results of the cluster analysis:
the A1 group is characterized by statistical significant variations in r-NPCIRHmin, r-NPCIRHmax and r-NPCITmin;
the A2 group is characterized by high variations in all four variables;
the B1 group is characterized by low variations in all four variables;
the B2 group is characterized by statistical significant variations in r-NPCIRHmin, r-NPCIRHmax and r-NPCITmin which are opposite with respect to the A1 group.
Table 3. Centroids of the clusters.
The two macro-groups A and B can be labelled according to the weight of r- NPCIRHmin and r-NPCIRHmax in the correlation structure of the meteorological variables.
5.2. Analysis of NDVI
In , we reported the values of the NDVI_range selected to synthesize the temporal statistics of the NDVI calculated in the sampling stations.
Table 4. NDVI range estimated over the 15-year period per different plot sizes around the meteorological stations.
With the help of aerial photographs and high-resolution Google Earth images, we firstly evaluated the possibility of land use/land cover changes. We did not observe dramatic phenomena requiring additional investigations. Most of the changes concerned little agricultural transformations probably linked to changes in EU’s Common Agricultural Policy (CAP). Anyway, in agricultural sites, the interannual variability due to crop changes (e.g. crop rotation) is rather frequent and should introduce variability in the local microclimate as well (see Section 2). It is interesting to note that, on the average, the values of NDVI_range slightly decrease with the size of the area, thereby highlighting that significant changes are truly local. When we consider larger areas, randomness in the direction of the changes (increase/decrease) per pixel leads to a smoother temporal variability. No evident correspondence with the meteorological clustering seems to appear.
5.3. Spatial correlation analysis between NPCI range and NDVI
The correlation analysis between NDVI_range and NPCI, performed for all the meteorological variables, shows that NDVI is statistically dependent on the NPCI estimated for humidity variables (). Correlation significance at the 1000 m threshold starts to decrease dramatically and at 2000 m the two variables appear to be completely decorrelated.
Table 5. Correlation between NDVI_range and NPCI for the relative humidity.
6. Discussion and conclusions
We performed a statistical analysis of meteorological data from ground stations and satellite data concerning vegetation activity to investigate the presence of spatial coherence in their interannual variability. The analysis of a multivariate index of meteoclimatic variability allowed to pick up two macro-groups (A and B) in the set of the analyzed sites which differ for the weight of relative humidity in the correlation structure of the meteorological parameters. The analysis of the correlation with vegetation seems to confirm the basic role of relative humidity to account for spatial diversity. As humidity is related to evapotranspiration, the main source of mutual statistical dependence seems to be the water exchange between the lowest atmosphere layer and vegetated surfaces, which therefore mostly explains spatial coherence in the long-term variability of climate and vegetation across the analyzed agroecosystems. This interpretation is also supported by the decrease of such a correlation with the size of the plots analyzed, as evapotranspiration has a truly local character. These estimates should be sensitive to effects of land cover and/or climate change which alter the current scenario and therefore are able to provide a quantitative parameter to evaluate them. As a consequence, looking at the multivariate statistics of climate jointly with local vegetation parameters may be a promising strategy to improve the description of relevant processes affecting vegetation cover heterogeneity within their proper biogeographic context. This holistic characterization could be useful to support Smart Communities in the development of plans to protect natural habitats and quality agriculture, therefore combating land degradation and climate change detrimental effects.
Acknowledgements
We would thank the local agency ALSIA (Agenzia Lucana di Sviluppo e di Innovazione in Agricoltura), in particular Dr E. Scalcione, for the research material made available.
Disclosure statement
No potential conflict of interest was reported by the authors.
References
- Arora V. 2002. Modeling vegetation as a dynamic component in soil-vegetation-atmosphere transfer schemes and hydrological models. Rev Geophys. 40(2), 1–26.
- Bachelet D, Neilson RP, Lenihan JM, Drapek RJ. 2001. Climate change effects on vegetation distribution and carbon budget in the United States. Ecosystems. 4:164–185.
- Bajocco S, De Angelis A, Salvati L. 2012. A satellite-based green index as a proxy for vegetation cover quality in a Mediterranean region. Ecol Indic. 23:578–587.
- Basso B, Simone LD, Ferrara A, Cammarano D, Cafiero G, Yeh M-L, Chou T-Y. 2010. Analysis of contributing factors to desertification and mitigation measures in Basilicata region. Ital J Agron. 5:33–44.
- D’Emilio M, Caggiano R, Macchiato M, Ragosta M, Sabia S. 2013. Soil heavy metal contamination in an industrial area: analysis of the data collected during a decade. Environ Monit Assess. 185:5951–5964.
- D’Emilio M, Coluzzi R, Macchiato M, Imbrenda V, Ragosta M, Sabia S, Simoniello T. 2018. Satellite data and soil magnetic susceptibility measurements for heavy metals monitoring: findings from Agri Valley (Southern Italy). Environ Earth Sci. 77:63.
- Di Leo S, Cosmi C, Ragosta M. 2015. An application of multivariate statistical techniques to partial equilibrium models outputs: the analysis of the NEEDS-TIMES Pan European model results. Renew Sustain Energy Rev. 49:108–120.
- Eckert S, Hüsler F, Liniger H, Hodel E. 2015. Trend analysis of MODIS NDVI time series for detecting land degradation and regeneration in Mongolia. J Arid Environ. 113:16–28.
- Giorgio GA, Ragosta M, Telesca V. 2017. Application of a multivariate statistical index on series of weather measurements at local scale. Measurement. 112:61–66.
- Greco S, Infusino M, De Donato C, Coluzzi R, Imbrenda V, Lanfredi M, Simoniello T, Scalercio S. 2018. Late spring frost in Mediterranean beech forests: extended crown dieback and short-term effects on moth communities. Forests. 9:388
- Imbrenda V, Coluzzi R, Lanfredi M, Loperte A, Satriani A, Simoniello T. 2018. Analysis of landscape evolution in a vulnerable coastal area under natural and human pressure. Geomat Nat Hazards Risk. doi: 10.1080/19475705.2018.1508076
- Imbrenda V, D’Emilio M, Lanfredi M, Macchiato M, Ragosta M, Simoniello T. 2014. Indicators for the estimation of vulnerability to land degradation derived from soil compaction and vegetation cover. Eur J Soil Sci. 65:907–923.
- Imbrenda V, D’Emilio M, Lanfredi M, Ragosta M, Simoniello T. 2013. Indicators of land degradation vulnerability due to anthropic factors: tools for an efficient planning. Geogr Inf Anal Sustain Dev Econ Plan New Technol. 87–101.
- Kelly C, Ferrara A, Wilson GA, Ripullone F, Nolè A, Harmer N, Salvati L. 2015. Community resilience and land degradation in forest and shrubland socio-ecological systems: evidence from Gorgoglione, Basilicata, Italy. Land Use Policy. 46:11–20.
- Lanfredi M, Coppola R, Simoniello T, Coluzzi R, D’Emilio M, Imbrenda V, Macchiato M. 2015. Early identification of land degradation hotspots in complex bio-geographic regions. Remote Sens. 7:8154–8179.
- Liberti M, Simoniello T, Carone MT, Coppola R, D’Emilio M, Macchiato M. 2009. Mapping badland areas using Landsat TM/ETM satellite imagery and morphological data. Geomorphology. 106:333–343.
- Liu R, Xiao L, Liu Z, Dai J. 2018. Quantifying the relative impacts of climate and human activities on vegetation changes at the regional scale. Ecol Indic. 93:91–99.
- Loperte S, Cosmi C. 2015. The environmental balance of the Alta Val d’Agri: a contribution to the evaluation of the industrial risk and strategic sustainable development. Nat Hazards Earth Syst Sci. 15:1941–1954.
- Piccarreta M, Capolongo D, Boenzi F, Bentivenga M. 2006. Implications of decadal changes in precipitation and land use policy to soil erosion in Basilicata, Italy. Catena. 65:138–151.
- Ramos A, Pereira MJ, Soares A, Rosário L do, Matos P, Nunes A, Branquinho C, Pinho P. 2015. Seasonal patterns of Mediterranean evergreen woodlands (Montado) are explained by long-term precipitation. Agric Forest Meteorol. 202:44–50.
- Satriani A, Loperte A, Imbrenda V, Lapenna V. 2012. Geoelectrical surveys for characterization of the coastal saltwater intrusion in Metapontum forest reserve (Southern Italy). Int J Geophys. 2012: (Article ID 238478), 8. https://doi.org/10.1155/2012/238478.
- Schimel DS, Braswell BH, Parton WJ 1997. Equilibration of the terrestrial water, nitrogen, and carbon cycles. Proc Natl Acad Sci. 94(16):8280–8283.
- Simoniello T, Coluzzi R, Imbrenda V, Lanfredi M. 2015. Land cover changes and forest landscape evolution (1985–2009) in a typical Mediterranean agroforestry system (high Agri Valley). Nat Hazards Earth Syst Sci. 15:1201–1214.
- Simoniello T, Lanfredi M, Coppola R, Imbrenda V, Macchiato M. 2012. Correlation of vegetation and air temperature seasonal profiles – spatial arrangement and temporal variability. Phenol Clim Change. 273–296.
- Statuto D, Cillis G, Picuno P. 2017. Using historical maps within a GIS to analyze two centuries of rural landscape changes in Southern Italy. Land. 6:65.
- Sulla-Menashe D, Woodcock CE, Friedl MA. 2018. Canadian boreal forest greening and browning trends: an analysis of biogeographic patterns and the relative roles of disturbance versus climate drivers. Environ Res Lett. 13:014007.
- Summa V, Tateo F, Medici L, Giannossi ML 2007. The role of mineralogy, geochemistry and grain size in badland development in Pisticci (Basilicata, southern Italy). Earth Surf Process Landf. 32:980–997.
- Tasumi M, Hirakawa K, Hasegawa N, Nishiwaki A, Kimura R. 2014. Application of MODIS land products to assessment of land degradation of alpine rangeland in Northern India with limited ground-based information. Remote Sens. 6:9260–9276.