
 ?Mathematical formulae have been encoded as MathML and are displayed in this HTML version using MathJax in order to improve their display. Uncheck the box to turn MathJax off. This feature requires Javascript. Click on a formula to zoom.
Abstract
The soil parameters for large, complex landslides are typically derived from incomplete information based on a small sample set due to budgetary constraints. This informational incompleteness results in large statistical uncertainty in landslide reliability analyses. In this article, the bootstrap technique is proposed to quantify the statistical uncertainties associated with a small sample set, and a practice-oriented reliability analysis is performed. The results suggest that the obtained reliability indices are characterized by a long tail, in which the worst-case scenario has a local extreme value and a small population. The statistical uncertainties are quantified and characterized by a confidence interval at a specified confidence level. The confidence interval of the reliability index and identification of the worst-case scenario enable engineers to make more informed decisions.
1. Introduction
Landslides are one of the most common hazards worldwide (Barbarella et al. Citation2015). The movement and failure of landslides, especially large-scale landslides, have potentially catastrophic societal and economic consequences (Ma et al. Citation2017a, Citation2017b). For instance, the Jiweishan rockslide, a large-scale rockslide that occurred on June 5, 2009, in Wulong County, Chongqing, China, took the lives of 74 people (Tang et al. Citation2015c).
The volume of large landslide events can range from a few to hundreds of millions of cubic meters, and the velocity of such a landslide can easily surpass 100 m/s (Hürlimann et al. Citation2001). Engineering measures are frequently inappropriate for addressing such large-scale landslides due to the extremely high kinetic energy involved. Therefore, suitable emergency planning is the only effective method of reducing the vulnerability of potentially affected areas (Crosta and Agliardi Citation2003). Identifying the triggering factors and evolution processes, developing a satisfactory understanding of the landslide geometry and kinematics, and performing reasonable stability assessments are required for managing such emergencies. Geological investigations (Hasegawa et al. Citation2009; Tang et al. Citation2015a; Deng et al. Citation2017), monitoring (Borgatti et al. Citation2006; Peyret et al. Citation2008), and mode testing (Huang et al. Citation2016) have been performed to study the evolution mechanisms of large-scale landslides, and analyses of monitoring data have been performed to improve the knowledge of sliding kinematics (Peyret et al. Citation2008) and derive appropriate criteria (Corominas Citation1996; Crosta and Agliardi Citation2003). Numerical analytical techniques, e.g. the limit equilibrium method (Sun et al. Citation2016), reliability-based method (Wu et al. Citation2014, Citation2017; Tang et al. Citation2015b; Zhao et al. Citation2016), finite element method (Crosta et al. Citation2003; Hu et al. Citation2012), and discrete element method (Tang et al. Citation2009; Chang et al. Citation2012), have been applied in stability assessments of large-scale landslides.
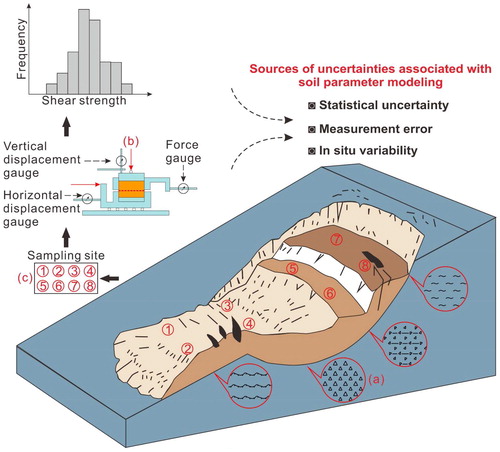
Stability assessments of large-scale landslides are complex and remain a key challenge in natural hazard research because of the uncertainties involved (Giasi et al. Citation2003). In fact, three main sources of uncertainty are associated with soil parameter modeling in stability assessments: in situ variability, measurement errors, and statistical uncertainty (schematically illustrated in ) (Giasi et al. Citation2003; Most and Knabe Citation2010; Luo et al. Citation2013). In situ variability is associated with variations in the mineral composition, natural processes, or stress history of the soil mass ((a) in ). Measurement errors are caused by sampling disturbances, test imperfections and human error ((b) in ); this type of uncertainty can be addressed with multiple or repeated measurements or by providing measurements with error bounds. Moreover, assuming that measurement errors are minimal for soil data obtained in research programs is reasonable because good equipment and procedural controls are likely to be maintained (Orchant et al. Citation1988). Statistical uncertainty mainly results from a limited number of tests and samples ((c) ). In practical applications, only limited numbers of samples are tested due to budgetary constraints associated with in situ investigations and field and laboratory tests; this incompleteness can lead to tremendous statistical uncertainty in soil parameter modeling (Luo et al. Citation2013; Li et al. Citation2015).
Figure 1. Schematic diagram showing the sources of uncertainties associated with soil parameter modeling.
The reliability-based method has the ability to account for estimation uncertainties in geological, geotechnical, and geomorphological parameters (Singh et al. Citation2013); thus, it has gained increasing popularity in the stability assessments of large-scale landslides. For example, Wu et al. (Citation2014) used the random-fuzzy method to estimate the reliability index values for a large-scale reservoir landslide. Tang et al. (Citation2015b) performed dynamic reliability analysis on a large earthquake-induced landslide by considering the energy-time distribution. Additionally, Wu et al. (Citation2017) studied variations in the reliability index values of the large and complex Huangtupo landslide under periodic rainfall and water level fluctuations.
However, current research mostly focuses on the reliability analysis of large landslides under different driving factors, and few studies have examined the effect of statistical uncertainty on the landslide reliability index. The purpose of this study is to perform a practice-oriented reliability analysis for a large, complex landslide with incomplete information. A bootstrap technique is proposed to quantify the statistical uncertainty associated with a small sample set and achieve a more meaningful evaluation of the landslide reliability. For this purpose, the Outang landslide, a large and complex landslide in the Three Gorges Reservoir area, is chosen as a case study.
2. Bootstrap
The bootstrap method (Efron Citation1979) is a nonparametric technique that can be used to estimate variations in sample statistics derived from a small sample size (for example, fewer than 30 data points) (Mojtahedi et al. Citation2009; Luo et al. Citation2013; Li et al. Citation2015; Valášková et al. Citation2015). This technique is flexible, easy to implement, and applicable in nonparametric settings, and it requires a minimal set of assumptions (Mojtahedi et al. Citation2009; Ma et al. Citation2018). The notion behind bootstrapping is to create large sets of bootstrap samples by random sampling with replacements from the original observations. Bootstrap samples can have a smaller dimension than the original observations. The best results are achieved if the size of the single bootstrap sample is set to the original sample size (Luo et al. Citation2013; Valášková et al. Citation2015).
Let denote the original observations. A bootstrap sample set
can be constructed by random sampling with replacement from the original observations X (schematically illustrated in ). An observation xi in the original observations may appear once, more than once or not at all. The sample mean and standard deviation of the constructed bootstrap sample set Bj are given as follows:
(1)
(1)
(2)
(2)
where
is the ith sample in the jth bootstrap sample set. The above sampling procedure is repeated many times, and B bootstrap sample sets are obtained.
Table 1. Basic principle of the bootstrap technique: generation of bootstrap sample sets from the original observations by random sampling with replacement.
3. Study area and input data
3.1 Features of the Outang landslide
The Outang landslide (), which is a large and complex landslide in the Three Gorges Reservoir, occurred in Anping Town of Fengjie County, Chongqing, on the south bank of the Yangtze River approximately 177 km from the Three Gorges Reservoir Dam (see for its location). More than 4119 people reside at the landslide site. The main sliding direction of the landslide is 340–350° (). The Outang landslide has a maximum length and width of 1800 m and 1100 m, respectively. The average thickness of the landslide body is approximately 50.8 m. The entire planar area of the landslide is approximately 1.78 million m2, and its estimated volume is 90 million m3. The landslide body extends from an elevation of 95 m above sea level (a.s.l.) at the toe to 705 m a.s.l. at the crown ( and ). The landslide has an average slope gradient of 25°.
Figure 2. (a) Photograph of the Outang landslide. (b, c) Location of the Outang landslide in the Three Gorges Reservoir area, China.
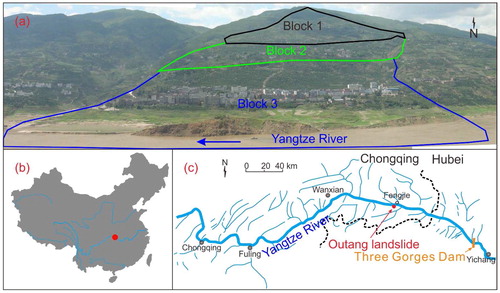
Figure 3. Topographic map of the Outang landslide.
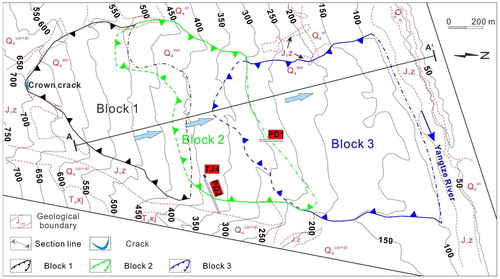
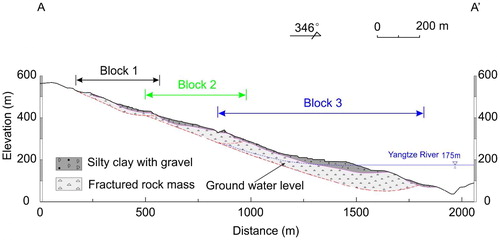
Figure 4. Geological profile along section A-A’.
The landslide is composed of three blocks ( and ). Block 3 extends from an elevation of 95 m a.s.l. at the toe to 370 m a.s.l. at the crown. The planar area of Block 3 is approximately 0.92 million m2, and the volume of Block 3 is approximately 64.8 million m3. Block 2 lies at an elevation between 250 and 530 m. Block 2 has an estimated planar area and volume of 0.32 million m2 and 10.2 million m3, respectively. Block 1 extends from an elevation of 400 m a.s.l. at the toe to 705 m a.s.l. at the crown. The planar area of Block 1 is 0.54 million m2, and the volume of Block 1 is approximately 14.5 million m3.
The stratigraphic units present in the study area () are loose Quaternary deposits (Q4) in addition to the Zhenzhuchong formation (J1z) and Xujiahe formation (T3xj). A detailed description of the stratigraphic units is given in . A site-specific investigation involving exploratory boreholes, open test pits, and exploratory tunnels indicated that the landslide masses are composed of silty clay with gravel and fractured rock mass (). The sliding zone is composed of carbonaceous clay with a thickness of 5–8 cm. The sliding mass is underlain by sandstone of the Jurassic Zhenzhuchong formation with an average dip direction of 320–350° and a dip angle of 20–28°. Groundwater is abundant in the landslide (see for the groundwater level). A flow rate ranging from 3 to 7 tons per day was measured in February 2004 during the excavation of an exploratory tunnel (PD1).
Table 2. Stratigraphic units present in the study area.
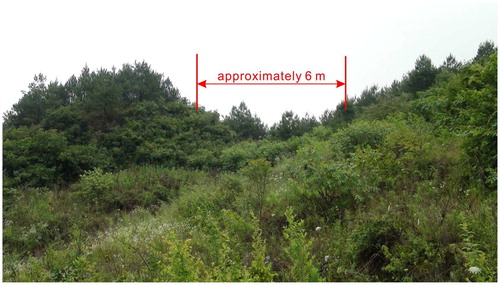
The Outang landslide, a large ancient landslide, was reactivated by the initial impoundment of the Three Gorges Reservoir Dam in June 2003. Tension cracks at the crown between the elevations of 700 and 705 m a.s.l. (see for the crack locations) were first noticed by the locals during the 1950s. The crown crack was perpendicular to the sliding direction, and it has increased in width with time under the combined effects of water level fluctuations and rainfall. A site-specific investigation showed that the crown crack reached approximately 6 m in width (), and 160 noticeable cracks are distributed on the landslide surface that endanger residents living at the landslide site. The residents living at the landslide site began to relocate in October 2014 due to these precarious circumstances (Yin et al. Citation2016), and the residents’ houses have since been demolished. For the purpose of landslide monitoring and early warning, a multiple monitoring system consisting of 37 GPS monuments and 17 inclinometer boreholes was installed on the landslide mass.
Figure 5. Tension rack at the crown of the landslide (location of the crack is shown in ).
3.2 In situ shear test
In situ shear tests represent an effective method of obtaining shear parameters because of the following potential benefits. First, in situ shear tests can be performed in the natural environment without sampling disturbances. Second, in situ tests can be performed on soils, such as dry and single-grain sand, which are either impossible or difficult to sample without the use of expensive and specialized methods. Third, a larger volume of soil can be tested than is normally practicable for laboratory testing. This larger volume may be more representative of the soil mass. Fourth, the detection of the sheared surface is much more likely and practical. Because of these advantages, in situ shear tests have been increasingly used in recent decades (Wu and Watson Citation1998; Li et al. Citation2004).
In this study, in situ shear tests () were performed in an exploratory tunnel (PD1) and open pit (TJ4) (see for the test locations) to study the shear strength of the sliding zone soil. The sample size of the soil block was 50 cm long, 50 cm wide, and 35 cm high. A total of eight sets of in situ shear tests were performed due to budgetary constraints. Each test set contained five soil blocks. In the exploratory tunnel and open pit, the sliding zone soil was saturated with groundwater. The saturated shear parameters of the sliding zone measured from the in situ shear test are shown in . From a statistical perspective, the dataset of shear strength parameters is considered incomplete information and is based on a small sample size, which will cause large statistical uncertainty in the soil parameters.
Figure 6. (a) Schematic illustration of the in situ shear test. (b) Surcharge loading. (c) Soil block. (d) Sheared surface (see for the test location).
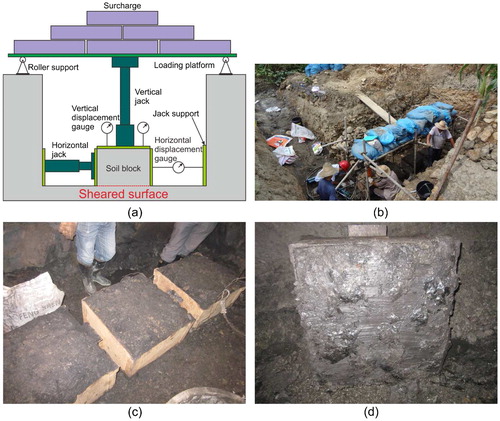
Table 3. Saturated shear strength parameters of the sliding zone soil measured during the in situ shear test (see for the test location).
4. Reliability analysis for the Outang landslide
4.1 Reliability analysis for the Outang landslide based on Monte Carlo simulations (MCSs)
shows the implementation of the procedure involved in the reliability analysis based on Monte Carlo simulations (MCSs). Previous studies have shown that the reliability index is particularly sensitive to uncertainties in the shear strength parameters (Li et al. Citation2015). Therefore, the shear strength parameters were treated as uncertain variables, and the densities of the landslide materials were treated as constants. The deterministic quantities of the density for silty clay and fractured rock mass are as follows: =2010 kg/m3 and
=2500 kg/m3.
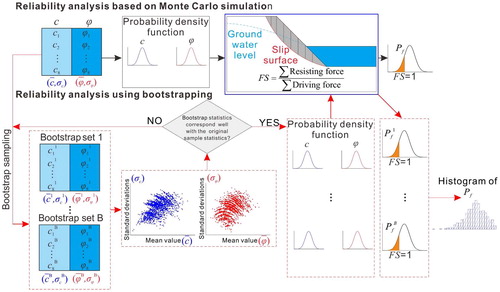
Figure 7. Flow chart showing the steps involved in the reliability analyses based on Monte Carlo simulations and the bootstrap approach.
The sample statistics derived for the Outang landslide from the small sample set measured from the in situ shear tests are given in . These sample statistics were used to generate random values for the reliability analysis. Previous studies have shown that most soil parameters can be adequately modeled with a truncated normal distribution (Most and Knabe Citation2010; Luo et al. Citation2013). Therefore, the shear parameters of the sliding zone soil for the Outang landslide were modeled with truncated normal distributions. For the sake of simplicity, reliability analyses were performed under the assumption of fully saturated conditions. In fact, saturated conditions are commonly assumed to correspond to the most critical conditions in practical applications (Gofar and Rahardjo Citation2017). The SLOPE/W module of the landslide stability analysis software program GeoStudio (Geo-Slope International Ltd. Citation2012) was used to calculate the reliability index and probability of failure of the Outing landslide, and the MCS was set to work with 10,000 cycles. The calculations of the safety factor were based on the Morgenstern-Price method. The reliability index based on the MCS of the Outing landslide was calculated as 0.78, and the corresponding probability of failure was found to be 21.9%.
4.2 Reliability analysis for the Outang landslide using bootstrapping
The overall framework of the reliability analysis for the Outang landslide using bootstrapping is shown in . A total of B bootstrap sample sets were generated from the original observations shown in . The cohesive strength and friction angle were determined from the same soil sample; therefore, they are treated as a pair of data when they are resampled using bootstrapping. Bootstrap sampling represents a tradeoff between the maximum number of replications that can be performed in a reasonable amount of time and the minimum number of replications needed to accurately estimate the sample statistics. Generally, the chosen number of bootstrap sample sets B typically must be very large, e.g. 10,000, to obtain converged results in the statistical evaluation (Most and Knabe Citation2010; Luo et al. Citation2013). However, for a large and complex landslide such as the Outang landslide, for which a single reliability analysis is already numerically demanding, the computational cost of a reliability analysis using large-scale bootstrap sampling can become overly expensive. To reduce the computational cost, a sensitivity analysis was performed to determine the optimal bootstrap number B. In the sensitivity analysis, different bootstrap replicate numbers ranging from 10 to 20,000 were used to generate bootstrap sample sets of different sizes. The bootstrap means of the sample mean value were calculated as follows:
(3)
(3)
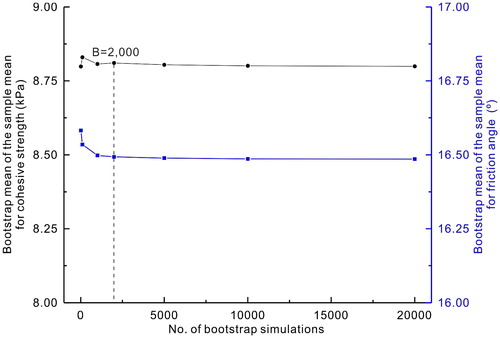
shows the fluctuations in the bootstrap means of the sample mean values with respect to the number of bootstrap replicate simulations. illustrates that the converged result of the bootstrap means was achieved at 2000 bootstrap replicate simulations. The bootstrap means of the sample mean cohesive strength and friction angle values are 8.81 kPa and 16.49°, respectively. These numbers correspond well with the original sample means shown in , suggesting that bootstrapping reflects the main characteristics of the original observations. Therefore, the bootstrap replicate number B was set to 2000 in the paired bootstrap method.
Figure 8. Bootstrap means of the sample mean cohesive strength and friction angle values with respect to the number of bootstrap replicate simulations.
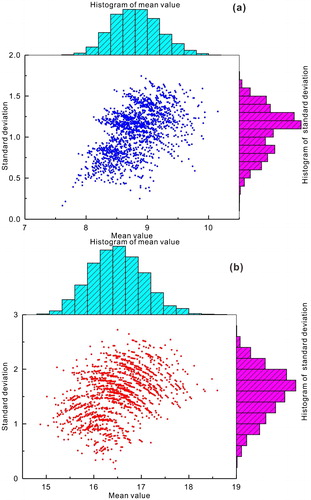
After 2000 bootstrap replications, a total of 2000 bootstrap sample sets were generated, and the sample statistics (mean value and standard deviation) for each bootstrap sample set were calculated. The sample statistics of the 2000 bootstrap sample sets generated from the original observations are shown in , which shows that the mean value and standard deviation of the bootstrap sample sets both follow a normal distribution.
Figure 9. Sample statistics of 2000 bootstrapping sample sets generated from the original shear strength parameter list in . (a) Mean value and standard deviation of the bootstrap sample sets for the cohesive strength. (b) Mean value and standard deviation of the bootstrap sample sets for the friction angle.
The sample statistics shown in were set as inputs for the probability density function to generate random values for the reliability analysis in the MCS. The reliability analyses based on the MCSs in Section 4.1 were replicated 2000 times; consequently, a total of 2000 reliability indices were obtained. The corresponding reliability indices are shown in and . The variation in the computed reliability indices resulting from the variation in the sample statistics can be observed in . Reliability indices ranging from –0.28 to 6.75 were obtained, and they presented a median value of 0.84 and a standard deviation of 0.44. A confidence interval, which is a range of values that likely reflect the true range of values, was used to express the variation in the computed reliability indices. A confidence interval at the 90% level, for example, can be derived to quantify the statistical uncertainties based on the most obvious technique: the percentile method (Chernick Citation2008). By ordering the bootstrap estimates from smallest to largest, we could define an interval by identifying the percentiles corresponding to the desired confidence interval as the upper and lower bounds (e.g. 5% and 95% for a 90% confidence interval). In this study, the 90% confidence interval of the reliability index was computed. Instead of a single crisp reliability index based on the MCS, an interval ranging from 0.31 to 1.68 was obtained. The high standard deviation and wide confidence interval signify the presence of a high level of uncertainty associated with incomplete information.
Figure 10. (a) Probability of failure (Pf) versus the reliability indices (β) of the Outang landslide based on incomplete information using bootstrapping. (b) Histogram of the reliability indices. (c) Histogram of the probability of failure.
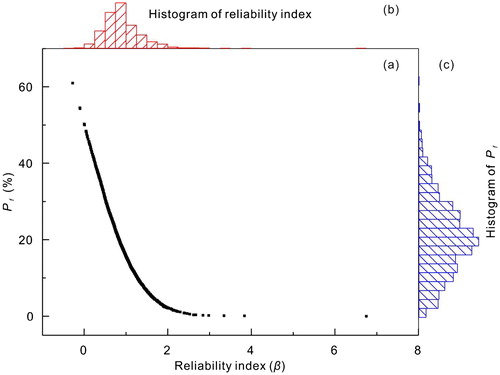
Table 4. Reliability indices of the Outang landslide based on incomplete information using bootstrapping.
indicates that the obtained reliability indices were characterized by a long tail consisting of local extreme values with a small population located far away from the mean on both sides (Bruce Citation2004). Here, these extreme tails are important because they provide a notion of the worst possible scenarios that could be anticipated for the reliability of the landslide, and these tails must be particularly investigated. In the worst possible scenario, the reliability index of the Outang landslide decreased to –0.28 and presented a failure probability of 60.98. This probability is three times higher than that obtained based on the MCS.
The above results clearly indicate the need to consider the statistical uncertainty caused by incomplete information to assess the quality of the computed reliability indices and failure probability.
4.3 Comparison of MCS-based and bootstrapping-based reliability analyzes
Based on the hierarchy indices of the failure probability and landslide stability state (Wu et al. Citation2017), the MCS-based reliability analysis indicates that the Outang landslide is basically stable under the most critical state, whereas the bootstrapping-based reliability analysis indicates that the Outang landslide is basically stable to highly unstable under the most critical state.
A heavy rainfall event occurred in northeastern Chongqing from August 31 to September 2, 2014. The maximum accumulated rainfall was recorded in Yunyang County (31.26°N, 108.92°E), where the 12-hour rainfall amount reached 210 mm. A heavy rainfall event with an hour-long rainfall amount of 38 mm was recorded in Yunyang County at 07:00 on September 1, 2014. The landslide area also experienced heavy rainfall with a total rainfall amount of 217.6 mm. Under this heavy rainfall, the landslide mass deformed severely. A maximum displacement of 96 mm was recorded by the GPS monument. Additionally, significant deep deformation with a magnitude of 52 mm was recorded in borehole ZK 89 by the inclinometer at a depth of 34.5 m. Moreover, cracks appeared in the concrete sidewall of the exploratory tunnel, and the crack reached a length of 3 m and a width of 3 mm in late September 2014. These deformation characteristics indicate that the Outang landslide is at a high risk of landslide failure under the most critical conditions; consequently, the government decided to implement relocation and demolition. The finding of a high failure risk is consistent with the reliability analysis based on incomplete information using bootstrapping. Therefore, we conclude that the bootstrapping-based reliability analysis provides a reasonable estimate of the stability state.
In this study, a reliability index of 0.78 and a failure probability of 21.9% were obtained from the MCS, and they correspond well with the median value obtained from bootstrapping, which suggests that conventional MCS-based reliability analyses can reflect the average characteristics of the original observations. However, the difference in the computed failure probability from the median case to the worst possible scenario ranges from 19.7% to 60.98%, which is equivalent to a twofold variation in the magnitude of the failure probability.
For many engineers, bootstrapping-based reliability analysis and constructed confidence estimations are attractive but difficult to implement in landslide engineering. Therefore, considerable care should be exercised by decision makers when using such MCS-based estimates. An emergency backup plan should be implemented for the worst possible emergency.
To simplify matters, reliability analyses were performed with the assumption of fully saturated conditions. We hope that this shortcoming will not significantly affect the clarity of the present findings.
5. Conclusions
Reliability analyses of the large and complex Outang landslide were performed based on incomplete information using the bootstrap technique. The results indicate that for the Outang landslide, a high level of uncertainty is associated with incomplete information. The obtained reliability indices using bootstrapping are characterized by a long tail consisting of a worst-case scenario with a local extreme reliability index and a small population. The statistical uncertainties are quantified and characterized by a confidence interval at a specified confidence level. Generating a confidence interval of the reliability index and identifying the worst-case scenario enables engineers to make more informed decisions.
The successful implementation suggests that the bootstrap technique and proposed methodology could be useful for quantifying existing statistical uncertainties associated with small sample sets and achieving more meaningful evaluations of landslide reliability. However, the bootstrap technique also has certain limitations when applied to small sample sets. A main concern for small sample sizes (i.e. two or three samples) is that the bootstrap sample will underrepresent the true variability with only a few values from which to select since the observations are frequently repeated, and thus, the bootstrap samples can be repeated.
Disclosure statement
No potential conflict of interest was reported by the authors.
Additional information
Funding
References
- Barbarella M, Fiani M, Lugli A. 2015. Landslide monitoring using multitemporal terrestrial laser scanning for ground displacement analysis. Geomat Nat Haz Risk. 6(5–7):398–418. doi: 10.1080/19475705.2013.863808.
- Borgatti L, Corsini A, Barbieri M, Sartini G, Truffelli G, Caputo G, Puglisi C. 2006. Large reactivated landslides in weak rock masses: a case study from the Northern Apennines (Italy). Landslides. 3(2):115–124. doi: 10.1007/s10346-005-0033-9.
- Bruce DM. 2004. Tails of natural hazards. Phys World. 17(8):25–35. doi: 10.1088/2058-7058/17/8/35.
- Chang KT, Lin ML, Dong JJ, Chien CH. 2012. The Hungtsaiping landslides: from ancient to recent. Landslides. 9(2):205–214. doi: 10.1007/s10346-011-0293-5.
- Chernick MR. 2008. Bootstrap methods. A guide for practitioners and researchers. 2nd ed. Hoboken (NJ): Wiley.
- Corominas J. 1996. The angle of reach as a mobility index for small and large landslides. Can Geotech J. 33(2):260–271. doi: 10.1139/t96-005.
- Crosta GB, Agliardi F. 2003. Failure forecast for large rock slides by surface displacement measurements. Can Geotech J. 40(1):176–191. doi: 10.1139/t02-085.
- Crosta GB, Imposimato S, Roddeman DG. 2003. Numerical modelling of large landslides stability and runout. Nat Hazards Earth Syst Sci. 3(6):523–538. doi: 10.5194/nhess-3-523-2003.
- Deng QL, Fu M, Ren XW, Liu FZ, Tang HM. 2017. Precedent long-term gravitational deformation of large scale landslides in the Three Gorges reservoir area, China. Eng Geol. 221170–183. doi: 10.1016/j.enggeo.2017.02.017.
- Efron B. 1979. Bootstrap methods: another look at the jackknife. Ann Statist. 7(1):1–26. doi: 10.1214/aos/1176344552.
- Geo-Slope International Ltd 2012. Stability modeling with SLOPE/W: an engineering methodology. Calgary (Canada): Geo-Slope International Ltd.
- Giasi CI, Masi P, Cherubini C. 2003. Probabilistic and fuzzy reliability analysis of a sample slope near Aliano. Eng Geol. 67(3–4):391–402. doi: 10.1016/S0013-7952(02)00222-3.
- Gofar N, Rahardjo H. 2017. Saturated and unsaturated stability analysis of slope subjected to rainfall infiltration. Matec Web Conf. 101: 05004. (Vol. EDP Sciences. doi: 10.1051/matecconf/201710105004.
- Hasegawa S, Dahal R, Yamanaka M, Bhandary N, Yatabe R, Inagaki H. 2009. Causes of large-scale landslides in the Lesser Himalaya of central Nepal. Environ Geol. 57(6):1423–1434. doi: 10.1007/s00254-008-1420-z.
- Hu XL, Tang HM, Li CD, Sun RX. 2012. Stability of Huangtupo riverside slumping mass II# under water level fluctuation of Three Gorges Reservoir. J Earth Sci. 23(3):326–334. doi: 10.1007/s12583-012-0259-0.
- Huang RQ, Chen GQ, Guo F, Zhang GF, Zhang Y. 2016. Experimental study on the brittle failure of the locking section in a large-scale rock slide. Landslides. 13(3):583–588. doi: 10.1007/s10346-015-0673-3.
- Hürlimann M, Ledesma A, Martı́ J. 2001. Characterisation of a volcanic residual soil and its implications for large landslide phenomena: application to Tenerife, Canary Islands. Eng Geol. 59(1–2):115–132. doi: 10.1016/S0013-7952(00)00069-7.
- Li DQ, Tang XS, Zhou CB, Phoon KK. 2015. Characterization of uncertainty in probabilistic model using bootstrap method and its application to reliability of piles. Appl Math Model. 39(17):5310–5326. doi: 10.1016/j.apm.2015.03.027.
- Li X, Liao QL, He JM. 2004. In-situ tests and a stochastic structural model of rock and soil aggregate in the Three Gorges Reservoir area, China. Int J Rock Mech Min. 41:702–707. doi: 10.1016/j.ijrmms.2004.03.122.
- Luo Z, Atamturktur S, Juang CH. 2013. Bootstrapping for characterizing the effect of uncertainty in sample statistics for braced excavations. J Geotech Geoenviron Eng. 139(1):13–23. doi: 10.1061/(ASCE)GT.1943-5606.0000734.
- Ma JW, Tang HM, Hu XL, Bobet A, Zhang M, Zhu TW, Song YJ, Ez Eldin MAM. 2017a. Identification of causal factors for the Majiagou landslide using modern data mining methods. Landslides. 14(1):311–322. doi: 10.1007/s10346-016-0693-7.
- Ma JW, Tang HM, Liu X, Hu XL, Sun MJ, Song YJ. 2017b. Establishment of a deformation forecasting model for a step-like landslide based on decision tree C5.0 and two-step cluster algorithms: a case study in the Three Gorges Reservoir area, China. Landslides. 14(3):1275–1281. doi: 10.1007/s10346-017-0804-0.
- Ma JW, Tang HM, Liu X, Wen T, Zhang JR, Tan QW, Fan ZQ. 2018. Probabilistic forecasting of landslide displacement accounting for epistemic uncertainty: a case study in the Three Gorges Reservoir area, China. Landslides. 15(6):1145–1153. doi: 10.1007/s10346-017-0941-5.
- Mojtahedi SMH, Mousavi SM, Aminian A. 2009. A non-parametric statistical approach for analyzing risk factor data in risk management process. J Appl Sci. 9(1):113–120. doi: 10.3923/jas.2009.113.120.
- Most T, Knabe T. 2010. Reliability analysis of the bearing failure problem considering uncertain stochastic parameters. Comput Geotech. 37(3):299–310. doi: 10.1016/j.compgeo.2009.11.003.
- Orchant C, Kulhawy F, Trautmann C. 1988. Reliability based foundation design for transmission line structures: critical evaluation of in situ test methods. Palo Alto (CA): Electric Power Research Institute. Report EL-5507(2).
- Peyret M, Djamour Y, Rizza M, Ritz JF, Hurtrez JE, Goudarzi MA, Nankali H, Chéry J, Le Dortz K, Uri F. 2008. Monitoring of the large slow Kahrod landslide in Alborz mountain range (Iran) by GPS and SAR interferometry. Eng Geol. 100(3–4):131–141. doi: 10.1016/j.enggeo.2008.02.013.
- Singh R, Umrao RK, Singh TN. 2013. Probabilistic analysis of slope in Amiyan landslide area, Uttarakhand. Geomat Nat Haz Risk. 4(1):13–29. doi: 10.1080/19475705.2012.661796.
- Sun GH, Zheng H, Tang HM, Dai FC. 2016. Huangtupo landslide stability under water level fluctuations of the Three Gorges reservoir. Landslides. 13(5):1167–1179. doi: 10.1007/s10346-015-0637-7.
- Tang CL, Hu JC, Lin ML, Angelier J, Lu CY, Chan YC, Chu HT. 2009. The Tsaoling landslide triggered by the Chi-Chi earthquake, Taiwan: insights from a discrete element simulation. Eng Geol. 106(1–2):1–19. doi: 10.1016/j.enggeo.2009.02.011.
- Tang HM, Li CD, Hu XL, Su AJ, Wang LQ, Wu YP, Criss R, Xiong CR, Li YA. 2015. Evolution characteristics of the Huangtupo landslide based on in situ tunneling and monitoring. Landslides. 12(3):511–521. doi: 10.1007/s10346-014-0500-2.
- Tang HM, Liu X, Hu XL, Griffiths DV. 2015. Evaluation of landslide mechanisms characterized by high-speed mass ejection and long-run-out based on events following the Wenchuan earthquake. Eng Geol. 194: 12–24. doi: 10.1016/j.enggeo.2015.01.004.
- Tang HM, Zou ZX, Xiong CR, Wu YP, Hu XL, Wang LQ, Lu S, Criss RE, Li CD. 2015. An evolution model of large consequent bedding rockslides, with particular reference to the Jiweishan rockslide in Southwest China. Eng Geol. 186: 17–27. doi: 10.1016/j.enggeo.2014.08.021.
- Valášková K, Spuchľáková E, Adamko P. 2015. Non-parametric bootstrap method in risk management. Procedia Econom Finance. 24: 701–709. doi: 10.1016/S2212-5671(15)00678-4.
- Wu TH, Watson A. 1998. In situ shear tests of soil blocks with roots. Can Geotech J. 35(4):579–590. doi: 10.1139/t98-027.
- Wu YP, Cheng C, He GF, Zhang QX. 2014. Landslide stability analysis based on random-fuzzy reliability: taking Liangshuijing landslide as a case. Stoch Environ Res Risk Assess. 28(7):1723–1732. doi: 10.1007/s00477-013-0831-x.
- Wu YP, Miao FS, Li LW, Xie YH, Chang B. 2017. Time-varying reliability analysis of Huangtupo Riverside No.2 Landslide in the Three Gorges Reservoir based on water-soil coupling. Eng Geol. 226: 267–276. doi: 10.1016/j.enggeo.2017.06.016.
- Yin YP, Huang BL, Wang WP, Wei YJ, Ma XH, Ma F, Zhao CJ. 2016. Reservoir-induced landslides and risk control in Three Gorges Project on Yangtze River, China. J Rock Mech Geotech Eng. 8(5):577–595. doi: 10.1016/j.jrmge.2016.08.001.
- Zhao LH, Zuo S, Lin YL, Li L, Zhang Y. 2016. Reliability back analysis of shear strength parameters of landslide with three-dimensional upper bound limit analysis theory. Landslides. 13(4):711–724. doi: 10.1007/s10346-015-0604-3.