
 ?Mathematical formulae have been encoded as MathML and are displayed in this HTML version using MathJax in order to improve their display. Uncheck the box to turn MathJax off. This feature requires Javascript. Click on a formula to zoom.
Abstract
China is a major coal producing country, and also one of the countries which has the most serious coal mine accidents around the world. As a result of geological conditions, underground mining is the main way that coal is exploited in China; serious underground disasters and the corresponding fatality rate are much higher than is the case for surface mining. Although safer modern underground mining methods have been introduced across China, accidents still lead to fatalities and the loss of revenue in some mines. It is important to establish a georeferenced coal mine disasters (CMD) database to aid researchers and decision makers in better understanding the spatio-temporal distribution of such accidents across in China. This study has proposed a method to develop a georeferenced spatio-temporal CMD database via a geographic information system (GIS) platform based on statistical data released by the State Administration of Coal Mine Safety (SACMS) for the period between 2000 and 2015. The different levels and spatio-temporal characteristics of coal mining accidents were analyzed, and the space-time scan statistic permutation (STSSP) model was carried out to detect the CMD clusters; and finally, a spatio-temporal cluster analysis of Chinese coal mining accidents in 2000 and 2015 was conducted.
1. Introduction
Coal is the largest and most widely distributed energy resource globally, accounting for 29% of primary consumption (Li and Huang Citation2010). As a result, the systems used for coal mining are both critical infrastructure and key resources for societies and economies. Coal mining has brought tremendous scientific and technological progress and development, which has greatly promoted the development of the global economy. Since the time of the first Industrial Revolution through to the late 20th century, coal has been the most important energy source enabling the development of human science, technology and civilization (Galloway Citation2007, Citation2011; Singer et al. Citation1954). At the same time, however, both underground and surface coal mining carry a significant related disaster risk, frequently defined in engineering and natural sciences as the product of probability and consequences. The risks to society and the environment from various energy technologies occur both in the actual mining process of coal and in all stages of utilization.
According to statistics released by British Petroleum (BP), global coal production between 2000 and 2015 increased from 4,725 million tons to 7,961 million tons, corresponding to a total increase of 68.5% and an average annual growth of 4.9% (BP Citation2017). China produces the highest volume of coal internationally and is also the country where mining disasters are most frequent; at present, coal accounts for about 68% of primary Chinese energy consumption. Data for the last 20 years, however, reveal a turning point in Chinese coal production in 2000 due to changes in the economic situation related to this resource; Chinese coal production decreased between 1996 and 2000, but then increased again between 2000 and 2013 (Niu et al. Citation2015). Annual coal output was 1,384.2 million tons in 2000, 2,364.1 million tons in 2005, 3,428.4 million tons in 2010, and 3,746.5 million tons in 2015, a rapid increase that has ensured Chinese economic and social development (Liu et al. Citation2008; Zhou Citation2012). This resource pattern is also unlikely to change, with coal as a very important strategic resource playing a critical role in China’s future economic and social development. However, because of the complexity of geological and climatic conditions across China, serious natural disasters are also inevitable, including those related to water, fire, gas, coal, dust, pressure and geothermal effects, especially as most coal extraction nationally is via underground mining. The average depth of coal mines in China is also much more than seen elsewhere around the world, and so accidents tend to occur frequently (Zhang et al. Citation2016). The coal mining industry is the most dangerous in China, with the highest number of serious casualties; statistics show that between 1991 and 2010, the total number of deaths due to coal-related activities was 108,697. This is equivalent to more than 6,000 people dying each year from coal mines, more than three times the total number of the other coal producing countries in the world. Indeed, the Chinese annual average death rate per million tons of coal is 3.39, 145 times that seen in the USA (Song and Martin Citation2003), far higher than that of any other country (Li and Zhang Citation2005; Peng, Citation2005).
Investigating the nature of accidents due to coal mining is of great significance to the safe production of this important natural resource. These accidents can be triggered by a range of factors, including natural hazards and technological failures, as well as management and other human errors. Severe accidents are defined as those that pose either a significant potential or actual risk to people, property, and the environment and may have substantial consequences. A number of research projects have been carried out in recent years on such events related to coal mining, including determining correlations between accident rates in mines and differences between sites (Page Citation2009; Sari et al., Citation2004), regional and temporal distributional characteristics (Wang et al., Citation2015; Wen et al., Citation2016; Yin et al., Citation2013), and the causes of accidents and potential control measures that can be applied (Deng et al., Citation2014; Li and Zhai Citation2010). And meanwhile, coal mine safety precautions have also been studied in the context of specific mining accidents, model-based predictive research on death tolls (Lan and Ying Citation2014; Li, Citation2015), and accident visualization (Şalap et al., Citation2009). The development of a comprehensive coal mine disasters (CMD) database will therefore help us to better understand the regional differences in these events, and will also provide information for macro-analyses and decision making. The Paul Scherrer Institute (PSI), for example, carried out extensive analyses of severe accidents in the energy sector based primarily on historical experience, encompassing fossil energy chains including coal, oil, natural and liquefied petroleum gas, as well as hydropower and nuclear (Burgherr and Hirschberg Citation2008; Hirschberg et al. Citation1998, Citation2004). While the Energy Related Severe Accidents Database (ENSAD) was first put together in 1998 and has been subsequently improved. The latter of these (ENSAD) currently contains a total of 24,152 accident records, of which 18,665 were human-induced and the remainder were due to natural disasters and conflicts (160) (Burgherr et al., Citation2012). This database is now considered to be the most comprehensive energy-related disaster compilation globally. Although a number of studies have been carried out in China, including analyses of coal accidents and dust explosions (Zheng et al., Citation2009), production output pressures and seasonal variations in coal mining fatalities (Yu and Chen Citation2013), previous research in this area have been based on simple statistical data. Limited research has been conducted on the temporal and spatial distribution of accidents based on spatial geographic information. Spatio-temporal geographic data comprise a range of multidimensional features including temporal and spatial attributes as the inseparable characteristics of geographical entities that exhibit complicated internal structures and logical relationships (Fu and Cui Citation2003). Such data can be very complex, recording the detailed state of entities both in space and time as well as their variation. Therefore such records can be used to illustrate the correct distribution of objects in the past, as well as in the present and future. These days, in an era of rapid technological development, more and more devices are available to collect this type of data and so volume has also increased rapidly, leading to concomitant difficulties in storage and management. The storage of spatio-temporal data therefore requires the design of management modules as well as the implementation of decisions to do with the working capacity merits of the entire system. This means that data applications can significantly influence system efficiency. In the context of a proposed distributed framework, efficient parallel computing power, storage capacity, high scalability and stability are all key attributes that should be implemented based on previous studies that have investigated the distributed storage of spatio-temporal data (Shi Citation2015). The inherent laws of things can also be considered on the basis of spatio-temporal geographic data, which is an area that has rapidly advanced with the development of computing technology. A number of methods are presently available for analyzing spatio-temporal data: (1) Spatial autocorrelation; (2) Geographical surveys; (3) Clustering and hotspot analyses; and (4) Correlation analyses. These approaches have all proved useful for revealing the internal characteristics and relationships of things, are powerful complements to traditional statistical analyses, and have been hugely significant in large spatio-temporal data studies in 21st century geography. Such approaches have been widely applied across various fields, including epidemiology as well as the study of birth diseases and malaria (Coleman et al. Citation2009; Song et al. Citation2003; Yekti and Tjiong Citation2010), disaster analyses including forest fires (Pereira et al. Citation2015; Vega Orozco et al. Citation2012), and in research on public services and crimes (Ceccato and Dolmen Citation2011; Delmelle et al. Citation2012).
Geographic spatio-temporal data are also of considerable significance to in-depth studies that discuss the internal controlling factors, mechanisms, and countermeasures of coal mining accidents. However, no Chinese database is currently available that could be used for such a spatio-temporal analysis or to address the mechanisms of coal mining accidents. The nature of these incidents remained sensitive and confidential within China until 2000 when the State Administration of Coal Mine Safety (SACMS) began to officially collect statistical data and subsequently make them available to the public. However, as the relatively simple data that is available cannot be applied directly to the study of coal mining accidents, one of the goals of this study was to search for such events over time by applying a space-time model. Data was also manipulated temporally year-by-year using a geographic information system (GIS) framework over the entire time period of this research, between 2000 and 2015. This led to the development of geographic spatio-temporal data of coal mining accidents associated with spatial reference information via GIS, and the subsequent construction of a CMD database that has geographical spatio-temporal data characteristics. The spatio-temporal distribution of disasters was then analyzed using the space-time scan statistic permutation (STSSP) model. The results of this study are of great significance to our understanding of the mechanisms, regional distribution, and prediction of coal mining accidents in China, and also provide important support in the form of a database for the subsequent safety management and policy regulation of mines.
2. Data and methods
2.1. Data
China lacks a comprehensive disaster accidents database, and relevant data were not published before 1994 for political reasons. This means that severe accidents that occurred within the coal mining industrial chain were largely underestimated prior to this time because of a restrictive reporting policy. Indeed, up until the early 1980s, this information was considered a state secret. In recent years, although the government has acknowledged the existence of an annual death toll somewhere in the region of 10,000 people within coal and other mines. Western analysts have suggested that these data may still be underestimates due to inadequate investigation of nationwide industrial conditions. As noted above, the number of fatalities in Chinese coal mining has previously been unclear although this situation has improved in recent years with the annual publication of the China Coal Industry Yearbook, especially subsequent to 1993. Qualitative estimates can also be generated for earlier years via comparisons with historical trends in other industrialized countries. This means that statistics from the China Energy Technology Program can be applied for statistical evaluation of the national coal chain (Hirschberg et al. Citation2003), while available data for the period between 2000 and 2008 comprises just the annual total fatalities (i.e., severe and minor accidents) reported by the State Administration of Work Safety (SAWS). This situation improved considerably around 2005 when the SACMS began to release official statistical data collected subsequent to 2000. The published database therefore includes a total of 8,146 coal mining accidents reported since 2000; example query data for 2010 are presented in .
Table 1. Example SACMS coal mining accident data format for 2010.
The release of such information () makes the construction of a coal mine-related spatio-temporal database possible. Such a database encapsulates both spatial and temporal information, and therefore embodies concepts in relation to these kinds of data. Although the accidents recorded by the SACMS are accurate to the county level, even the town level, and there is no precise associated latitudinal and longitudinal coordinates. The data sources used in the construction of the CMD presented here are listed in .
Table 2. Basic data used to construct a CMD database for China.
Administrative areas within China are basically divided into four levels, provincial level administrative regions, prefectural level administrative regions, county level administrative regions and township level administrative regions. Thus, as of November 2017, the regions below the provincial level (not including Hong Kong, Macao and Taiwan) that make up China include 34 provincial level administrative regions comprising 23 provinces, 5 autonomous regions, 4 municipalities, and 2 special administrative regions. In addition 334 prefectural-level administrative regions, including 294 cities, 7 regions, 30 autonomous prefectures, and 3 leagues, and 2,876 county-level administrative regions comprising 986 municipal districts, 363 county-level cities, 1,356 County, 117 autonomous counties, 49 banners, 3 autonomous banners, 1 special zone, and 1 forest zone, as well as 39,862 township level administrative regions comprising 2 district offices, 8,105 streets, 20,883 towns, 10,720 townships, 989 ethnic townships, and 152 villages, 1 ethnic village in the Inner Mongolia Autonomous Region. There are also 662,479 village level administrative districts governed by non-administrative autonomous organizations comprising 559,702 village committees and 102,777 neighborhood committees in China (Ministry of Civil Affairs of the People’s Republic of China, 2017).
2.2. Methods
The data used in this study are based on a statistical summary of all coal mining accidents that occurred between 2000 and 2015 as recorded by the SACMS and include time, location, death toll, and the cause of the accident (Example shown in ). This latter category was extracted based on detailed accident information, while time is accurate to the hour, and spatial data is accurate to county level. A visualization tool for these spatio-temporal data was then created using the Python language in EXCEL; a county-level administrative boundary map of China and a distribution map of coal resources were used as constraints and to place all known accidents into a spatial context to obtain a vector that comprises spatial reference information. This step enabled us to visualize Chinese coal mining accidents spatio-temporally and to intuitively illustrate their characteristics. The spatio-temporal variation of coal mining accidents in recent years was then explored analytically.
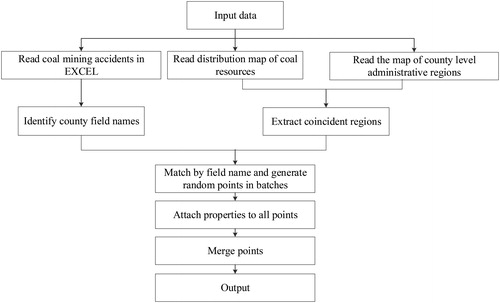
Thus, a spatio-temporal data visualization tool was compiled in EXCEL based on GIS secondary development. A flow chart that summarizes this process is shown in . Based on the GIS visualization tool, the distribution map of coal resources and county administrative map of China is used as constraints, the coincident regions of them are extracted, and the county field name of the regions is used as the matching field in EXCEL data to generate geographic spatio-temporal data of coal mine accidents ().
Figure 1. The technological process used to construct a CMD database for China.
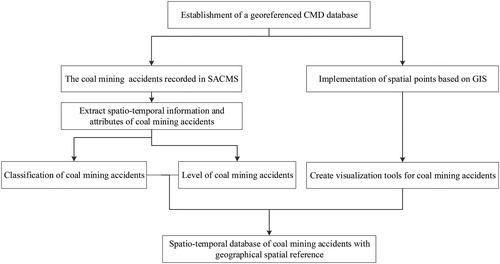
Figure 2. The visualization tool batch compilation process used to describe coal mining accidents.
3. Results
One outcome of this study is that all coal mining accidents recorded by the SACMS between 2000 and 2015 were plotted onto a spatial map () using county-level administrative boundaries and coal resource distribution maps for China.
Figure 3. Map to show the spatial distribution of (a) coal resources and (b) coal mining accidents between 2000 and 2015.
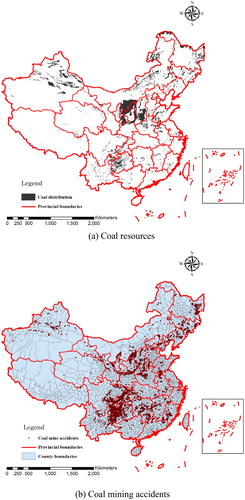
The data presented in show that Chinese coal resources are mainly distributed in Shanxi, Inner Mongolia, Shaanxi, Xinjiang and other provinces (regions), followed by Guizhou, Ningxia, Anhui, Yunnan, Henan, Shandong, Heilongjiang and other provinces (regions). It is also the case that the majority of coal mining accidents occurred in these regions. Thus, while this resource has contributed to significant growth and promoted the rapid development of science, technology, and the social economy, it has also led to disasters in these regions.
3.1. Classification and different levels of coal mining accidents
All coal mining accidents recorded by the SACMS between 2000 and 2015 were aggregated in EXCEL, and timings, locations, number of deaths, and causes were extracted. These accidents were then classified according to existing Chinese schemes and grading standards.
3.1.1. Classification of Chinese coal mining accidents in China
It is generally the case that accidents with more serious consequences are the ones that tend to generate greater public interest and often lead to controversy. This is one reason why the ENSAD database and this investigation focus on severe accidents, even when the sum total of numerous smaller incidents with minor consequences can also be substantial. However, to date, there is no consensus definition of the term “severe accident” available in the literature. Thus, within the framework of the PSI ENSAD database, an accident is considered to be severe if it is characterized by one, or more, of the consequences listed below.
According to the regulations issued by the State Bureau of Coal Mine Safety Supervision (2008), coal mining incidents can be divided into roof, blasting, flood, gas, transportation, fire, electrical and other accidents, defined as follows:
Roof accidents. This category includes spalling, roof caving, wall caving, roof support collapse, rockburst, pit landslide, collapses and other accidents. Mine floor accidents are also regarded as roof accidents;
Gas accidents. This category includes gas (coal dust) explosions (burning), coal (rock) and gas outbursts, gas poisoning and asphyxia;
Electromechanical accidents. This category includes incidents that are caused by electromechanical devices (including installation), encompassing accidents that occur during installation, maintenance, and the processes of commissioning transportation equipment;
Transportation accidents. This category includes accidents that occur during transportation facility operation;
Blasting accidents. This category includes accidents caused by explosions or misfires;
Fire accidents. This category includes accidents caused by the spontaneous combustion of coal and gangue or external causes (i.e., coal spontaneous combustion, lack of an open flame, and escaping harmful gas poisoning);
Flood accidents. This category includes accidents caused by surface water, water in the goaf, geological water and industrial water, as well as accidents caused by mud and quicksand, and;
Other accidents. This category includes accidents that cannot be characterized based on the seven categories listed above. Non-gas-related asphyxiation and poisoning that are the result of other factors such as carbon monoxide are included within this category.
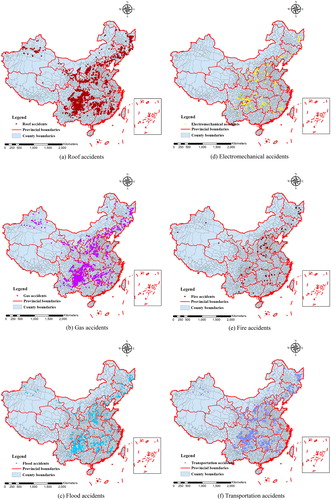
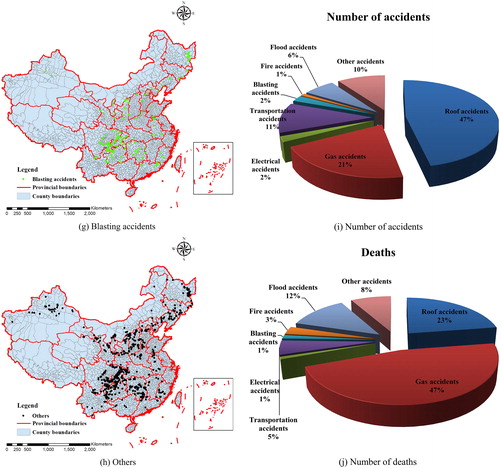
The data presented in reveal that roof and gas accidents account for 68% of all coal mining incidents. These events not only comprise the largest proportion of such accidents, the destruction and loss caused by these accidents are also the most serious, and the consequent death toll accounts for 70% of the total. The frequency of roof accidents within this category is also the highest overall, accounting for 47% of total coal mining accidents. The death toll due to gas accidents is also the highest, accounting for the same percentage of the overall total. The sum total of fire, electrical, and blasting accidents comprise less the 2% of the overall total number of coal mine accidents, and the number of deaths caused by these accidents did not exceed 3% of the total number of accidents. Similarly, the number of flood-related accidents accounts for 6% of the overall total, encompassing 12% of total deaths, while both of the number of accidents due to transportation and other accidents accounts for about 10% of the overall total, The number of deaths caused by other accidents is 8%, while 5% are due to transportation. In terms of the ratio between the number of events and their associated death toll, the data shows that each of the gas, fire and water-related disaster killed about six, eight and five people, respectively, while the average number of deaths in other kinds of accidents was between one person and two people. Thus, in terms of fatality rate, fire and flood accidents are self-evidently harmful and have a significant impact on coal mining safety in China. The construction of a CMD database is therefore important to study the mechanism of these accidents in China, and provides results on the basis of large-scale analysis to address national coal mining security problems.
Figure 4. Map (a–h) to show the spatial distribution and descriptive statistics for coal mining accidents including (i) number of accidents and (g) number of deaths.
3.1.2. Different levels of coal mining accidents in China
According to regulations on reporting and investigation of production safety accidents issued by the State Council of the People's Republic of China (Citation2007), accidents can be broadly divided into a number of grades according to the resultant casualties or direct economic losses:
Extraordinarily serious accidents. This category comprises accidents which cause the death of more than 30 people, serious injuries to more than 100 people (including acute industrial poisoning), or direct economic losses that add up to more than 100 million yuan;
Major accidents. This category comprises accidents which cause the deaths of between 10 and 30 people, serious injuries to between 50 and 100 people, or direct economic losses that range between 50 million yuan and 100 million yuan;
Larger accidents. This category comprises accidents which cause the deaths of between 3 and 10 people, serious injuries to between 10 and 50 people, or direct economic losses that range between 10 million yuan and 50 million yuan;
General accidents. This category comprises accidents which cause the deaths less than three people, serious injuries to less than ten people, or direct economic losses less than 10 million yuan.
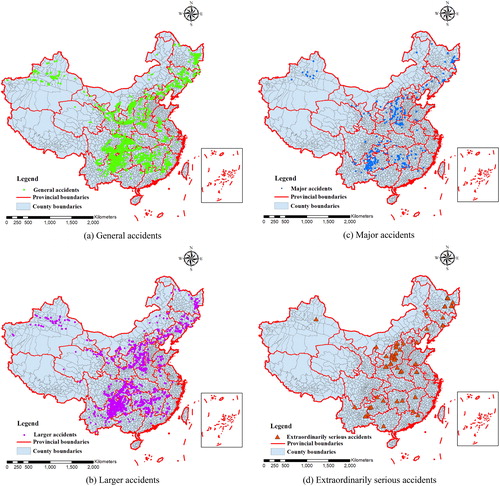
Because of a general absence of information regarding the direct economic losses that result from coal mining accidents, death toll was used in this study as a standard to classify and grade incidents. Thus, the data presented in reveal that general accidents are the dominant type of Chinese coal mining accidents, accounting for 73% of the overall total, followed by larger accidents that encompass 22% of the total and extraordinarily serious and major accidents that collectively account for about 5% of the total. Although extraordinarily serious accidents only occur at a frequency of 1%, they nevertheless cause 13% of total deaths, while major accidents occur at a frequency of 4% and cause 21% of the total number of accidents. Therefore, although there are few extraordinarily serious and major accidents, once they do happen they tend to have very serious consequences. Data show that an average of 52 people die as the result of each Chinese mining-related extraordinarily serious accident, while an average of 15 people die from each major accident. These events are therefore great threats to Chinese coal mining workers.
Figure 5. Map (a–d) to show the spatial distribution and descriptive statistics for all levels of coal mining accidents including (e) number of accidents and (f) number of deaths.
3.2. Spatio-temporal characteristics of Chinese coal mining accidents
The analysis of the spatial and temporal distribution of coal mine accidents is of great significance to the prevention of coal mine accidents in a specific time or area. For example, in space, the distribution of coal mine accidents in the provincial level or even the county level can be analyzed, which is of great reference to the implementation of preventive measures for coal mine accidents by local governments all over China, in time, the changes of coal mine accidents in each year, every month or even every day can be analyzed, to identify the key points of the coal mine accidents on each time scale, at the same time, the trend of coal mine accidents can also be analyzed. Thus, the information of key points in time and space can be provided for the prevention of coal mine accidents in China.
3.2.1. Spatial characteristics
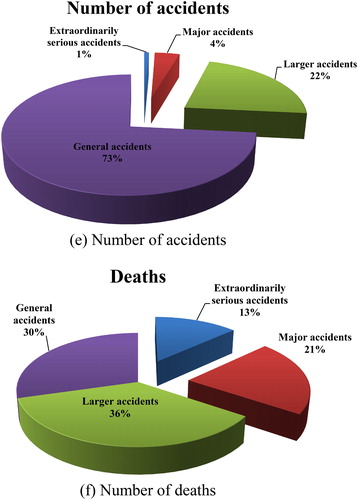
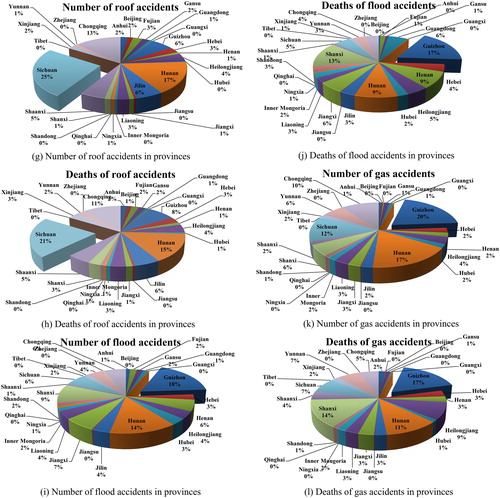
The data presented in show that the number of coal mining accidents in Guizhou, Hunan, Sichuan and Chongqing provinces accounted for 9.22%, 15.80%, 19.63% and 11.58% of the total number of coal mine accidents in China from 2000 and 2015, respectively. While the corresponding number of deaths that resulted from these accounted for 12.73%, 11.80%, 10.89% and 6.85% of the total across China due to such accidents, respectively. Data also reveal that the number of coal mine accidents in other provinces (regions) is small, encompassing no more than 5% of the total number nationally, but that the number of deaths in Heilongjiang and Shanxi provinces is ralatively large, encompassing 7.33% and 10.64% of the total, respectively.
Figure 6. Maps to show the spatial distribution of number of accidents (a) and deaths (b) due to Chinese coal mining accidents broken down by provinces (c and d).
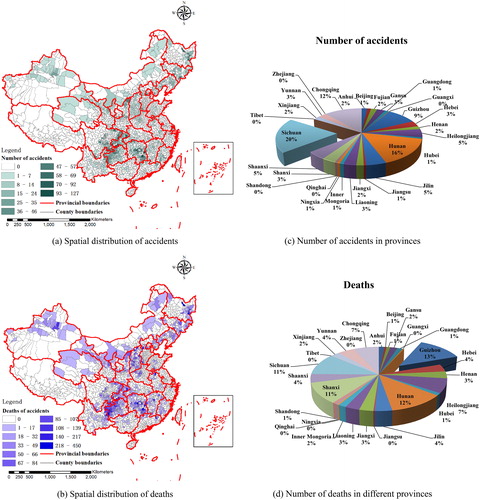
The data presented in show that there were 963 roof accidents in Sichuan Province between 2000 and 2015, accounting for 25.28% of the total number of such incidents, followed by Hunan Province where there were 633 roof accidents accounting for 16.62% of the total number. Similarly, 490 and 234 roof accidents occurred in Chongqing and Guizhou provinces, accounting for 12.86% and 6.14% of the total number, respectively, showing that these regions are the main places where such incidents take place. The distribution of deaths caused by roof accidents is also broadly consistent with the frequency of these incidents; data show that Sichuan Province experienced the largest number of such deaths across China between 2000 and 2015 (1,073), accounting for 21.16% of the total, followed by Hunan, Chongqing and Guizhou provinces, where the number of deaths caused by such incidents were 780, 558 and 404, respectively, accounting for 15.38%, 11% and 7.97% of the overall total. The total number of roof accidents between 2000 and 2015 was 3,809, leading to 5,071 deaths overall.
Figure 7. Maps (a–f) to show the spatial distribution of number of accidents and deaths due to Chinese coal mining accidents broken down by categories (g–l).
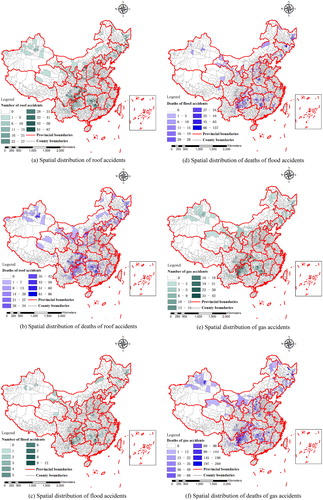
In the course of this study, Guizhou Province experienced the largest number of natural gas accidents across China, with 332 accounting for 19.77% of the national total, followed by Hunan Province where the number was 292, accounting for 17.39% of the overall total. Sichuan, Chongqing and Yunnan also experienced additional natural gas accidents, with 207, 172 and 103, respectively, compared to other regions, encompassing 12.33%, 10.24% and 6.13% of the total accidents respectively. The province that experienced the largest number of deaths due to natural gas accidents was also Guizhou, where the number of deaths was 1,787, accounting for 16.95% of the total death toll, while the 93 natural gas accidents that took place in Shanxi Province led to 1,504 deaths. This province is ranked second out of all provinces in the country, accounting for 14.27% of the total national deaths because although these accidents seldom take place they are nevertheless very serious. In the event of a gas explosion or leakage, the consequences tend to be unbearable to contemplate, and usually cause huge losses. Such accidents in Shanxi Province have tended to be extraordinarily serious and major accidents; the rate of occurrence of these incidents is low, but the number of resultant deaths is far greater than other places. At the same time, the number of deaths caused by gas accidents in Hunan, Sichuan and Yunnan provinces as well as in Chongqing City cannot be ignored. During the study period, the number of deaths due to gas accidents in Hunan Province reached 1,193 accounting for 11.32% of the total number of deaths from such incidents. There were 1,679 gas accidents between 2000 and 2015, leading to a total of 10,541 deaths.
The incidence rate of flood accidents was much lower than that of either roof or gas accidents across China in 2000–2015. There were 92 floods in Guizhou Province, accounting for 17.62% of the total, followed by Hunan, Shanxi, Jiangxi, Chongqing and Sichuan provinces where 72, 49, 35, 32 and 30 such incidents occurred, respectively. The province that experienced the largest number of deaths due to gas accidents over the time period of this study, there were 475 people in Guizhou, encompassing 17.37% of the total number of deaths due to flooding, followed by Shanxi Province where the death toll reached 359, accounting for 13.13% of the overall total. Although the total number of flood-related accidents in these regions was not greater than 100, far lower than the number of roof or gas accidents, the resultant loss of life was nevertheless significant. The total number of flood accidents reported over this time period was 522, leading to 2,735 deaths in 2000–2015.
3.2.2. Temporal characteristics
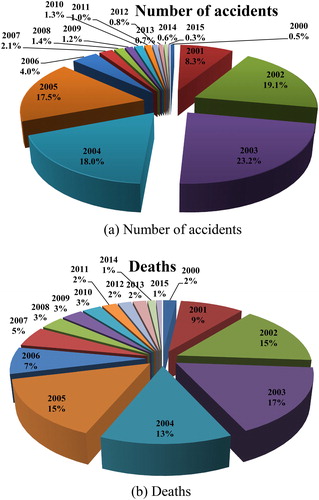
As noted above, although the SACMS began to officially collect statistical data and subsequently provide records available to the public, for political reasons and in order to conceal mining activity, the number of accidents was incompletely counted between 2000 and 2002 and remains unpublished. However, according to report on the study of coal mine safety management in China issued by China Labour Bulletin, the national economy has maintained a growth rate of more than 9% since 2003 while annual consumption of this raw material has increased by between 7% and 9%. This increase in consumption demand led to a concomitant upsurge in coal production between 2001 and 2003, with a cumulative increase of 7.38 tons nationwide, an increase of nearly 74%. Although coal production reached 19.5 tons in 2004, an increase of 2.5 tons compared with 2003, this rapid growth in output occurred in tandem with more and more shocking mine safety accidents. As shown in , the number of such accidents nationwide has been high throughout the country since 2000, but a peak was reached in 2003; over the 6 years from 2000 to 2005, 15,999 people died as a result of mining accidents, accounting for 71.2% of the total number of deaths. The number of coal mining accidents was 7,053, accounting for 86.6% of the total number from 2000 to 2015.
Figure 8. The number of coal mining accidents and resultant deaths in China between 2000 and 2015.
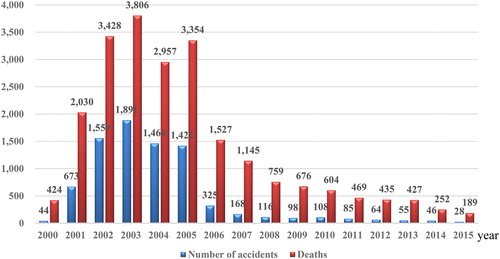
The number of coal mining accidents in China became the focus of media attention in the 21st century both at home and abroad, and has become a major issue confronting the central government. Thus, once the new central government came to power (March 2003), strong measures were taken to curb and reduce the number of coal mining accidents (China Labor Bulletin, 2006). However, initially, the central government's goal of enhancing coal mine safety at the beginning of each year was difficult to achieve; coal mine safety control efforts was the largest in 2005. As of January 18th, a deputy director of the SAWS announced plans to reduce the number of these deaths by 3% and completely end the number of coal mining accidents that result in more than 100 deaths during an Information Office of the State Council news conference. Less than a month later, on February 14th, 2005, a gas explosion occurred in Sunjiawan coal mine in Liaoning that killed 214 miners. This was the second largest such accident to kill more than 100 people over the course of the 68 years since the founding of the People's Republic of China. As shown in the number of deaths in this accident was second. As shown in , there were 1,422 coal mining accidents in 2005, accounting for 15% of the total number of such accidents between 2000 and 2015, a total death toll of 3,354 people, accounting for 17.5% of total deaths. Compared with 2004, although the number of accidents decreased by 8.2% in 2005, the death toll fell only by 0.7%. Thus, while it is noteworthy that extraordinarily serious and major accidents reached a peak during this year, it is also necessary to point out that although the central government had apparently acted to rectify coal mines and curb the number of accidents via high pressure policies, there is also a serious issue where false reports are filed about safety accidents, especially in cases when fewer than 10 people are involved. In order to avoid punishment, mine owners often conceal the true nature of these events using various means, and so real data regarding Chinese coal mining accidents and deaths is till mysterious. As shown in , the government has made great efforts to renovate coal mines, resulting in a significant reduction in accidents and deaths since 2005. At the same time, however, the production safety situation in mines remains a major issue and the number of serious accidents has not yet been effectively curbed. These problems in coal mining and in other key industrial fields remain serious, and further efforts should still be made to maintain supervision.
Figure 9. The total number of coal mining accidents and resultant deaths in China between 2000 and 2015.
The trend of roof accidents is basically consistent with the total number of coal mine accidents nationwide. Accidents of this type reached a peak in 2003, but have gradually reduced subsequently as the management and remediation of coal mines has been strengthened; indeed, roof accidents have fallen fastest of all types of incidents, reduced to just five in 2015. This trend also highlights the significant progress that has been made in China’s underground mining technology. Gas accidents were also the most common in 2003 (320); in addition to time, gas accidents did not follow the same trend as roof accidents, but despite their reduced volatility, gas incidents increased during 2005–2013. This shows that the controllability of gas accidents is not stronger than roof accidents; thus, even in the light of great developments in Chinese mining technology, accidents still cannot be completely avoided. The total number of flood accidents reached 96 in 2003, and then tended to decrease.
3.3. A spatio-temporal cluster analysis of coal mining accidents in China between 2000 and 2015
3.3.1. Spatio-temporal clustering of coal mining accidents
The scan statistic is one method that can be used for detecting clusters; this approach can be applied to accurately analyze spatio-temporal clustering, as well as to test for statistical significance. Initially introduced by J.I. Naus, this technique was subsequently studied by others before being implemented by Martin (Citation1997) who developed the software SaTScan™ and subsequently integrated a number of spatio-temporal extensions (Martin et al. Citation2005). Originally applied in health sciences, the Martin scan statistic has been utilized more recently to find and test the statistical significance of different kinds of spatial-based clustering event phenomena that can be identified based on their spatial coordinates, for example in forestry and environmental sciences (Pereira et al. Citation2015; Coulston and Riitters Citation2003; Tonini et al. Citation2009; Li et al. Citation2016; Vega Orozco et al. Citation2012).
Scanning analysis enables the generation of a space-time two-dimensional cylindrical active window that is based on a map that reflects possible areas of aggregation. The height of each cylinder is therefore a proxy for the time dimension (t), while the area of each base reflects the geographical spatial dimension (i.e., s = π*r2). Thus, by continuously varying the radius and time period in the center of each geographic unit, the whole cylindrical window can be changed dynamically along with region and time, while a window scan the whole region, the number of events falling inside and outside the circular window is calculated. In order to identify the most likely clusters within a sample, the probability that a specific window contains a higher number of observed cases compared to those that would be expected is then evaluated using a likelihood ratio (LR) test.
The number of cases (cst) observed when applying the STSSP model using a space-time cylinder with a base, s, and a height, t, is then compared to what would be expected if no such interaction were to exist (Martin et al. Citation2005), assuming that an event in area s observed at time t has the same probability across all periods. The expected number of cases (ust) can therefore be calculated, as follows:(1)
(1)
In this expression, C denotes the total number of observed cases over the entire study area and throughout the time period. It follows that the generalized LR (GLR) formula for the spatio-temporal cluster statistic is as follows:(2)
(2)
The STSSP model was applied using the software SaTScan™ in this analysis to perform a spatio-temporal clustering analysis of the 8,146 Chinese coal mining accidents recorded between 2000 and 2015. In this study, a minimum scann time was one year, and the maximum time was 50% of the study time; thus, subsequent to 999 Monte Carlo tests, clusters with a Pvalue less than 0.05 were selected as spatio-temporally valid representations of Chinese accidents ().
Table 3. STSSP results.
The data generated using SaTScan™ and presented in reveal the presence of eight distinct spatio-temporal clusters of mining accidents between 2000 and 2015 in China. The minimum radius (Rmin) of the scanning window in this analysis is 30.88 km, while the maximum (Rmax) is 1,174.65 km; data show that coal mining accidents have mainly been clustered within Yunnan, Guizhou provinces in southwestern China, Guangdong, Fujian provinces in southeastern China, and Shanxi, Chongqing provinces in central China, as well as in northwestern China and in three northeastern provinces.
Figure 10. Map to show spatio-temporal clusters of Chinese coal mining accidents.
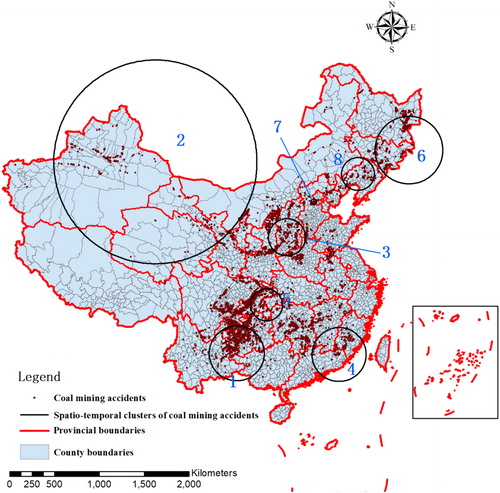
A total of 8,146 Chinese coal mine accidents comprising those related to roofs, gas, blasting, electrical, transportation, fire and flooding, as well as other kinds of incidents were collected together within a CMD database. Some of these accidents are caused by natural factors, and some are the result of human factors. Indeed, from the perspective of accident controllability, the human factor in transportation accidents can be controlled via the management and enhancement of employee safety awareness, while roof, gas, fire, flood and other accidents are mainly the result of natural disasters. Although this latter type of accidents can be effectively controlled, they are nevertheless inevitable; while underground coal mining technology has made great progress in China after decades of development, it still remains difficult to avoid accidents due to natural factors just via management and the strengthening of staff awareness. Identifying areas where these eight accident types have high incidence rates is therefore of great significance if we are to propose effective measures for controlling accidents in different regions, classifications, and distributions.
3.3.2. Spatio-temporal characteristics of typical coal mining accidents
A space-time scanning analysis of the eight key accident types was then performed. However, because it becomes difficult to cluster data for one year as the number of cases is reduced, a month was chosen as the minimum time unit for analysis. This means that the maximum time was 50% of the total study time, and subsequent to 999 Monte Carlo tests, clusters with a Pvalue less than 0.05 are selected as spatio-temporal representations of typical Chinese coal mining accidents.
The data presented in show that roof accidents are grouped into six spatio-temporal clusters. The first, cluster one, has a scanning radius of 281.26 km, central coordinates of 26.065900 N and 107.534000 E, a clustering time range between January 1, 2003, and December 31, 2003, and encompasses Yunnan and Guizhou provinces in southwestern China. Cluster two has a scanning radius of 1,361.74 km, central coordinates of 44.591000 N and 91.114800 E, a clustering time range between January 1, 2001, and December 31, 2001, and encompasses northwestern China, while cluster three has a scanning radius of 267.53 km, central coordinates of 24.199800 N and 115.878000 E, clustering time range between January 1, 2004, and December 31, 2004, and encompasses Guangdong, Fujian, and Hunan provinces in southeastern China. Similarly, cluster four has a scanning radius is 28.58 km, central coordinates of 39.861500 N and 115.732000 E, a clustering time range between January 1, 2003, and December 31, 2003, and encompasses the southwestern suburbs of Beijing, while cluster five has a scanning radius of 391.09 km, central coordinates of 42.879600 N and 130.308000 E), a clustering time range between January 1, 2005, and December 31, 2006, and encompasses northeastern China. Finally, cluster six has a scanning radius of 180.86 km, central coordinates of 30.618100 N and 109.400000 E, a clustering time range between January 1, 2005, and December 31, 2012, and encompasses Hubei and Chongqing provinces in central China.
Table 4. STSSP results for roof accidents.
The data presented in reveal that blasting accidents form a single spatio-temporal cluster with a scanning radius of 260.18 km, central coordinates of 25.926700 N and 107.521000 E, and a clustering time range between July 1, 2003, and September 30, 2003. This cluster encompasses Yunnan and Guizhou provinces in southwestern China.
Table 5. STSSP results for blasting accidents.
The data presented in show that flood accidents also comprise a single spatio-temporal cluster with a scanning radius of 159.84 km, central coordinates of 30.619400 N and 103.431000 E, and a clustering time range between June 1, 2004, and August 31, 2004. This cluster encompasses Sichuan Province in southwestern China.
Table 6. STSSP results for flood accidents.
The data presented in show that gas accidents comprise a single spatio-temporal cluster with a scanning radius of 205.97 km, central coordinates of 27.087700 N and 107.366000 E, and a clustering time range between April 1, 2003, and December 31, 2003. This cluster encompasses Guizhou Province in southwestern China.
Table 7. STSSP results for gas accidents.
The data presented in show that transportation accidents comprise a single spatio-temporal cluster with a scanning radius of 184.06 km, central coordinates of 26.215000 N and 105.727000 E, and a clustering time range between January 1, 2003, and December 31, 2003. This cluster encompasses Yunnan and Guizhou provinces in southwestern China.
Table 8. STSSP results for transportation accidents.
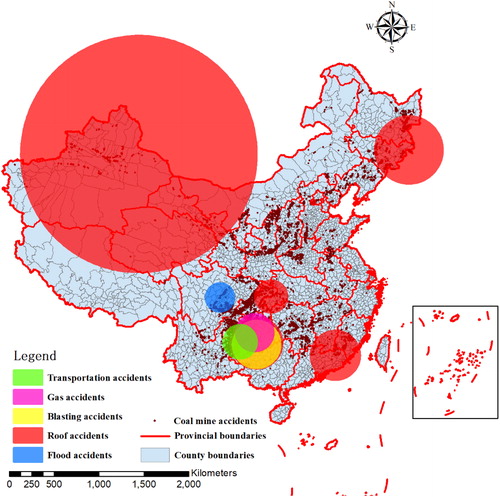
Statistically significant clusters were considered in this analysis and plotted via space-time scanning; however, the absence of mapped groupings does not necessarily mean that these remained undetected, rather that they lacked statistical significance. The spatio-temporal scanning results of this study reveal eight clusters of coal mining accidents within China, mainly located in the northwestern region, as well as in the northeastern region and Yunnan, Guizhou, Sichuan provinces in southwestern China, Guangdong, Fujian, Hunan provinces in southeastern China, and Hubei, Chongqing provinces in central China (). Significant spatio-temporal clusters of roof, blasting, flood, gas, and transportation accidents were revealed by this analysis but not for electrical or fire accidents (). Data show that the spatio-temporal distribution of roof accident clusters is generally consistent with those of all coal mining incidents on the map, reflecting the fact that these events are the main source of accidents overall and that the distribution characteristics of both are largely similar. The fact that data also revealed spatio-temporal clusters of blasting, flood, gas and transportation accidents in southwestern China suggests that this area is characterized by a high rate of occurrence of various kinds of incidents. As Guizhou Province encompasses most of this region, this area should be selected as a key zone for the study of future accidents of this type.
Figure 11. Map to show spatio-temporal clusters of all kinds of coal mining accidents.
4. Conclusion
A CMD database for China is presented in this study on the basis of records collated by the SACMS. These data enabled a spatio-temporal analysis of coal mining accidents using GIS approaches and STSSP model, as well as discussion of the migration of coal mining accident center of gravity within China between 2000 and 2015. The results of this study lead to a number of clear conclusions.
For space, the largest number of coal mining accidents between 2000 and 2015 occurred in Guizhou, Hunan, Sichuan and Chongqing provinces, accounting for 9.22%, 15.8%, 19.63% and 11.58% of the overall total, respectively. The death tolls in these regions encompassed 12.73%, 11.8%, 10.89% and 6.85% of the overall total, respectively, while the rate in other provinces (districts) was less than 5% of the total. For time, data show that the number of such incidents reached a peak in 2003 and that there were 15,999 fatalities between 2000 and 2005, accounting for 71.2% of the total number of deaths. These were due to a total of 7,053 coal mining accidents nationwide, 86.6% of the overall total. The number of accidents has decreased since 2003, as the management of mines within China has improved and facilities have been renovated.
Roof and gas incidents are the most serious kind of coal mining accidents and account for 68% of the overall total. The death toll due to these events encompasses 70% of all mortalities due to coal mining accidents in China between 2000 and 2015. And data show that roof accidents mainly occurred in Sichuan, Hunan, Chongqing, and Guizhou provinces, while accidents related to gas were dominant in Guizhou, Hunan, Sichuan, Chongqing, and Yunnan provinces between 2000 and 2015. Over the same time period, flood accidents mainly occurred in Guizhou, Hunan, Shanxi, Jiangxi, Chongqing, and Sichuan provinces.
Data show that clusters of Chinese coal mining accidents are mainly located in northwestern and northeastern China as well as in Yunnan, Guizhou provinces in southwestern China, Guangdong, Fujian provinces in southeastern China, and Shanxi, Chongqing provinces in central China. Spatio-temporal clusters of roof, blasting, flood, gas, and transportation-related accidents can be clearly identified, with the latter four categories mainly distributed in southwestern China. A single cluster of roof-related accidents can also be identified within this region, contributing to the perception that this part of China is a high-risk area for these kinds of accidents. Indeed, high-risk areas for typical coal mining accidents can be identified using spatio-temporal clustering and enable data bearing on the prevention and treatment of these incidents across China. And the center of gravity of coal mining accidents within China between 2000 and 2015 encompasses Henan, Shaanxi, Hubei, and Chongqing provinces in the center of the country, while the geometric center of coal resources falls within western Henan Province. Data show that coal mining accidents within China have tended to migrate from the southwest towards the northeast both from 2003 to 2006 and from 2009 to 2015.
Accurate latitudes and longitudes are presently unavailable for individual coal mining accidents within China because of missing data. Thus, spatio-temporal information as well as other accident attributes accurate to the county-level were extracted in order to develop a GIS-based CMD database for China. Although the spatial accuracy of this CMD database is not high, it does meet the requirements for research analyses to be carried out on coal mining accidents at the county level. It is clear that such accidents can be caused by natural conditions, including the surrounding geological environment, as well as because of mine management. The CMD database presented in this paper can be combined in future work with spatial autocorrelation analyses, geographic detection, and other spatio-temporal methods of analysis to more comprehensive understand the causes and mechanisms of Chinese coal mining accidents. It is hoped that more effective solutions can therefore be provided for enhancing both the scientific production of coal and the management of mining safety.
Disclosure statement
No potential conflict of interests was reported by the authors.
References
- British Petroleum (BP). 2017. BP statistical review of world energy - June 2017. Beijing, China: China Statistics Press.
- Burgherr P, Eckle P, Hirschberg S. 2012. Comparative assessment of severe accident risks in the coal, oil, and natural gas chains. Reliability Eng System Safety. 105:97–103.
- Burgherr P, Hirschberg S. 2008. Severe accident risks in fossil energy chains: A comparative analysis. Energy. 33(4):538–553.
- Ceccato V, Dolmen L. 2011. Crime in rural Sweden. Appl Geography. 31(1):119–135.
- Coleman M, Coleman M, Mabuza AM, Kok G, Coetzee M, Durrheim DN. 2009. Using the SaTScan method to detect local malaria clusters for guiding malaria control programmes. Malar J. 8(1):68.
- Coulston JW, Riitters KH. 2003. Geographic analysis of forest health indicators using spatial scan statistics. Environ Manage. 31(6):764–773.
- Delmelle EM, Li S, Murray AT. 2012. Identifying bus stop redundancy: A GIS-based spatial optimization approach. Computers Environment & Urban Systems. 36(5):445–455.
- Deng Q, Wang Y, Liu M. 2014. Statistical analysis and enlightenment on coal mine accident of China from 2001–2013 periods. Coal Technol. 33:73–75.
- Fu H, Cui W. 2003. Hypergraph-based spatio-temporal data mining of geographical information. Computer Eng Appl. 39:78–80.
- Galloway RL. 2007. A history of coal mining in Great Britain. Montana, USA: Kessinger publishing.
- Galloway RL. 2011. Annals of coal mining and the coal trade: The invention of the steam engine and the origin of the railway. South Carolina, USA: Nabu Press.
- Hirschberg S, Burgherr P, Spiekerman G, Cazzoli E, Vitazkova J, Cheng L. 2003. Comparative Assessment of Severe Accidents in the Chinese Energy Sector–China Energy Technology Program. PSI Report No. 03-04, Paul Scherrer Institute, Villigen PSI, Switzerland.
- Hirschberg S, Burgherr P, Spiekerman G, Dones R. 2004. Severe accidents in the energy sector: Comparative perspective. J Hazardous Mat. 111(1–3):57–65.
- Hirschberg S, Spiekerman G, Dones R. 1998. Severe accidents in the energy sector. PSI Report No. 98-16, Paul Scherrer Institute, Villigen PSI, Switzerland.
- Lan JY, Ying Z. 2014. Application of the Gray Markov SCGM(1,1)c model to prediction of accidents deaths in coal mining. Int Scholarly Res Notices. 2014:1–7.
- Li M. 2015. Study on cause analysis of coal mine accidents and prediction model based on Grey Theory. Yunnan, China: Kunming University of Science and Technology.
- Li Y, Huang H. 2010. Current status and trend of coal mine safety in world's main coal mining countries. China Safety Sci J. 20:158–165.
- Liu M, Zhao W, Wei K, et al. 2008. Statistical analysis on coal and gas outburst accident and prevention measures in China coal mines in 2006. Coal Technology. 27:79–81.
- Li S, Yang S, Liu Y, Zhang D, Liu X. 2016. Spatio-temporal clustering characteristics of drought, heavy rain and hot waves in the Beijing-Tianjin-Hebei region during 1960–2013. Scientia Geographica Sinica. 21:17–24.
- Li Q, Zhai G. 2010. Analysis of coal mine accidents and control measures in recent five years. Coal Mine Modernization. 2010:1–3.
- Li Y, Zhang L. 2005. Comparison of coal mine safety between China and the US. China Safety Sci J. 15:45–47.
- Martin K. 1997. A spatial scan statistic. Commun Stat. 26(6):1481–1496.
- Martin K, Richard H, Jessica H, Renato A, Farzad M. 2005. A space-time permutation scan statistic for disease outbreak detection. PLoS Med. 2(3):e59.
- Niu C, Shi L, Xiao L, Zhai P, Wu S, Zhao Y. 2015. Study on accidents classification of coal mine from 2001 to 2013. Safety in Coal Mines. 46:208–211.
- Page K. 2009. Blood on the coal: The effect of organizational size and differentiation on coal mine accidents. J Safety Res. 40(2):85–95.
- Peng C. 2005. Analysis of three reasons of coal mine safety gap in China and America. Beijing, China: China Safety Production Daily.
- Pereira MG, Caramelo L, Orozco CV, Costa R, Tonini M. 2015. Space-time clustering analysis performance of an aggregated dataset. Environmental Modelling & Software. 72:239–249.
- Şalap S, Karslıoğlu MO, Demirel N. 2009. Development of a GIS-based monitoring and management system for underground coal mining safety. Int J Coal Geology. 80(2):105–112.
- Sari M, Duzgun HSB, Karpuz C, Selcuk AS. 2004. Accident analysis of two Turkish underground coal mines. Safety Sci. 42(8):675–690.
- Shi Z. 2015. Spatio-temporal data distributed storage research. Jiangxi, China: Jiangxi University of Science and Technology.
- Singer C, Holmyard EJ, Hall AR. 1954. A history of technology. Oxford, UK: Oxford University Press.
- Song Z, Jiang N, Yang Z. 2003. Study on the basic information of stratum movement and mechanics on prediction and controlling heavy accidents in coal min. Beijing, China: China Coal Industry Publishing House.
- Song C, Martin K. 2003. Power evaluation of disease clustering tests. Int J Health Geogr. 2(1):9.
- The State Council of the People's Republic of China. 2007. Order No. 493: Regulations on Reporting and Investigation of Production Safety Accident, Beijng, China.
- Tonini M, Tuia D, Ratle F. 2009. Detection of clusters using space-time scan statistics. Int J Wildland Fire. 18(7):830–836.
- Vega Orozco C, Tonini M, Conedera M, Kanveski M. 2012. Cluster recognition in spatial-temporal sequences: The case of forest fires. Geoinformatica. 16(4):653–673.
- Wang X, Hou L, Su L. 2015. Statistical analysis and enlightenment on major accident in coal mine of China in 2011–2014. Risk Mngmnt. 2015:26–29.
- Wen H, Chen B, Fei J. 2016. Study on basic characteristic and occurrence regularity of accidents in Chinese coal mines during 2010–2014. Coal Technol. 35:310–312.
- Yekti W, Tjiong GP. 2010. A space-time scan statistic to detect cluster alarms of dengue mortality in Indonesia, 2005. MSS. 12(1):27–30.
- Yin W, Fu G, Yuan S. 2013. Study on basic characteristics and occurrence regularity of major gas explosion accidents in Chinese coal mines during 2001–2012. China Safety Sci J. 23:141–146.
- Yu H, Chen H. 2013. Production output pressure and coal mine fatality seasonal variations in China, 2002–2011. J Safety Res. 47:39–46.
- Zhang Y, Wang W, Gao X, Wu Y. 2016. The fractal characteristics of the temporal-spatial distribution of coal mine accidents in China from 2000 to 2014. J Geoinformation Sci. 18:1191–1198.
- Zheng Y-P, Feng C-G, Jing G-X, Qian X-M, Li X-J, Liu Z-Y, Huang P. 2009. A statistical analysis of coal mine accidents caused by coal dust explosions in China. J Loss Prevention Process Industries. 22(4):528–532.
- Zhou H. 2012. The research and application of death rate per million. Beijing, China: China University of Mining and Technology.