
 ?Mathematical formulae have been encoded as MathML and are displayed in this HTML version using MathJax in order to improve their display. Uncheck the box to turn MathJax off. This feature requires Javascript. Click on a formula to zoom.
Abstract
To reveal the dynamic behavior of soil anchorage landslide and the mechanical feature of anchors at different frequencies, a shaking table test was performed on a 1:7 scale soil anchorage landslide. Actual seismic wave measured from the Wenchuan earthquake, sinusoidal waves with different frequencies were applied to the model. The acceleration response of the anchorage landslide in frequency domain was analyzed, and the strain distribution of anchors at 1.15 Hz sinusoidal wave and 3.45 Hz sinusoidal wave were investigated separately. The testing results indicate that the anchorage landslide is sensitive not only to higher frequencies (near the natural frequency of the landslide) at low loading amplitude but also to ultra-low frequencies at high loading amplitude. At ultra-low frequency 1.15 Hz sinusoidal wave, when the loading amplitude is low and medium (0.05-0.6 g), the bottom anchor bears greater force. But when the loading amplitude is high (0.8 g), the top anchor bears most of the anchorage force. At 3.45 Hz sinusoidal wave that near the natural frequency of the landslide, no matter how the loading amplitude, the top anchor plays significant role, especially at higher loading amplitude (0.3-0.6 g).
1. Introduction
The most western mountainous areas in China are areas with high seismic intensity. Once earthquake occurs, massive landslides follow, which often lead to the blocking of rivers, interruption of traffic and serious danger to human life and property. In 2008, approximately 56,000 landslides and rock-falls were directly triggered by the Wenchuan earthquake (Mw = 7.9) (Cui et al. Citation2011; Wasowski et al. Citation2011; Huang et al. Citation2013). In 2010, more than 2,036, landslides with a total coverage area of 1.194 km2 were triggered by the Yushu earthquake (Mw = 6.9) (Xu and Xu Citation2014; Lin et al. Citation2015a). In 2013, the Minxian-Zhangxian earthquake (Mw = 5.9) triggered at least 2,330 slope failures (Xu et al. Citation2014). Ensuring the dynamic stability of slopes and landslides has become a major concern to geotechnical engineers.
Anchor is a widely used supporting structure in slope engineering due to its safety, economy, and convenience for construction. In seismic damage investigation, such as the Wenchuan earthquake, Tangshan earthquake, and Hanshin-Awaji earthquake, the anchorage design project was found to be still effective, and the slopes reinforced with anchors remained intact after the earthquake (Guan Citation2009; Ren et al. Citation2016). Therefore, obtaining a comprehensive understanding of the dynamic behavior of anchors in slopes and providing important information for aseimic design are of great importance, especially for earthquake-prone zones.
Traditionally, the seismic stability and aseismic design of slopes and landslides have been analyzed by the pseudo-static method, which simplifies the earthquake loading as an inertial force in static equilibrium (Munwar and Sivakumar Citation2009; Lin et al. Citation2015b), but the assumption cannot directly reflect the dynamic behavior of soil and the dynamic mechanical feature of supporting structures. In recent years, with the rapid development of the centrifuge technique and shaking table apparatus, it has become possible to study the seismic response of slopes and structures under real stress–strain conditions in a laboratory (Toyohiko et al. Citation2011; Yang et al. Citation2014; Srilatha et al. Citation2016). Ota et al. (Citation2010) performed centrifuge model tests and examined the characteristics of dynamic and residual loads on anchors installed in slopes subjected to seismic loads. Jiang et al. (Citation2010) conducted a series of shaking table tests to study the dynamic behavior of soil slopes and anchoring prevention mechanisms under seismic loading, and they found that anchorage structure could effectively suppress the acceleration amplification of the slope. Hao et al. (Citation2015) studied the axial force distribution of anchors in a slope during earthquake by performing shaking table tests and concluded that the top anchors were subjected to a greater anchoring force. Lin et al. (Citation2017) also studied the seismic performance of anchors in rock slopes by shaking table test with a conclusion that a larger value of axial force was observed at the anchor located at the bottom of frame beam. However, only limited studies are available on the dynamic behavior of soil anchorage landslides and the mechanical characteristics of anchors at different frequencies.
In fact, frequency is one of the important parameters in seismic waves. Even at the same loading amplitude and duration time, the responsive intensity of soil and the mechanical characteristics of structures are different under seismic waves with different frequencies (Beresnev et al. Citation1995; Nguyen and Gatmiri Citation2007; Vincenzo and Janusz Citation2007; Singh and Ramaswamy Citation2008). Liu et al. (Citation2014) studied the seismic response of rock slope at different frequencies by shaking table model test. However, few researches are on soil slope subjected to different frequencies, especially for soil anchorage landslide. In order to study how frequency influences the soil anchorage landslide, and how anchors work at different frequencies, a large-scale shaking table model test was performed on a soil anchorage landslide. Dynamic analyses on the dynamic property of landslide soil and the strain distribution of anchors at different frequencies were performed based on the measurements made during the test.
2. Shaking table model test
The anchorage landslide model test was conducted using a shaking table to simulate earthquake motion. The acceleration of the landslide and the strain response of anchors were measured and analyzed. The law of similitude describing the relationship between the prototype and model, and the test set-up are discussed in the following sections.
2.1. The prototype landslide and the law of similitude
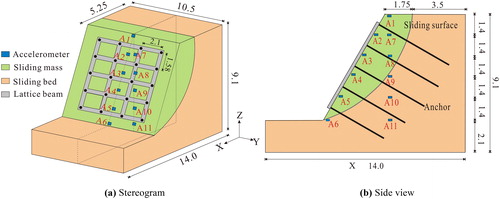
The shaking table test model was designed based on a loess soil landslide (with an angle of 30°and a height of 7 m), which was supported by an anchor lattice beam structure. Five rows of anchors were placed in the landslide, and the spacing between anchors was 2.10 m (length) × 1.58 m (width), as shown in .
Figure 1. Layout of the accelerometers (unit: m).
According to the dimensions and capacity of the shaking table system, the similarity ratio of geometric size was determined to be 1:7. Mass density, geometric size, and gravitational acceleration were taken as control variables, and input acceleration and time were set as input control variables in the shaking table test. The similarity laws for the anchorage landslide can be derived based on the Buckingham π theory (Iai Citation1989; Lin et al. Citation2015a). The scaling parameters between the prototype and model were deduced as shown in .
Table 1. Law of similitude of the prototype landslide and model landslide.
2.2. Shaking table test model and materials
Shaking table test was performed on a large-scale shaking table established at Xi’an University of Architecture and Technology, China, which was provided by two electrical pumps and three diesel pumps. The size of the table was 4.1 m × 4.1 m, and the capacity of the table was 20 t. The loading frequency was between 0.1 and 50 Hz. The maximum acceleration was ±1.5, ±1.0, and ±1.0 g in the X, Y, and Z directions, respectively, where g is the gravitational acceleration.
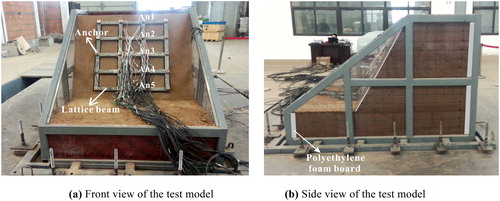
The model landslide was installed in a rigid model box with an inner dimension of 2.1 m (length) × 1.5 m (width) × 1.3 m (height). Organic glass was used for the left and right sides of the model box to observe the deformation of the landslide. Before the construction of the model, vaseline was smeared evenly on the glass to reduce the friction between the soil and the glass. Small cobble stones were pasted at the bottom of the box to reduce the relative displacement between the soil and the box. Besides, to reduce or avoid the energy reflection of the model box to the incident waves, polyethylene foam boards (50 mm thick) were pasted on both the front and back of the box, as shown in .
Figure 2. The anchorage landslide model before the test.
The sliding bed and sliding mass were constructed by filling with loess soil obtained from Xi’an, China. Direct shear tests were performed on the soil specimens obtained from the model landslide. The shearing strength parameters of the soil are shown in . The sliding surface was designed to be circular arc, which was determined by the limit equilibrium method. Sliding soil was simulated by placing a layer of stoving soil (2–3 mm thick) on the bed. The cohesive force and internal friction angle of the sliding soil were 5.8 kPa and 19°, respectively.
Table 2 Results of the direct shear tests on soil specimens.
Glazed and stress relieved steel with a diameter of 6 mm was used to simulate the anchor in shaking table test. Anchor mortar was mainly formed by water, cement and sand at a ratio of 0.3:0.2:1. The lattice beam was constructed by pouring the C10 concrete over an aluminum bar reinforcement cage (reinforcement type: 4Φ6). The section size of the lattice beam was 40 mm ×50 mm. The C10 concrete was mainly formed by water, cement, sand and stone at a ratio of 0.80:1.00:2.96:3.76. After the landslide model was finished, anchor holes (20 mm in diameter) were first drilled perpendicularly into the landslide using a steel pipe according to the design length of each anchor. Second, the steel anchor was placed and centered in the hole. Finally, the hole was filled with the prepared mortar. After 28 days of natural maintenance, the prefabricated lattice beam was installed on the landslide surface and was fixed to anchors with nuts. The final anchorage landslide model is shown in .
2.3. Monitoring scheme
Points A1–A11 (shown in ) are marked in the prototype landslide. Points A1, A2, A3, A4, A5, and A6 are at the landslide surface. Point A7, A8, A9, A10, and A11 are located in the landslide body along the vertical direction. To monitor the acceleration response of these points in the landslide, eleven accelerometers (Type: PCB-33B40) were installed in the model landslide along the two directions, denoted as A1–A11, which corresponds to the points in prototype landslide. Additionally, one accelerometer A0 was placed on the table to record the inputting acceleration in shaking table test.
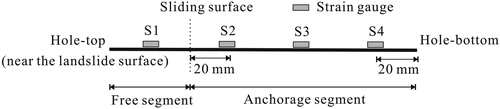
In order to observe the dynamic local strain of anchors during shaking, four strain gauges (S1-S4, Type: BE-120) were glued to anchor steels, as shown in . S1 is located in the midpoint of the free segment. S2 is about 20 mm from sliding surface. S3 is located in the midpoint of the anchorage segment, and S4 is about 20 mm from the hole-bottom.
Figure 3. Layout of the strain gauges on the steel anchor.
2.4. Loading scheme
Because horizontal earthquake is the major cause of structure destruction and it can significantly reduce the slope stability, all waves were loaded in the horizontal X direction.
Three different seismic waves were applied to the test: Wenchuan wave recorded from the Wolong station during the Wenchuan earthquake in China, 2008, 5 Hz sinusoidal wave, and 15 Hz sinusoidal wave. The time history and Fourier spectrum of Wenchuan wave are shown in . Based on the time similarity constant (Ct = 4.3) between the prototype landslide and model landslide (shown in ), the timeline of Wenchuan wave was compressed in shaking table test. The peak acceleration of Wenchuan wave and 15 Hz sinusoidal wave in shaking table tests were adjusted to 0.05, 0.1, 0.15, 0.2, 0.3, 0.4, and 0.6 g, respectively. The peak acceleration of 5 Hz sinusoidal wave in shaking table tests was adjusted to 0.05, 0.1, 0.15, 0.2, 0.3, 0.4, 0.6, 0.8, and 1.0 g, respectively. To obtain the natural frequency of the anchorage landslide model, white noises with the peak acceleration of 0.035 g were interspersed after the acceleration loading amplitude was changed. The loading scheme in the test is shown in .
Figure 4. The acceleration time history and the Fourier spectrum of Wenchuan wave.
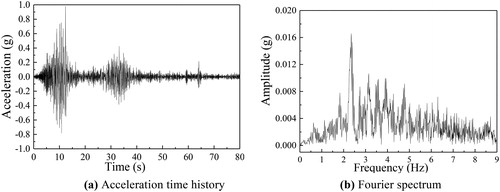
Table 3 Loading scheme in the test.
3. Results and discussion
3.1. Deformation behavior of the soil anchorage landslide model
After each excitation, cracks appeared in the anchorage landside model were recorded. It was found that cracks occurred mainly at the bottom part and top part of the landslide, shows the details of cracks in the landslide model.
Figure 5. Cracks occurred in landslide model during the test.
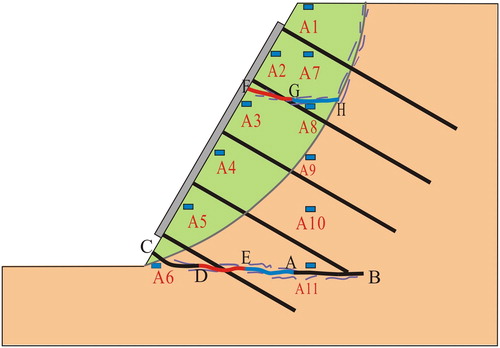
The bottom part: At the loading amplitude of 0.1 g, a horizontal crack A-B occurred at the bottom of the landslide. At 0.15 g, a shear crack C-D (about 5 cm long) appeared near the landslide toe. At 0.4 g, the crack C-D was extended to point E and accompanied with some hairline cracks. At 0.6 g, the horizontal crack ‘C-D-E-A-B’ was interconnected. At 0.8 g and 1.0 g, the crack ‘C-D-E-A-B’ produces a significant shear stress concentration zone around the bottom anchor, and the soil around cracks became an elastoplastic area,
The top part: during 0.15 g and 0.3 g, there were some hairline cracks at the top part of sliding surface. At 0.4 g, crack F-G occurred between accelerometer A2 and A3. At 0.6 g, the crack F-G was extended to point H, and the upper part of the sliding mass became a linked deformation part. At 0.8 g, the linked deformation part was disconnected from the sliding surface.
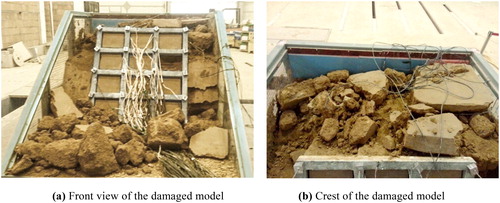
shows the deformation model after 1.0 g. The soil of the whole crest and the outside soil beyond the lattice beam were broken, and large areas of block-form soil fallen to the table, whereas there were seldom serious cracks and damage in the middle part that supported by the anchor lattice beam structure. It can be seen that the anchorage structure has a good seismic performance, which is similar to investigations in the Wenchuan earthquake and Hanshin-Awaji earthquake.
Figure 6. The deformation model after 1.0 g.
3.2. Natural frequency of the soil anchorage landslide
Natural frequency can reflect the effect of seismic waves on anchorage landslide. In this work, the natural frequency of the anchorage landslide can be determined by Transfer Function Method based on the acceleration response in landslide under white noises. The transfer function can be determined as EquationEq. (1)
(1)
(1) .
(1)
(1)
In which, is the cross-power spectral density function between the acceleration response in landslide model and the acceleration response on shaking table;
is the self-power spectral density function of acceleration response on shaking table. The natural frequency can be determined by amplitude analysis method based on the results of transfer function
(Lin et al. Citation2015a). A typical curve of transfer function
of the prototype anchorage landslide under W-0 is shown in . Note that all measurements, natural frequencies, accelerations, acceleration amplitudes, strains, and other results are presented hereafter in prototype anchorage landslide unless otherwise noted.
Figure 7. Transfer function under W-0.
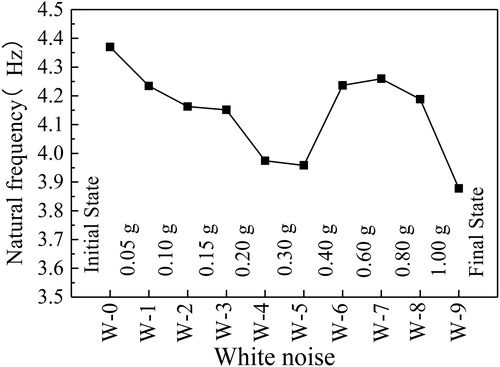
shows the change of natural frequency and damping ratio of the prototype anchorage landslide. During the loading amplitudes of 0.05 and 0.3 g, the natural frequency gradually decreases from 4.43 to 3.96 Hz with the increase of loading amplitude. Such phenomenon reflects that dynamic shear modulus of soil decreases. However, after the loading amplitude of 0.4 g, the natural frequency suddenly increases from 3.96 to 4.20 Hz, which is due to the fact that the active anti-sliding and anti-seismic effects of the anchorage structure are strengthened under stronger earthquake. During the loading amplitudes of 0.6 and 0.8 g, based on the test phenomenon of model tests(see ), although the landslide is supported by anchorage structure, cracks in landslide are increasingly prominent after high loading amplitudes, consequently, the natural frequency slightly decreases under strong earthquake. After the loading amplitude of 1.0 g, the landslide is severely destroyed, and the natural frequency decreases to 3.88 Hz that smaller than the initial natural frequency.
Figure 8. Natural frequency of the anchorage landslide.
3.3. Acceleration Fourier spectrum of the anchorage landslide
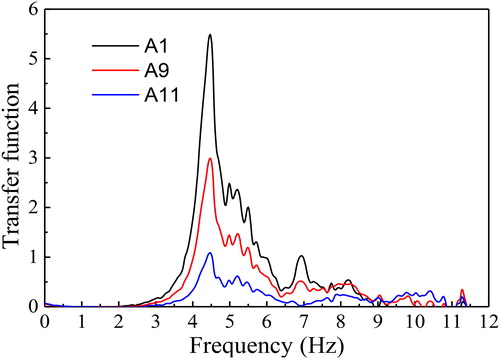
To analyze the acceleration behavior of the anchorage landslide in frequency domain, the Fourier transform is used in this article. shows the acceleration Fourier spectrum of accelerometer A1 (near the crest), A9 (in the middle) and A11 (at the bottom) under Wenchuan waves at different loading amplitudes.
Figure 9. Acceleration Fourier spectrum of accelerometers under Wenchuan waves at different loading amplitudes.
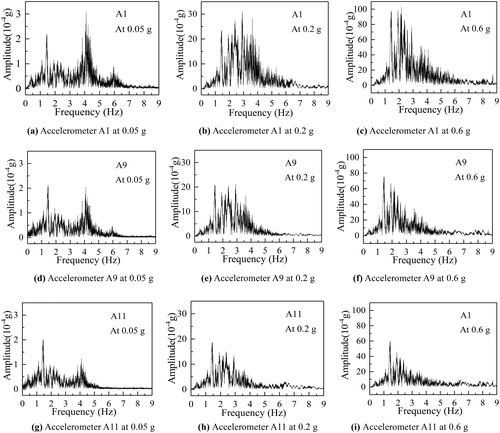
Apparently, the characteristic of the acceleration response is much different from that of the input seismic wave (shown in ). It is because the spectrum composition of input seismic wave is changed after propagating through the anchorage body. At 0.05 g (), the predominant acceleration frequency is concentrated in the frequency bands of 1.15–1.84 Hz and 3.45–4.60 Hz. At 0.2 g (), the predominant frequency is concentrated in 1.15–3.91 Hz. At 0.6 g (), the predominant frequency is concentrated in a lower and narrower frequency band 1.15–2.76 Hz. It can be seen that the anchorage landslide has a filtering effect on high frequencies and amplifies low frequencies. As the loading amplitude increases, the filtering effect tends to be more evident, and the predominant acceleration frequency of seismic wave is concentrated in a lower and narrower frequency band. In other words, the anchorage landslide is sensitive to higher frequency that near the natural frequency of the anchorage landslide at low loading amplitude; however, with the increase of loading amplitude, it is more sensitive to lower frequency band.
To better understand the dynamic behavior and deformation characteristics of the anchorage landslide, the acceleration behavior of the landslide and the strain behavior of anchors at 1.15 Hz sinusoidal wave (ultra-low frequency) and 3.45 Hz sinusoidal wave (near the natural frequency) are discussed in the following sections.
3.4. Acceleration behavior analysis at different frequencies
Peak ground acceleration (PGA) amplification factor is widely used to evaluate the acceleration of landslide. The pseudo-static method for seismic design is developed based on PGA amplification factor. In this work, PGA amplification factor is defined as the ratio of the peak value of the acceleration response in model landside to that on shaking table. The PGA amplification factor distributions of prototype anchorage landslide at 1.15 Hz sinusoidal wave and 3.45 Hz sinusoidal wave are shown in . shows the relationships between the PGA amplification factor and the loading amplitude at 1.15 Hz sinusoidal wave and 3.45 Hz sinusoidal wave, from which the following conclusions can be drawn:
Figure 10. PGA amplification factor distribution of landslide.
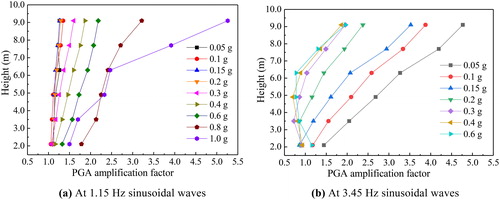
Figure 11. Relationship between PGA amplification factor and the loading amplitude.
No matter whether at 1.15 Hz sinusoidal wave or 3.45 Hz sinusoidal wave, the PGA amplification factor increases along the height of landslide and reaches a maximum at the top of the soil landslide. It is inferred that reinforcing effect at the top of landslide should be enhanced to avoid or reduce the deformation of soil, especially in the areas of high seismic intensity.
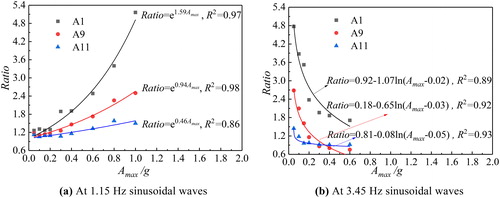
At 1.15 Hz sinusoidal wave, the PGA amplification factor exhibits an increasing trend with the increase of loading amplitude. The relationship between the PGA amplification factor and the loading amplitude at 1.15 Hz sinusoidal wave can be described by the following formula:
, where RATIO refers to the PGA amplification factor, Amax refers to the loading amplitude, and a is the fitting parameter. The fitting curves and fitting parameter a for each measuring point are presented in . The absolute value of a reflects the increasing speed of the PGA amplification factor with the increase of loading amplitude. Generally, the PGA amplification factor at the top increases more quickly than that at the bottom.
Contrarily, at 3.45 Hz sinusoidal wave, the PGA amplification factor presents a decreasing trend. The relationship between the PGA amplification factor and the loading amplitude can be described by the following formula:
By comparing the PGA amplification factors of accelerometers at 1.15 Hz sinusoidal wave and the PGA amplification factors at 3.45 Hz sinusoidal wave, it is concluded that at lower loading amplitude (0.05–0.2 g), the acceleration response of the landslide at 1.15 Hz sinusoidal wave is stronger than that at 3.45 Hz sinusoidal wave. However, with the increase of the loading amplitude, the acceleration response of the landslide at 1.15 Hz sinusoidal wave is greater than that at 3.45 Hz sinusoidal wave.
In summary, the anchorage landslide is sensitive not only to higher frequencies that near the natural frequency under lower loading amplitude but also sensitive to ultra-low frequencies under high loading amplitude, which is consistent with the conclusion in Section 3.3. Therefore, in areas of high seismic intensity, it is necessary to select a wider range of seismic waves for checking the seismic design of landslides, not just the field artificial wave.
3.5. Dynamic response of anchors at different frequencies
To conveniently analyze the strain distribution of anchors from top to bottom, the mean peak strain of the four local measuring points (S1, S2, S3, and S4, shown in ) during shaking is considered as the strain of each anchor. Because the anchorage landslide is symmetrical, only anchors in the third column are analyzed in this article. The anchors in the third column, from top to bottom, denoted as An1 (the top anchor that near the crest), An2, An3, An4, and An5 (the bottom anchor that near the toe, shown in ). and show the peak strain of anchors in the same column at 1.15 Hz sinusoidal wave and at 3.45 Hz sinusoidal wave.
Figure 12. Strain of anchors in the same column at 1.15 Hz sinusoidal wave.
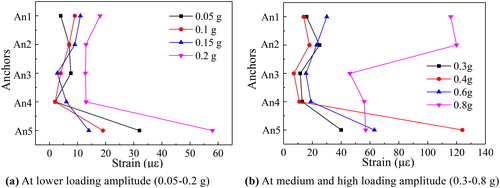
Figure 13. Strain of anchors in the same column at 3.45 Hz sinusoidal wave.
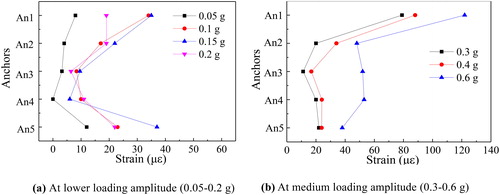
At ultra-low frequency 1.15 Hz sinusoidal wave, when the loading amplitude is lower (0.05–0.2 g), the strain distribution of anchors from top to bottom presents as the ‘L’-type, as shown in . It can be seen that the strain of the bottom anchor An5 is much greater than those of the other anchors An1, An2, An3, and An4. For example, at 0.05 g, the strain of the bottom anchor is approximately eight times the strain of the top anchor. With the increase of loading amplitude, at medium loading amplitude (0.3–0.6 g), the strain of each anchor increases at different levels compared with those under lower loading amplitudes, but the strain distribution of anchors in each layer still presents as the ‘L’-type, shown in . Thus, at ultra-low frequency 1.15 Hz sinusoidal wave, the bottom anchor is subjected to greater anchorage force at low and medium loading amplitude, which is similar to that under static loading. In project design, it is necessary to strengthen the bottom anchor.
At 0.8 g, the strains of anchors An1 and An2 are rapidly increased, while the strain of the bottom anchor decreases dramatically, as shown in . Such phenomenon can be explained as follows: at 0.8 g, the uncoordinated movement between the top sliding mass and the bottom part increases exceedingly, in addition to the rapid development of deformation in the top part ( ), the strain distribution of the anchorage structure is readjusted. To prevent the damage zone in the top sliding mass separating from the stable part, the strains of anchors An1 and An2 are sharply increased. The strain of the bottom anchor An5 at 0.8 g slightly decreases compared with those at 0.4 and 0.6 g, which can be explained from the test phenomenon of landslide model: crack ‘C-D-E-A-B’ (at the bottom of the landslide model shown in ) produces a significant shear stress concentration zone around the bottom anchor, and the soil around cracks become an elastoplastic area, consequently, the anchoring force of anchor An5 was reduce to some extent. At 1.0 g, the strain of anchors dramatically increases, and some strain gauges are inoperative, thus, there are no strain data in .
At 3.45 Hz sinusoidal wave that near the natural frequency of the anchorage landslide, when the loading amplitude is lower (0.05–0.2 g), the strain distribution presents as the ‘C’-type, shown in . It can be seen that compared to the strain distribution of anchors at 1.15 Hz (), the top anchor is vulnerable to 3.45 Hz at the equal loading amplitude. With the increase of loading amplitude, at medium loading amplitude (0.3–0.6 g), the strain of top anchor An1 is greatly increased, while the bottom anchor is barely increased. Consequently, the strain distribution is changed from the ‘C’-type to the ‘г’-type (). For example, at 0.3 g, the strain of the top anchor is about four times the strain of the bottom anchor. It can be seen that at higher frequencies that near the anchorage landslide, both the bottom anchor and the top anchor is subjected to a greater anchorage force, and the top anchor plays more and more important role with the loading amplitude. Thus, the top anchor is more likely to be damaged at higher frequency waves, and it requires a high tensile strength to ensure the stability of landslides in earthquake-prone areas.
4. Conclusions
To reveal the dynamic behavior of anchorage landslide at different frequencies and to provide important information for aseismic design, a soil model landslide supported with anchor lattice beam structure was carried out based on shaking table test. The dynamic behavior of anchorage landslide including spectrum characteristics under Wenchuan wave, acceleration response at different frequencies, dynamic strain distributions of anchors at different frequencies, and deformation behavior was investigated effectively. Based on the previous analysis, several conclusions are reached as follows:
Spectrum component of seismic wave is changed after propagating through the anchorage body. The soil anchorage landslide has a filtering effect on high frequencies and amplifies low frequencies. As the loading amplitude increases, the filtering effect tends to be more evident, and the predominant acceleration frequency of seismic wave is concentrated in a lower and narrower frequency band.
At the ultra-low frequency 1.15 Hz sinusoidal wave, the PGA amplification factor exhibits an increasing trend with the increase of loading amplitude. Contrarily, at 3.45 Hz sinusoidal wave (near the natural frequency of the landslide model), the PGA amplification factor presents a decreasing trend. As a whole, the soil anchorage landslide is not only sensitive to higher frequencies that near the natural frequency at lower loading amplitude but is also sensitive to ultra-low frequencies at high loading amplitude.
At 1.15 Hz sinusoidal wave, when the loading amplitude is low and medium, the bottom anchor bears greater anchoring force at low and medium loading amplitude, which is similar to the strain distribution of anchors under static loading. Whereas when the loading amplitude is high, the top anchor bears greater anchoring force. At 3.45 Hz sinusoidal wave, no matter how the loading amplitude is, the top anchor plays significant role, especially under high loading amplitude.
In actual earthquake, the frequency range and the amplitude of real seismic wave cannot be easily determined. Therefore, in areas of high seismic intensity, it is necessary to select a wider range of seismic waves for checking the seismic design of anchorage landslide, not just the field artificial wave.
During the design process, in addition to satisfying the pseudo-static method, it is necessary to strengthen the bottom anchor and the top anchor. Furthermore, it is suggested that soil nails or short anchors should be densely driven into the landslide toe to retard the propagation of an elastoplastic area that occurred in the toe. Short anchors should be vertically driven into the crest of the landslide, or advanced plants should be implanted to suppress the separation between the top soil and the stable part.
Disclosure statement
No potential conflict of interest was reported by the authors.
Additional information
Funding
Related Research Data
References
- Beresnev IA, Wen KL, Yeh YT. 1995. Seismological evidence for nonlinear elastic ground behavior during large earthquakes. Soil Dyn Earthq Eng. 14(2):103–114.
- Cui P, Chen XQ, Zhu YY, Su FH, Wei FQ, Han YS, Liu HJ, Zhuang JQ. 2011. The Wenchuan Earthquake (May 12, 2008), Sichuan Province, China, and resulting geohazards. Nat Hazards. 56(1):19–36.
- Guan Z. 2009. Investigation of the 5.12 Wenchuan Earthquake damages to the Zipingpu Water Control Project and an assessment of its safety state. Sci China Ser E-Technol Sci. 52(4):820–834.
- Huang R, Zhao J, Ju N, Li G, Lee ML, Li Y. 2013. Analysis of an anti-dip landslide triggered by the 2008 Wenchuan earthquake in China. Nat Hazards. 68(2):1021–1039.
- Hao JB, Yao J, Huang YT, Li JH. 2015. Analysis of dynamic response of soil slope reinforced by anchors and lattices subjected to dynamic loads. J Earth Sci Environ. 37:93–100. (in Chinese)
- Iai S. 1989. Similitude for shaking table tests on soil-structure-fluid model in 1-g gravitational field. Soils Found. 29(1):105–118.
- Jiang LW, Yao LK, Hu ZX, Yang QH. 2010. Experimental study on slope’s superficial dynamic effect and anchoring prevention mechanism under earthquake disturbance. J Sichuan Univ (Eng Sci Ed). 42(5):164–174. (in Chinese)
- Lin Y-L, Li Y-X, Yang G-L, Li Y. 2017. Experimental and numerical study on the seismic behavior of anchoring frame beam supporting soil slope on rock mass. Soil Dyn Earthq Eng. 98:12–23.
- Lin YL, Leng WM, Yang GL, Li L, Yang JS. 2015a. Seismic response of embankment slopes with different reinforcing measures in shaking table tests. Nat Hazards. 76(2):791–810.
- Lin YL, Leng WM, Yang GL, Zhao LH, Li L, Yang JS. 2015b. Seismic active earth pressure of cohesive-frictional soil on retaining wall based on a slice analysis method. Soil Dyn Earthq Eng. 70:133–147.
- Liu HX, Xu Q, Wang L, Hou HJ. 2014. Effect of frequency of seismic wave on acceleration response of rock slopes. Chin J Rock Mech Eng. 33(01):125–133. (in Chinese)
- Munwar B, Sivakumar B. 2009. Earthquake resistant design of reinforced soil structures using pseudo static method. Am J Eng Appl Sci. 2(3):565–572.
- Nguyen KV, Gatmiri B. 2007. Evaluation of seismic ground motion induced by topographic irregularity. Soil Dyn Earthq Eng. 27(2):183–188.
- Ota K, Takeya K, Itoh K, Kuraoka S, Ueno Y, Hiroshima T. 2010. Centrifuge model tests of tieback anchors and drainage pipes for stabilization of slopes under earthquake loads. International Conferences on Recent Advances in Geotechnical Earthquake Engineering Soil Dynamics 9.
- Ren AW, Wang YJ, Chen ZY, Song YG, Sun P. 2016. Performance of the reinforced right abutment slope of Zipingpu Dam during magnitude 8.0 earthquake, Wenchuan, China. Q J Eng Geol Hydrogen. 49(4):298–307.
- Srilatha N, Madhavi Latha G, Puttappa CG. 2016. Seismic Response of Soil Slopes in Shaking Table Tests: Effect of Type and Quantity of Reinforcement. Int J Geosynth Ground Eng. 2(4):33.
- Singh SP, Ramaswamy SV. 2008. Influence of frequency on the behaviour of plate anchors subjected to cyclic loading. Mar Georesour Geotechnol. 26(1):36–50.
- Toyohiko M, Daisuke H, Hiroshi Y, Shoji D, Noriyuki C, Jun U, Go S. 2011. Reconnaissance report on landslide disasters in northeast Japan following the M 9 Tohoku earthquake. Landslides. 8(3):339–342.
- Vincenzo DG, Janusz W. 2007. Directivity of slope dynamic response to seismic shaking. Geophys Res Lett. 34(12):L12301.
- Wasowski J, Keefer DK, Lee CT. 2011. Toward the next generation of research on earthquake-induced landslides: current issues and future challenges. Eng Geol. 122(1-2):1–8.
- Xu C, Xu XW. 2014. Statistical analysis of landslides caused by the Mw 6.9 Yushu, China, earthquake of April 14, 2010. Nat Hazards. 72(2):871–893.
- Xu C, Xu XW, Shyu JBH, Zheng WJ, Min W. 2014. Landslides triggered by the 22 July 2013 Minxian-Zhangxian, China, Mw 5.9 earthquake: inventory compiling and spatial distribution analysis. J Asian Earth Sci. 92:125–142.
- Yang CW, Liu XM, Zhang JJ, Chen ZW, Shi C, Gao HB. 2014. Analysis on mechanism of landslides under ground shaking: a typical landslide in the Wenchuan earthquake. Environ Earth Sci. 72(9):3457–3466.