
 ?Mathematical formulae have been encoded as MathML and are displayed in this HTML version using MathJax in order to improve their display. Uncheck the box to turn MathJax off. This feature requires Javascript. Click on a formula to zoom.
Abstract
Gravity caisson wall is a common waterfront construction that were severely damaged by soil liquefaction in previous earthquakes. The deep mixing method is regarded as effective in liquefaction remediation. Meanwhile, an easily-executable remedial design procedure of using the deep mixing method for caisson walls exposed to seismic liquefaction risk has not been well developed for routine constructions. To solve the issue by following the philosophy of the Performance-Based Design method, the deep mixing method is examined within a framework of a well-calibrated case history to provide hypothetical mitigation to a damaged caisson wall to reach the acceptable level under the identical cyclic loadings as recorded in the case history. The study is divided into two steps: (1) a case history of damaged caisson wall by seismic-induced soil liquefaction was verified; (2) the deep mixing method is hypothetically applied to the caisson wall before the occurrence of earthquake, and the remedial design is optimized based on the improved wall structure deformation under seismic loading. The remedial design including the locations and configurations of deep mixing elements are optimized. Insights and recommendations on the establishment of liquefaction mitigation design and optimization process for caisson quay walls are provided to the practice.
1. Introduction
Gravity caisson walls are commonly used waterfront structure. However, severe damages have occurred to such structures by soil liquefaction during or after the seismic events based on historical records (e.g., Kobe earthquake in 1995). In general, three failure mechanisms could occur, including horizontal (seaward) displacement, settlement (vertical displacement) and seaward tilting of the wall structure (Hazarika et al. Citation2008; Mostafavi Moghadam et al. Citation2009). According to Arablouei et al (Citation2011), the major failure mechanisms of inducing the extensive deformation of caisson walls is the strength loss of foundation soil and backfill soil which is closely adjacent to the wall structure under seismic loadings. Therefore, improving liquefiable foundation and backfill soil is important for securing caisson wall structures in earthquakes.
Ground improvement measures for liquefaction mitigation are very important to maintain the post-earthquake performance of the gravity caisson wall in earthquake-prone areas. Various remedial mechanisms for caisson wall structures have been used such as compaction, installation of the deformation panel behind the caisson wall, etc (Alyami et al. Citation2007, Citation2009; Mostafavi Moghadam et al. Citation2009). Most studies proved the remediation efficiency, but hardly provided an easily-executable plan for specifying the design characteristics and estimating improved seismic performance under the designed conditions. Therefore, the research results have not been well applied to increase the efficiency of liquefaction mitigation in routine constructions. To solve this issue, by optimizing the Deep Mixing Method (DMM) design for liquefaction mitigation of caisson wall structures, the gap between the efficiency demonstration and establishment of an easily-executable guidance for routine construction can be filled up.
2. Application of the performance-based design principle in this study
Based on the Philosophy of the Performance-based design method (PIANC 2001), the design parameters of caisson wall could be designed based on the improved performance of the structures, instead of focusing on the factor of safety (FOS) against soil liquefaction. To prove the improvement effectiveness, the remediation was applied prior to the occurrence of earthquake. By comparing the estimated improved performances with the restoration guideline of caisson wall structure (PIANC 2001), the design parameters of the DMM can be optimized, and the cost efficiency and remediation performance control would be improved.
The optimized parameters include the location and configuration of DMM zones in foundation soil under the caisson wall and the backfill soil behind the caisson wall. According to PIANC (2001), the remedial efforts are economically acceptable for a typical caisson wall subjected to a life-time earthquake when the deformation of the wall structure is limited to 1 m and the rotation angle is limited to 1 degree. The analysed remedial designs of various parameters can be evaluated and categorized based on the different improved performances.
In brief, the optimization process includes three major steps:
Step one (establishing the unimproved benchmark)—a numerical simulation on a case history of damaged caisson wall in Kobe earthquake in 1995;
Step two (remediation)—hypothetically apply the DMM to improve the site prior to the construction of caisson wall before the earthquake;
Step three (remediation design optimization)—compare the improved and actual (unimproved) performances and then optimize the location and configuration (length and depth) of the deep mixed zone to achieve the designated performance grade.
3. Numerical modelling verification
The numerical modelling verification also includes two major steps: (1) establishment of the soil constitutive model for describing the liquefaction phenomena under cyclic loading; (2) case history validation to be used as the unimproved benchmark for remediation evaluation. Soil liquefaction is the main reason of triggering the deformations of the caisson wall. Appropriate simulations of the soil liquefaction behaviour of the backfill soil and foundation soil as well as the soil-wall structure interaction are the key issues for understanding the failure mechanisms of the case study as the unimproved benchmark. By applying the remediation to the unimproved benchmark, the improved performance of the structure could be quantified and the remediation design could be optimized.
3.1. The constitutive model for soil liquefaction behaviour
Numerous constitutive models for describing liquefaction phenomena have been proposed (Martin et al. Citation1975; Bryne et al. Citation1991, Citation2004). In general, soil liquefaction behaviour shows unique failure characters under loading cycles: (1) gradual generation of excess pore water pressure; (2) degradation of shear stiffness; (3) shear strain accumulation; (4) phase transformation from soil to liquid; (5) residual strength regain at large shear excursion. The development of one single constitutive model to describe the coupled correlation remains a challenge to the geotechnical community (Della et al. Citation2016). In this study, the liquefied backfill and foundation soil, which both control the failure performance of caisson wall, are the key issue in the modelling process.
The commercial software FLAC3D (Itasca Citation2007) is used. The Finn-model, as one of the ‘built-in’ models in FLAC software, was initially used to predict the nonlinear dynamic response while considering dynamic EPWP generation. The Finn model was developed by incorporating the empirical estimation of volumetric strain into the standard Mohr-Coulomb plasticity model (Finn et al. Citation1996; Martin et al. Citation1975). This model can capture the failure characters of liquefaction in granular materials. Based on the experimental data, the Finn model is best utilized to describe the soil stress-strain response and dynamic excess pore water pressure (EPWP) generation at small strain range or when the EPWP ratio is less than 0.6, due to the weakness of the model to describe the compressibility or deformability of granular materials when the EPWP ratio exceeds 0.6 (Seed and Booker Citation1977).
Based on Martin et al (Citation1975), Bryne et al (Citation1991, Citation2004), the Finn model is utilized to describe the soil stress-strain response and dynamic EPWP generation at small strain range or when EPWP ratio is less than 0.6. Following equations describe the Finn-model mathematically:
Eq. (1)
Eq. (1)
The Finn-model can capture the basic mechanisms that lead to liquefaction in sand or granular materials. The volume change that leads to dynamic pore pressure build-up in sand is a function of the material-dependent parameters C1, C2, C3 and C4, which can be determined based on relative density or SPT blow count SPT(N1)60 of the soil being simulated; Δεvd is plastic volumetric strain change; γ is shear strain; (N1)60 the corrected Standard penetration resistance blow count-SPT. C1 mainly controls the amount of volume strain increment and C2 mainly controls the shape of volumetric strain curve, and both parameters can be obtained from simple shear tests for particular granular materials (Arablouei et al. Citation2011).
Chen and Xu (Citation2007) proposed the “Post Liquefaction-Finn model” or “PL-Finn model” based on the theory of fluid mechanics to capture the stress-strain behaviour at large shear strain when large reduction occurs in effective shear stress or the EPWP ratio becomes greater than 0.6. Based on experimental testing results, the stress-strain correlation of deformed liquefied soil can be simplified using a power function (Equation 6). The experimental PL-model focuses on the zero effective stress state in the soil liquefaction process, and can be used to capture the large shear strain and stress-regain response when the effective stress approaches zero or equal to zero by establishing a correlation among cyclic shear stress and strain increment, which involves two material-dependent fitting parameters (k0 and n0) using the following correlations.
Eq. (6)
Eq. (6)
τ and γ′ are cyclic shear stress and shear strain rate and ‘ru’ is the EPWP ratio. These parameters have been verified and calibrated for the low to medium dense granular soils based on the shaking table test and hollow torsional shear test results (Chen and Xu Citation2007). There are two steps in the analysis: (1) to view the material of soil as an elastic continua, and set initial stress, calculate the initial stress distribution in the pre-liquefaction state when the computed ‘ru’ value is less than 0.6; (2) to view the liquefied layer soil as liquefied state, and perform liquefied solution for a certain time to get the result of deformation in the liquefied state when computed ‘ru’ value is greater than 0.6.
Above two models, the Finn-model and PL-model are combined and correlated based on the connecting parameter—EPWP ratio. For each calculation step of each liquefiable soil element, if the calculated EPWP ratio is less than 0.6, then the calculation follows the Finn-model correlation and the state is regarded as pre-liquefied state; if the calculated EPWP ratio becomes greater than 0.6, the model that calculation follows switches to PL-model in next time calculation for the soil element. To ensure the transfer from Finn-model to PL-model or vice versa, a ‘transfer-function’ is established between the two constitutive models based on the determination of ‘ru’ value for estimating the stress-strain behaviour and generation of EPWP of the potentially liquefiable soil. Based on the definition of EPWP, the ‘ru’ value is defined as below:
Eq. (7)
Eq. (7)
where is excess pore water pressure and
is the initial mean effective stress.
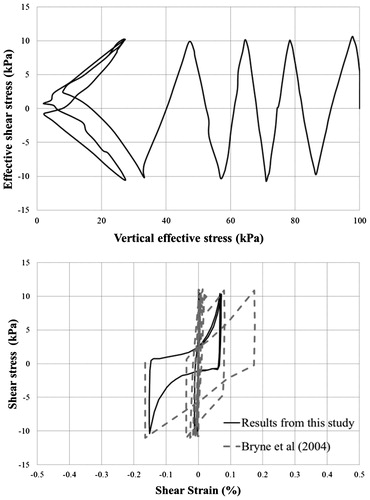
To verify the capability of the proposed model to capture the typical characters of soil liquefaction behaviour, a normal undrained cyclic shear testing on a cubic granular soil specimen was simulated. The ‘hypothetical’ specimen is made of low to medium dense granular soil with density corresponding to SPT (N1)60 = 10. The side length of the cubic specimen is assumed to be 0.1 m. The initial effective stress is set to be 100 kpa, and the initial horizontal effective confining stress is equal to 100*0.5 = 50 kPa by assuming the ratio of horizontal to vertical stress in ground equals to 0.5. A cyclic shear stress of 10 kPa is applied on the top of the specimen. A total of 6 cycles of shear loading is applied to liquefy the specimen.
presents the results of effective shear stress, shear strain, EPWP, and shear stiffness degradation versus with applied shear stress. As shown, a significant increase of shear strain indicates that the soil elements start liquefying. In 5th and 6th loading cycles, approximate 100 kpa of EPWP is generated and caused the large reduction in vertical effective stress. The negative correlation between shear stiffness-cyclic shear strain relations could be captured. Results from both studies indicate that the hypnotically-made testing specimen become fully liquefied after 5 or 6 cycles of seismic loading. The calculated correlations among the cyclic shearing stress and the responses of the testing specimens on effective shear stress, shear strain, EPWP, and shear stiffness also have a good match with the typical failure characters of soil liquefaction.
Figure 1. Estimated soil response subjected to undrained cyclic simple shear stress (Tong and Schaefer Citation2016).
3.2. Case history simulation verification
To ensure the validity of the case history verification, two validation parameters are used including the deformations and the EPWP values at multiple selected locations in the caisson wall-soil model.
Based on the filed observations (Inagak et al. Citation1996), the top of the caisson walls along the coastline displaced seaward approximately 4.5 m–5 m during the earthquake. The walls settled approximate 2 m–2.7 m and tilted 4–6 degrees seaward. No structural crack was observed on the wall along the coastline. Significant surface deformations were observed within the distance of 30 m from the wall in the backfill land. A substantial heaving of a foundation layer at a distance of 2–5 m in front of the bottom seaward toe of the caisson.
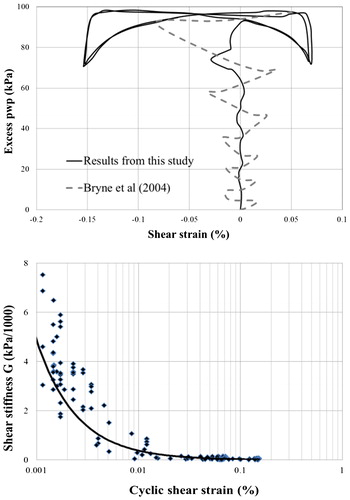
In the numerical model, the length, height, and width of the model are 179 m, 49 m, and 10 m in X, Z, and Y direction, based on the field measurements (Inagak et al. Citation1996). Hence, the left bottom corner of the model is set as the original point, and the original point is important to locate point A–H in . The caisson is 18 m high, 10 m wide and 12 m long. The ocean level is 2 m below the top of the caisson wall. The mesh size of the region immediately adjacent to the wall is 1 m, and average mesh size is 5 m ().
Figure 2. Established model for the simulated case history.
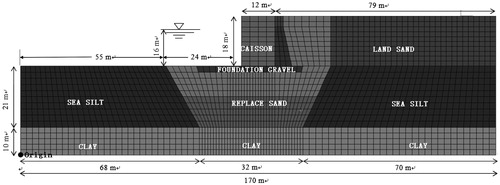
The caisson is modelled as an elastic body having an interface that allows slippage and separation at the base and the back of the caisson wall. The foundation soil and backfill soil, which are potentially liquefied, can be modelled using the Mohr–Coulomb law for static analysis and the ‘combined’ model for dynamic analysis. The other non-liquefiable zones (seabed clay and sea silt zone) are modelled using MC criterion in both dynamic and static analysis. The dynamic input includes two histories of ground accelerations (cm/s2) in vertical and horizontal directions recorded at the depth of 32 m in the Port Island array (Iwasaki and Tai Citation1996). The time histories of ground accelerations () are applied as the seismic input at the bottom nodes of the mode. The boundary condition at the sides of the model was achieved using the free-field condition to minimize the influences of wave reflections (Itasca Citation2007).
Figure 3. Seismic input - horizontal and vertical time histories of acceleration (cm/sec2).
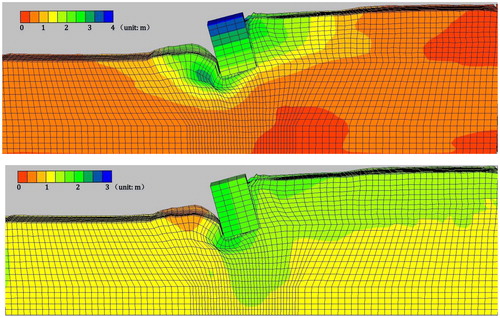
Figure 4. Deformation of the caisson wall-soil system.
The interface parameters of the model include normal and shear stiffness, cohesion and friction angle, which are possibly to be determined based on the physical properties, stress state and relative movement of the attached regions (Itasca Citation2007). A sensitive study was performed to determine the influences of interface parameters between the caisson quay wall and the foundation soils (). The results indicate that increasing the value of normal stiffness or shear stiffness of the thin foundation layer materials could lead to a minor decreasing of the wall’s deformation (less than 5% of the total value). Due to the large deformation of the foundation soil, the influence of the thin foundation gravel layer on wall deformation is insignificant.
Table 1. Interface parameters.
3.3. Parameterization of the modelling materials
According to Inagak et al (Citation1996), the backfill soil is 16 m in thickness and primarily loose hydraulic sand fill over dense clay. Similar sandy material was used for the foundation soil. By reviewing the literatures about this case history (Inagak et al. Citation1996; Iwasaki and Tai Citation1996; Iai and Sugano Citation2000; Takahashi and Hayano Citation2009; Dakoulas and Gazetas Citation2008; Alyami et al. Citation2009), the authors of this study found that the descriptions on the soil properties were rough and varied among the references, and direct application of the physical properties from these references could cause potential errors. On the other hand, the quantitative values of the physical properties of the backfill and foundation soils were primarily determined based on in-situ penetration tests, which were performed by the investigators on site after the earthquake. Therefore, the penetration testing data, which are readily accessible, can be regarded as reliable as the first hand data. The literatures mentioned that the tested SPT (N1)60 value was between 10 and 15, and hence the relative density was taken as between 35% and 40% accordingly.
Based on Dakoulas and Gazetas (Citation2008), the friction angle of 37 degree for both backfill and foundation soils was used. The seabed clay and sea silt zone are non-liquefiable and assumed to be isotropic and assumed to be medium to high density (Alam et al. Citation2005). The other material properties are estimated based on SPT (N1)60 by using empirical correlations as provided by Look (Citation2007) or directly from the published data (Alam et al. Citation2005; Alyami et al. Citation2009). After the initial modelling parameterization, numerical analyses were conducted and the computed deformations of the caisson wall were compared with the field observations, and the comparisons were used to adjust the applied soil properties in analysis. In future studies, it is important to mention that to further increase the reliability and accuracy of the analyses, supplementary field and experimental tests on the strength properties of the soils in the model should be conducted. The critical damping ratio for loose granular materials is commonly within the range of 1%–5%. For non-linear dynamic responses involving large shear strain, the local damping ratio of 0.157 is appropriate for all soil zones based on the calibration results (Itasca Citation2007). A summary of the soil parameters is presented in and .
Table 2. Materials properties and model parameters used in static analysis.
Table 3. Material properties and model parameters used in dynamic analysis.
Table 4. Calculated maximum EPWP at the highlighted locations.
3.4. Calculated deformations
The following results, generated from numerical analyses, show a good accuracy in modelling the failure mechanism of the damaged caisson wall:
The seaward and vertical displacement at the seaward top corner is approximately 4.4 and 2.5 m, respectively, and the residual rotation is 4.3 degrees, which have good match with the measured deformation in the field.
Both surface horizontal and vertical deformation in backfill soil propagate with the distance from the caisson wall within a distance of 80 m from the caisson wall in backfill soil, the calculated surficial displacements gradually decrease up to 0.1 m, which are consistent with the in-situ recordings that no significant surficial cracks were observed at the distance of 100–200 m from the back of the wall (Ishihara Citation1997).
In front of the caisson’s bottom corner, the foundation soil substantially heaved because of the rotational and lateral movement of the caisson wall, which received a good agreement with the field observations (Inagak et al. Citation1996).
3.5. Calculated excess pore water pressure
In addition to the good match between calculated and measured soil-wall system deformations, the calculated EPWP at various locations in the liquefiable soil match with the measured values from physical tests. For verification purpose, the measuring locations of EPWP in numerical model in this study () are made to be identical to the setup in Iai and Sugano (1996, Citation2000).
Figure 5. Distribution of the measuring locations for EPWP (scaled in terms of prototype) from Iai and Sugano (1996, Citation2000).

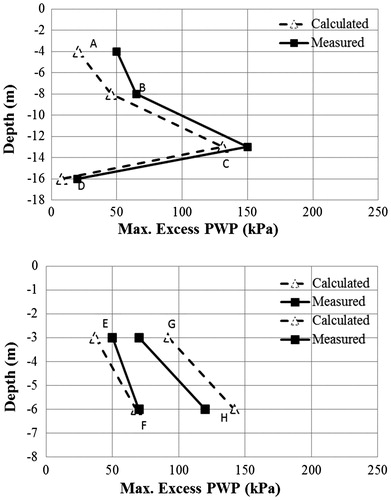
A total of eight measuring locations were selected for monitoring the generation of EPWP and their distributions are: in the backfill soil, points A, B, C, and D () are located within a horizontal distance from 20 to 25 m away from the caisson wall, and their depths are approximately 4 m, 8 m, 13 m, and 16 m based on the scaled dimension; in the foundation soil, points E and F, G and H are located in front of the seaward bottom corner and immediately behind the inward bottom corner of the wall. The depth of point E and G, F and H is 4 m and 8 m below the caisson wall bottom, respectively.
The initial and maximum pore water pressure at points A to H are calculated. The maximum EPWP ratio is back calculated based on the difference between the initial PWP before loading cyclic loadings. Based on the comparisons of EPWP results from physical testing and numerical modelling, the good agreements are received except for point G and H.
In , for points G and H, that are located in replaced sand zone adjacent to the land sand zone, the calculated max EPWP ration varied by a factor of 2 comparing to the measurements. In this region, the migration of EPWP between the replace sand and land sand could occur, which could explain that the measured EPWP are less than the estimated values. This is due to the influences of EPWP migration within the model were not properly incorporated in the computation. Hence, based on the verifications on deformations and pore water pressure generations of the established model, the simulated case history can be verified as the unimproved framework for the deep soil mixing method improvement evaluation.
Figure 6. Comparisons of the maximum EPWP distribution between the calculated and tested values of the measuring locations.
4. Liquefaction remediation using the deep mixing method
The DMM is an in-situ admixture stabilization technique with cement and/or lime as the binder or mixing agent, and is widely used for liquefaction mitigation (Mitchell Citation2008; Chu et al. Citation2009). The improving mechanisms and effectiveness of DMM to remediate against liquefaction have been quantitatively studied (Takahashi and Hayano Citation2009; Namikawa et al. Citation2007). The lattice-shape and wall-shape DMM elements are two most widely used configurations for liquefaction mitigation (Namikawa et al. Citation2007). In this study, the improving efficiency of wall-shaped DMM elements with different installation locations and geometries is examined.
This study is to optimize the configuration of the DMM improved zone based on improved deformation and associated damage by demonstrating the influence of various DMM improved zone locations and configurations on residual deformation of the caisson wall-soil system. The application of numerical tool can further advance the advance the understanding of the improvement mechanisms and effectiveness prediction of DMM used in liquefaction mitigation, which would be major issue herein.
Instead of relying on the seismic performance or damage severity of the DMM-mixed elements, the optimum DMM improved zone configuration is demonstrated based on two evaluation parameters – improvement effectiveness and improvement efficiency of the remediation design.
4.1. Shear strain compatibility assumption for DMM stiffer elements
To simplify the numerical analysis and increase the computational efficiency, a method called ‘the homogenization method’ (Navin Citation2005, Sugawa et al. Citation1996; Adams Citation2011) based on shear strain compatibility assumption can be used to determine the strength characters of DMM improved zone.
This method indicated that a DMM improved zone with materials properties (stiffness and shear strength) that considers the contribution of the DMM mixed stiffer elements and the enclosed unimproved soils. The shear strain compatibility assumes that the shear strains were compatible between the discrete elements and surrounding soils. The principle of homogenization method was widely used in literatures (Navin Citation2005; Adams Citation2011; Filz Citation2009; Bruce et al. Citation2013) to study the liquefaction remediation mechanisms and the overall performance of DMM improved condition.
Goughnour and Pestana (Citation1998) indicated that discrete stiffer element in liquefaction mitigation was less effective in reducing shear stress of improved soil as expected based on the shear strain compatibility assumption. Nguyen (Citation2012) and Rayamajhi et al (Citation2012) examined the validity of shear strain compatibility assumption by evaluating shear stress reduction of the in-situ soil improved by discrete stiffer elements. The results showed the average stress reduction factor, by numerical analysis, is larger than the value calculated from practical design method (Baez Citation1995). Therefore, the assumption of shear strain compatibility could potentially underestimate liquefaction potential of the enclosed soil, which leads to significant unconservative results.
Hence, the strength properties of the DMM improved zone, calculated using the homogenization method based on shear strain compatibility assumption, could be overestimated. Therefore, to limit the overestimation influences, a strength reduction parameter (Nguyen Citation2012), which is a function of the area replacement ratio (ae), strength properties of discrete stiffer element and the surrounding soil, is determined and used to multiply the calculated strength calculated using the homogenization method to obtain the adjusted strength of the representative DMM zone for further numerical analysis.
4.2. Properties of the DMM-mixed material
In practice, two types of DMM are most widely used—the wet and dry mixing method. Due to the length limit of the paper, the differences between two methods are not expanded. In general, for both methods the properties of DMM mixed material can be highly variable and depend on site and project-specific characteristics. It is also difficult to predict within a reasonable level of accuracy the strength that will result from adding a particular amount of binder/grouting to a given soil based on the in-situ characteristics of the native soil (Bruce et al. Citation2013). Therefore, the mixed materials’ properties applied in this study are primarily the typical values of using wet DMM as previously published and widely accepted in routine construction practice (Elias et al. Citation2006). Similar analytical process and philosophy will be also applicable to the conditions of using dry DMM for the specific cases.
The most important parameter involved in design and construction quality control and assurance for DMM project is the unconfined compressive strength of the DMM mixed material (Elias et al. Citation2006; Filz Citation2009; Bruce et al. Citation2013). Numerous observations and empirical values on the properties of DMM mixed materials have been found from the literatures. As reported in Navin (Citation2005) and Elias et al. (Citation2006), the typical range of unconfined compressive strength (qu) of laboratory-mixed material specimens is from 20 to 4,000 psi (0.1 to 28 MPa) for wet DMM depending on the properties of mixed soil, utilized binder characteristics and construction variables, operational parameters, curing time and loading conditions. In the United States, a common expectation is that the strength of field-mixed materials can consistently achieve at least 50%–60% of the strength of laboratory-mixed specimens (Bruce et al. Citation2013; Elias et al. Citation2006). Also, the qu value typically equals to two times of the undrained shear strength (su) for DMM improved material (Adams Citation2011; Elias et al. Citation2006; Bruce et al. Citation2013). The ratio between the elastic modulus (E50) to qu is normally between 75 and 1000 for wet DMM (Namikawa et al. Citation2007). Reported Poisson ratio ranges from 0.2 to 0.5 for small strain behavior of wet DMM mixed soils (Elias et al. Citation2006; Terashi Citation2003; Porbaha et al. Citation2005).
No significant difference in density was found between the unimproved soil and the improved soil (Broms Citation2003). According to Bruce et al (Citation2013), there are still debates regarding the strength envelope for DMM mixed soils for use in numerical analysis, and it is acceptable to use an effective friction angle of 30–35 and cohesion intercept of c = 1/2 unconfined compressive strength for DMM mixed materials. The above general rules based on the published data and relationships for soil-binder mixtures (Le Kouby et al. Citation2017; Filz Citation2009; Adams Citation2011; Bruce et al. Citation2013) provide the basis for assuming the properties of wet-DMM mixed material used in this study, as below:
56-day qu = 300 (psi) or 2.1 (Mpa) (Elias et al. Citation2006; Bruce et al. Citation2013)
Elastic modulus (E50) = 300*qu = 90,000 (psi) or 620 (Mpa) (Adams Citation2011; Bruce et al. Citation2013)
Improved density (kg/m3) = same as unimproved density (Terashi Citation2003)
Poisson ratio = 0.3 (Bruce et al. Citation2013)
Cohesion = 1500 (kPa) (Namikawa et al. Citation2007)
Tensile strength (psi) = 15% of qu = 45 (psi) or 0.31 (Mpa) (Elias et al. Citation2006)
Friction angle (degree) = 30 (Namikawa et al. Citation2007)
Permeability (cm/sec) = 1.0E-7 (Namikawa et al. Citation2007; Elias et al. Citation2006)
Since the construction quality of DMM project can be highly variable, a QA/QC program must be conducted to ensure the mixed material satisfies the specifications as mentioned in regulation (Elias et al. Citation2006).
4.3. DMM improved zone characters and design scenarios
The DMM walls, which are oriented perpendicular to the quay wall alignment and parallel to the direction of lateral spreading of backfill soil, can be constructed using the deep mixing method by overlapping wet-mixed, triple-axis columns (Bruce et al. Citation2013). shows a three dimensional view of the DMM mixed walls and the improved zone consisting of the DMM elements and the contained soils among the elements. The centre to centre spacing between the DMM mixed walls is 1.2 m, and the diameter of the overlapped DMM mixed column or regarded as the wall thickness is 0.9 m.
Figure 7. Three dimensional view of the DMM mixed wall and DMM improved zone.
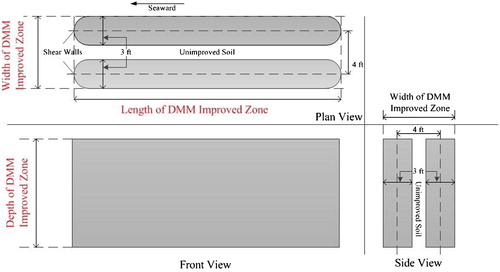
The properties of the representative DMM improved zone for static and dynamic analysis can be determined by using the homogenization method (Adams Citation2011). For simplification, the influence of vertical joints in the DMM mixed walls can be neglected. According to the setup of the discrete stiffer elements, the area replacement ratio, as defined as the ratio of area of treated material to area of DMM improved zone, is 71.7%. Therefore, the replacement ratio, effective width of the shear wall, representative stiffness and representative shear strength of the DMM improved zone can be determined using the equations recommended by Navin (Citation2005), Adams (Citation2011), and Filz (Citation2009) below:
=
Edmz(representative) = a representative strength of the global DMM improved zone
Ewall = the shear strength of the DMM improved materials (discrete element)
Esoil = the shear strength of the unimproved soil between shear walls within the DMM improved zone
as or Ar= area replacement ratio (Asc/A, Asc: area of stiffer element, A: total plan area)
d = column diameter = 0.9 m ≍ DMM mixed wall thickness
e = overlap distance between columns = 0.5*d = 0.45 m
S = center-to-center spacing of shear walls = 1.2 m
ae = overlap area ratio (ratio of area of overlap to area of individual column)
Rd = strength reduction parameter
Ar = area replacement ratio
Gr = Gsc/GS (between 2 to 7 for DMM mixed materials, commonly use 4)
Gsc shear modulus of stiffer element
Gs shear modulus of the in-situ soil
The parametric study is divided into three scenarios, which are: (1) scenario 1—placing a single DMM improved zone in foundation soil; (2) scenario 2—placing a single DMM improved zone in backfill soil; (3) scenario 3—placing DMM improved zones in both foundation and backfill soils. The process is first to determine the efficient DMM improved zones for improving foundation soil in scenario 1, and then repeat the same process for backfill soil in scenario 2. Finally, the optimized DMM improved zones for foundation and backfill soils are applied together in scenario 3, and their combinations are evaluated and compared in terms of the improvement effectiveness and efficiency. The optimum configurations of DMM improved zone for each scenario for the entire quay wall-soil system are recommended based on two criteria—(1) satisfaction of the specified performance grade, and (2) satisfaction of good improvement efficiency.
5. Improved seismic performance results and discussions
Two results interpretation parameters, improvement effectiveness and efficiency, are used to evaluate and compare the improved results from various remedial cases. Improvement Effectiveness (IES) is defined as the deformation reduction magnitude (unit: m) between the unimproved and improved deformation of the caisson wall. Since the cost of DMM largely depends on the volume of grout injection or the volume of native soil requiring improvement, it is important to define a parameter to evaluate the efficiency.
The definition of Improvement Efficiency (IEY) follows the principle of the ‘improved ratio’ in Burke and Sehn (Citation2005) and ‘efficiency’ in Adams (Citation2011). In this study, the improvement efficiency is defined as the ratio of deformation reduction percentage to the volume of DMM improved zone ().
Specifically, the width of DMM improved zone in all examined cases remains at 10 m equal to the width of constructed model. Using these parameters, the DMM improved zone configuration in terms of location and geometry can be optimized, while the dimensions of DMM mixed walls remain the same through the study. The improved response of the simulated case history with various DMM improved zones differing in locations and geometries also can be established for routine practice.
The improved results for the three categories in scenario 1 are shown in and . In , the front view of the DMM improved zoon together with the quay wall-soil system is shown. All DMM improved zones start at Point O as also highlighted in , which is the point of around 0.5 m vertically under the seaward bottom corner of the quay wall. For each specific applied DMM improved zone, the improved deformation at the top seaward corner of the quay wall and improvement efficiency are plotted in the parenthesis at the lower left corner (for category 1 and 3 in , respectively) and the lower right corner (for category 2 in ) of each specific DMM improved zone applied in its corresponding case. For example, in , the improved deformation of 1.71 m and improvement efficiency of 0.17 could be obtained through numerical analysis if the DMM improved zone were applied as highlighted in red, respectively.
Figure 8. Computed deformation and improvement efficiency for multiple DMM improved zone lengths and depths in foundation soil for three categories of scenario 1.
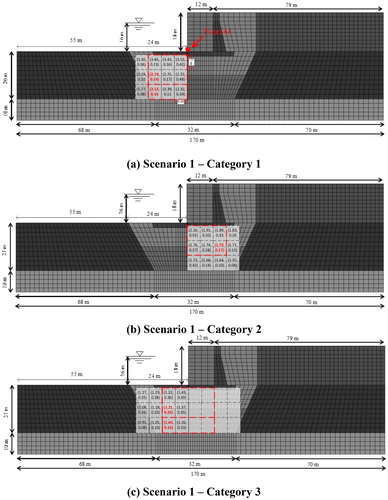
Figure 9. Computed deformations versus with multiple DMM improved zone length in foundation soil (e.g., c1_z_7: the result from category 1 with improved zone depth =7 m).
5.1. Scenario 1 – improvement by a single DMM improved zone in foundation soil
The improvement of foundation soil is divided into three categories: category 1- improving the soil before the seaward bottom corner of the quay wall; category 2 improving the soil behind the seaward bottom corner of the quay wall; category 3 placing a continuous DMM improved zone centred underneath the seaward bottom corner the caisson wall.
For category 1 and 2, the length increment of the DMM improved zone is 5 m, and the depth increment of the DMM improved zone is 7 m or 1/3 of the total thickness of foundation soil of 21 m (see ). For category 3, the length increment is 5 m on both sides (in front of and behind the seaward bottom corner of the quay wall) is used with the depth increment in vertical direction is still remaining 7 m.
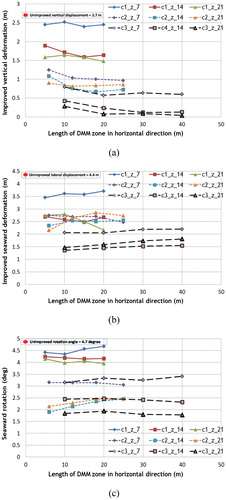
The improved deformations (horizontal, vertical and tilting angle) of quay wall with the corresponding DMM improved zone geometries (depth and length) are plotted for all three categories in scenario 1. In , for three categories, the improved seismic deformation and efficiency both decrease with the increasing volume of DMM improved zone, which indicates that balance between the improved deformation and improvement efficiency that should be analysed depending on the specified performance grade and cost. Also, comparing the deformation reductions in , improving foundation soil can be more effective in reducing the vertical deformation than reducing the seaward deformation of the quay wall.
Based on the results, a continuous DMM improved zone centred under the seaward bottom corner of the quay wall can provide the maximum deformation reduction, compared to category 1 and 2, which show the greatest improvement effectiveness. When the length of DMM improved zone distance exceeds 20 m in , additional deformation reduction becomes insignificant. Also, the improved deformation of the quay wall decreases with DMM improved zone depth, but the improvement efficiency decreases with the depth of DMM improved zone for each scenario.
Among the remedial cases in , the geometries of DMM improved zone with length of 20 m and depth of 14 m to 21 m () in category 3 shows the maximum deformation reduction and good efficiency. Placing a continuous DMM improved zone in foundation soil centred under the quay wall can reduce all three failure modes ().
5.2. Scenario 2 – improvement by a single DMM improved zone in backfill soil
With a minimal clearance distance of 3 m behind the quay wall, the analysed DMM improved zone extends inward in the backfill soil with an increment of 5 m in horizontal direction and 6 m (one third of the backfill thickness) in vertical direction. In , the improved deformation and efficiency results (following the same format as in ) is plotted at the lower right corner of each corresponding DMM improved zone. The improved seaward and vertical deformation and tilting angle at the top seaward corner of the quay wall are shown in .
Figure 10. Computed deformation and improvement efficiency for multiple lengths and depths of DMM improved zones.
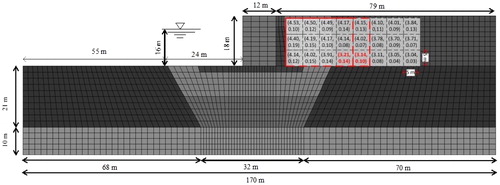
Figure 11. Computed deformation versus with various DMM improved zone lengths and depths in backfill soil (For instance, z_5: results from options with improved depth = 5 m).
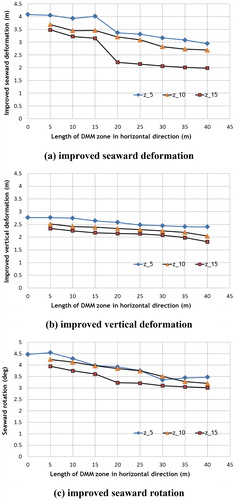
As shown, the improved seismic deformation and improvement efficiency also decrease with the increase of DMM improved zone length. When the length exceeds 20–25 m, the improvement efficiency becomes consistently low (less than 0.1) and the seismic improved deformation remains unchanged with the additional length increment of the DMM improved zone.
Comparing the general curve trend shown in , it can be seen that improving the backfill soil can be more effective in reducing the seaward displacement than in reducing the vertical deformation and tilting angle of the quay wall. In sudden reduction in improved lateral deformation occurs when the DMM improved zone in about 20 m, likely due to the heavy liquefaction occurred within this area that is at the backfill 20–25 m away from caisson wall (Dakoulas and Gazetas Citation2008). In also show the similar trend for the reduction of vertical settlement and tilting computed at the top seaward corner of the quay wall. Therefore, the efficient DMM improved zones (highlighted in red) for backfill soil improvement may be determined in .
5.3. Scenario 3 – improvement by one DMM improved zone in both foundation and backfill soil
Two selected efficient DMM improved zone configurations in the foundation soil () and in the backfill soil () are further analyzed in this section, to obtain the optimum DMM improved zone configuration for the quay wall-soil system.
The damage criteria generally in routine practice is shown in (PIANC, 2001), and deformation criteria are calculated based on dimensions of improved caisson quay wall. The configurations of the examined DMM improved zone and their corresponding improved deformation and efficiency results are listed in . Based on , remedial option 4 shows the lowest seismic deformation (0.48 m) and improvement efficiency (0.11) with the greatest improved zone volume (20*21 + 25*15 = 795 m3 per unit width) among the four remedial options. As seen, the difference of the improvement efficiency for the four remedial options is insignificant; that is within 2%. Therefore, the improvement efficiency may not be the dominant consideration for this case.
Table 5. Specified damage criteria for the improved quay wall (PIANC 2001).
Table 6. Improved results by the selected DMM improved zone configurations.
6. Improvement effectiveness and efficiency evaluation
The optimum DMM improved zone configuration would be the one that meets the specified performance grade with the smallest DMM improved zone, considering that the cost of installing the DMM improved zone is a function of the total improved volume. The efficiency for each examined DMM improved zone in scenario 1 and 2 is presented in . As can be seen, the improved deformation for the caisson wall-soil system decreases with the volume increase in applied DMM improved zone in terms of the length of DMM improved zone in horizontal direction. Meanwhile, the improvement efficiency also decreases with the increasing treatment length and depth.
For the improvement of foundation soil, the efficiency of a DMM improved zone in foundation soil decreases with the increasing DMM improved zone length and depth. Placing a continuous DMM improved zone cantered the seaward bottom corner of the quay wall achieves the maximum deformation reduction and best efficiency than the other configurations in scenario 1, even though the additional benefit of increasing the DMM improved zone length to be greater than 20–25 m is fairly small. Therefore, placing the continuous DMM improved zone centrally under the quay wall should be considered first whenever possible.
For the improvement of backfill soil, the improvement efficiency also decreases with the increasing of the length of DMM improved zone. However, the difference between the improved efficiency among various DMM improved zone configurations is not as significant as shown in scenario 1; the improvement efficiencies are constant approximately from 0.1 to 0.3, which is approximate one-third to one-half of the efficiency by improving foundation soil. Therefore, based on the results obtained from the numerical analysis involving the specific types of foundation and backfill soil in this case history, this could indicate that improving the foundation soil is potentially more effective in reducing the deformation of caisson wall than improving the backfill soil. This observation is consistent with the results by Namikawa et al. (Citation2007), that the effectiveness of improving the foundation soil can be two times more efficient than improving the backfill soil. The efficiency becomes consistently low when DMM improved zone length exceeds 20 to 25 m in backfill soil. Since the efficiencies among the various examined improved zone configurations are fairly small, the final decision of the utilized design will be primarily based on the comparison of improved deformation and specified performance grade, as discussed in scenario 3.
The above analyses provide a basis for comparing the efficiency of different DMM zone configurations; they do not reflect the ability of the different configurations to achieve the specified performance grade. Selecting an optimum DMM improved zone requires considering both the specified performance and the efficiency based on specific project characteristics. Testing different types of foundation and backfill soils covering the field observations is also recommended to develop a more comprehensive understanding of the influences of soil properties on improvement effectiveness of liquefaction mitigation for caisson wall structure.
Finally, within the framework of this case study, all four analysed options in scenario 3 can be utilized to improve the gravity caisson wall as described in this study if the specified performance is grade S, which is commonly used in design of caisson wall in practice for the earthquake motion with a probability of exceedance of 10% during life-span (PIANC 2001). In practice, the final dimension of DMM improved zone should be confirmed by analyses to reflect the details of stratigraphy and system geometry.
7. Conclusion and highlights
Within the framework of the case history, this study presented the process of obtaining the optimum DMM improved zone location and geometry for liquefaction mitigation of gravity caisson quay wall. By following the performance-based design philosophy, this process may be used to optimize the liquefaction mitigation design of using other remedial schemes for similar type of quay wall prone to liquefaction damage in earthquake prone area.
Two parameters, the improved deformation and improvement efficiency are important. The numerical analyses identified the relative effectiveness of alternate DMM improved zone configurations and provided insights on how to optimize the DMM improved zone configuration in design. The optimization variables include the horizontal distance to the caisson wall, installation depth and length of the DMM improved zone. The following conclusions and highlights can be drawn from this study for the condition of gravity type caisson quay wall in liquefiable soils requiring mitigations:
All four remedial options analysed in scenario 3 can be used to improve the caisson quay wall if the performance grade is S under an earthquake motion with probability of exceedance of 10% during life-span.
Remedial option 4 is recommended if the performance grade is A under an earthquake motion with probability of exceedance of 10% during life-span.
For the improvement of foundation soil, the analyses show that placing a continuous DMM improved zone centered under the quay wall is more effective in reducing the seismic deformation other DMM improved zone configurations.
The efficiency of placing a DMM improved zone immediate behind the caisson wall decreases with the increasing DMM improved zone length.
Improving the foundation soil can be approximately two times more efficient than improving backfill soil in reducing the seismic deformation of the quay wall.
The optimum DMM improved zone configuration should first meet the specified performance grade, and then obtain the satisfied efficiency among the other candidate configurations. The selection process may require a comprehensive parametric study.
Above results clearly indicated both backfill soil and foundation soil are liquefied under the seismic loading. On the other hand, the contributions of backfill soil and foundation soil on the total deformation of caisson walls is still difficult to quantify because the migration of excess pore water pressure from the backfill soil to foundation soil is not properly considered in the numerical analysis. This question is especially important in optimizing the applications of improvement efforts and predicting the improved and unimproved deformations of caisson walls under seismic loading. Therefore, more efforts are needed to solve this question to further increase the ability of predicting the performance of caisson wall structure subjected to earthquake loadings and describing the soil behaviour involving fluid-solid analysis.
Acknowledgements
This study was conducted as part of the Geotechnical Solutions for Soil Improvement, Rapid Embankment Construction, and Stabilization of the Pavement Working Platform project funded by the Strategic Highway Research Program II of the National Academies. The authors also thank the China Geological Survey Projects (Grant No. 1212011140016 and DD20160273).
Disclosure statement
No potential conflict of interests was reported by the authors.
Additional information
Funding
Related Research Data
References
- Adams T. 2011. Stability of Levees and Floodwalls supported by deep-mixed shear walls: Five case studies in the New Orleans Area, PhD Dissertation, Blackburg (VA): Virginia Tech.
- Alam MJ, Towhata I, Wassan TH. 2005. Seismic behavior of a quay wall without and with a damage mitigation measure. Earthquake Engineering and Soil Dynamics. 1–2. doi:10.1061/40779(158)18
- Alyami M, Rouainia M, Wilkinson SM. 2009. Numerical analysis of deformation behavior of quay walls under earthquake loading. Soil Dynamics Earthquake Eng. 29(3):525–536.
- Alyami M, Wilkison SM, Rouainia M, Cai F. 2007. Simulation of seismic behavior of gravity quay wall using a generalized plasticity model. Proceedings of 4th International Conference on Earthquake Geotechnical, Thessaloniki, Greece, June 25–28, 2007.
- Arablouei A, Ghalandarzadeh A, Mostafagharabaghi AR, Abedi K. 2011. A numerical study of liquefaction induced deformation on caisson-type quay wall using a partially coupled solution. J Offshore Mech Arct Eng. 133(2): 0211101-1–021101-9.
- Baez JI. 1995. A design model for the reduction of soil liquefaction by using vibro-stone column. PhD Thesis, Civil Engineering, University of Southern California.
- Broms BB. 2003. Deep soil stabilization: Design and construction of lime and lime/cement columns. Stockholm, Sweden: Royal Institute of Technology.
- Bruce M, Berg R, Collin J, Filz G, Terashi M, Yang D. 2013. Federal highway administration design manual: Deep mixing for embankment and foundation support. FHWA-HRT-13-016. 10:2013.
- Bryne PM. 1991. A cyclic shear-volume coupling and pore pressure model for sand. Proceedings of the 2nd International Conference on Recent Advances in Geotechnical Earthquake Engineering and Soil Dynamics; 11–15 March; St. Louis (MO), Vol.1, pp. 47–55.
- Bryne PM, Park SS, Beaty M, Sharp M, Gonzalez L, Abdoun T. 2004. Numerical modeling of liquefaction and comparison with centrifuge tests. Can Geotech J. 41(2):193–211.
- Burke GK, Sehn AL. 2005. An analysis of single axis wet mix performance. Proc. Int. Conf. Deep Mixing – Best Practice and Recent Advances, Deep Mixing’05, SD Report 13 (CD-ROM), Swedish Geotechnical Institute, Linkoping, 41–46.
- Chen YM, Xu DP. 2007. FLAC/FLAC3D fundamentals and examples. Beijing: Waterpub, Inc. (In Chinese)
- Chu J, Varaksin S, Klotz U, Menge P. 2009. Construction proves. Proceedings of 17th International Conference on Soil Mechanics and Geotechnical Engineering, pp. 3006–3135. Alexandria, Egpyt.
- Dakoulas P, Gazetas G. 2008. Insight into seismic earth and water pressures against caisson quay wall. Geotechnique. 58(2):95–111.
- Della N, Muhammed RD, Canou J, Dupla JC. 2016. Influence of initial conditions on liquefaction resistance of sandy soil from Chlef region in Northern Algeria. Geotech Geol Eng. 34(6):1971. https://doi.org/10.1007/s10706-016-0077-8
- Elias V, Welsh J, Wareen J, Lukas R, Collin J, Berg R. 2006. Ground improvement methods: Reference Manual – Volume I. NHI Course No. 13204, Federal Highway Administration. Washington DC, USA.
- Filz GM. 2009. Design of deep mixing support for Embankment and Levees. Proceedings of the International Symposium Deep Mixing & Admixture Stabilization; May 19–21; Okinawa, Japan, pp. 23.
- Finn WDL, Byrne PM, Evans S, Law T. 1996. Some geotechnical aspects of Hyogo-ken Nanbu (Kobe) earthquake of January 17, 1995. Can J Civ Eng. 23(3):778–796.
- Goughnour RR, Pestana JM. 1998. Mechanical behavior of stone columns under seismic loading. Proceedings of the 2nd International Conference on Ground Improvement Techniques; Singapore, 157–162.
- Hazarika H, Kohama E, Sugano T. 2008. Underwater shake table tests on waterfront structures protected with tire chips cushion. J Geotech Geoenviron Eng. 134(12):1706–1719.
- Iai S, Sugano T. 2000. Shaking table testing on seismic performance of gravity quay walls. Proceedings of 12th World Conference on Earthquake Engineering, Aug 1–6, Auckland, New Zealand.
- Inagak H, Iai S, Sugano T, Yamazaki H, Inatomi T. 1996. Performance of caisson type quay walls at Kobe port. Special Issue of Soils and Foundations. 36(Special):119–136.
- Ishihara K. 1997. Terzaghi oration: Geotechnical aspects of the 1995 Kobe earthquake. Proceedings of 14th Conference Soil Mechanics and Foundation Engineering; Hamburg 4, 2047–2073.
- Itasca. 2007. Fast Lagrangian Analysis of Continua, Users’ manual. MN: Itasca.
- Iwasaki Y, Tai M. 1996. Strong motion records at Kobe Port Island. Soils Foundations (Special issue on geotechnical aspects of the January 17, 1995 Hoogoken-Nambu earthquake, 1, 29–40.
- Le Kouby A, Guimond-Barrett A, Reiffsteck P. 2017. Geotech Geol Eng. https://doi.org/10.1007/s10706-017-0401-y
- Look B. 2007. Handbook of geotechnical investigation and design tables. London, UK: Taylor & Francis.
- Martin GR, Finn WDL, Seed HB. 1975. Fundamentals of liquefaction under cyclic loading. J Geotechnical Eng Div. ASCE. 101(GT5):423–438.
- Mitchell JK. 2008. Mitigation of liquefaction potential of silty sands. From Research to Practice in Geotechnical Engineering Congress. 2008:433–451.
- Mostafavi Moghadam A, Ghalandarzadeh A, Towhata I, Moradi M, Ebrahimian B, Hajialikhani P. 2009. Studying the effects of deformable panels on seismic displacement of gravity quay walls. Ocean Eng. 36(15–16):1129–1148.
- Namikawa T, Koseki J, Suzuki Y. 2007. Finite element analysis of lattice-shaped ground improvement by cement-mixing for liquefaction mitigation. S&F. 47(3):559–576.
- Navin M. 2005. Stability of Embankment Founded on Soft Improvement with Deep-Mixing-Method Columns, PhD Dissertation. Blackburg (VA): Virginia Tech.
- Nguyen. 2012. Effect of DEM Grids on shear stress distribution in Liquefiable soil. GeoCongress. 2012:1948–1957.
- PIANC (Permanent International Association of Navigation Association). 2001. Seismic design guidelines for port structures, Balkema,Rotterdam, the Netherlands, 474.
- Porbaha A, Ghaheri F, Puppala AJ. 2005. Soil cement properties from borehole geophysical correlated with laboratory tests. Proceedings of Deep Mixing’05: International conference on deep mixing best practice and recent advances. Stockholm, Sweden, May 23–25, 2005.
- Rayamajhi D, Nguyen V, Ashford A, Boulanger RW. 2012. Effect of discrete columns on shear stress distribution in Liquefiable soil. GeoCongress. 2012:1908–1917.
- Seed HB, Booker JR. 1977. Stability of Potentially Liquefiable Sand Deposits Using Gravel Drains, Journal of the soil Mechanics and Foundations Division, ASCE, 103,757–768.
- Sugawa N, Ito Y, Kawai M. 1996. New core sampler with planet gear for investigating the cement-mixed ground. Grouting and Deep Mixing, Proceeding of IS-Tokyo’ 96; May 14–17; Tokyo, pp. 635–658.
- Takahashi H, Hayano K. 2009. Dynamic model tests in centrifuge on lattice-shaped DMM ground improvement for retraining displacement of quay wall. In: Tsukamoto, Yoshimini, editors. Performance-based design in earthquake geotechnical engineering – Kohusho. Landon, UK: Taylor & Francis Group.
- Terashi M. 2003. The state of practice in deep mixing methods. Proceedings of 3rd International Conference Grouting and Ground Treatment; 25–49; New Orleans.
- Tong B, Schaefer V. 2016. Optimization of Vibrocompaction design for liquefaction mitigation of gravity Caisson Quay Walls. Int J Geomech. 16(4):04016005.