
 ?Mathematical formulae have been encoded as MathML and are displayed in this HTML version using MathJax in order to improve their display. Uncheck the box to turn MathJax off. This feature requires Javascript. Click on a formula to zoom.
Abstract
Water resources are essential for the land surface system and human life and activity. However, gridded water resource data that can reflect subtle differences of spatial distribution within water basins are scarce. This article has introduced six factors: precipitation, aridity, evapotranspiration, slope, vegetation, and catchment area, to develop an improved gridded model for water resource distribution in China based on the partition-weight assignment method. The results showed that the improved gridded water resource distribution method based on second-order basins has high applicability for China. It demonstrates an overall spatialization error of 7.68% for third-order basins and 7.25% for provincial administrative units. In addition, the spatialization precision of the Yangtze River Basin, Songhua River basin, and Southern River Basin, is better than that of the middle and lower reaches of Yellow River Basin, Huaihe River Basin, and Northwestern River Basin. The relationship between the water resource distribution and gross domestic product density differed with the size of urban areas and geographical locations. These results can provide scientific support and databases for the management of regional water resources.
1. Introduction
Water resources are key to human survival and regional sustainable development. They are composed of surface water (lakes, rivers, and wetlands) and groundwater (water is present in the fractures of rock formations and in soil pore spaces) (Wu et al. Citation2014; Bao and He Citation2015;Wang et al. Citation2017). Surface water and ground water can be replenished mutually by both recruitment and seepage (Do et al. Citation2015). Over the last few decades, regional water resource scarcity has become severer due to rapid economic development, urbanization, and global warming (Alejandro and Hewings Citation2011). In addition, serious eco-environmental problems, such as drought, salinization, and desertification, have been exacerbated by the over-exploitation of water resources (Yu et al. Citation2015). The problem of water resource shortages will restrict global economic and social development, and may even be the fuse of the international conflict and war. In China, overall water resources are abundant (2.81 × 10¹² m3); However, per capita of the population is relatively low at 2200 m3. This gives China a ranking of 121st in the world in terms of water resources available per person. This is due to a large and growing population, poor water resources management, and uneven spatial distribution of water resources in time and space (He and Zhao Citation2000; Qi et al. 2010; Liu Citation2013; Shi et al. Citation2014). Therefore, the quantitative evaluation and description of the spatial–temporal distribution characteristics plays an important role in rational management of regional water resources. This can then alleviate the issue of water resource supply and demand in China.
The statistical water resources in China are mostly organized and shared based on the polygon statistical units (administrative region or basin), which cannot reveal the spatial distribution patterns and disparity of water resources within the polygon statistical units (Wang and You Citation2008; Xia et al. Citation2011; Geng et al. Citation2014; Do et al. Citation2015; Tu et al. Citation2016). However, detailed information about water resources in the pixel scale is urgently needed for the investigation of the relationship between economic growth and water resource scarcity (Bao et al. 2007; Jiang and Liu Citation2010; Liu Citation2013; Zhou et al. Citation2015). Many studies have been applied to explore the methods of distributing the water resources of polygon statistical units into grid cells (Duarte et al. Citation2002; Chen et al. Citation2005; Lei et al. Citation2007; Cai Citation2008; Tian et al. Citation2012; Li and Ma Citation2014; Bao and Chen 2015; Wang et al. Citation2017). Tu et al. (Citation2016) utilized the Moran’s I index to analyse the spatial patterns of water resources of the third-order basins and then constructed an autocorrelation model between statistical basin water resources and its relative factors. However, the proposed model only takes the factors of precipitation and slope into account, and ignores the influences of water catchment area. Liu (Citation2013) obtained the spatial quantitative description of agricultural water distribution based on GIS and analytic hierarchy process (AHP), which ignored of the seasonal variations of precipitation and water conversion in vegetation. Wang et al. (Citation2017) proposed a spatial allocation method of regional water resources, which was composed of vegetation, slope, precipitation, and catchment area, ignoring the effects of water evapotranspiration. Lei et al. (Citation2007) chose three factors (distance, land use, and slope) to develop a spatial allocation method of water resources, which did not take the climate factors into account. Commonly used methods of previous studies can be divided into two categories that include: areal interpolation methods and geo-statistical methods. The discrete data can be transferred into continuous data by areal interpolation methods that utilize the spatial correlations to construct the quantitative relationship between the target zone and source zones (Daniels et al. Citation2011; Shi et al. Citation2011; Guo et al. Citation2017). However, a functional relationship between dependent and independent variables is applied to establish the geo-statistical method. This method has been widely used to distribute population and gross domestic product (GDP) consensus data of administrative regions to grid cells based on functional relationship models (the geographically weighted regression model, the least-squares regression method and the ordinary linear regression model).
In this study, an improved gridded water resource distribution method for China, based on second-order basin data of 2013, is proposed. The data are composed of six factors that are derived from climate and underlying, including vegetation, slope, precipitation, aridity, evapotranspiration, and catchment areas. Considering the wide regional disparity of water resources in China, the partition-weight assignment method has been utilized to determine the relative importance of associated factors in affecting the distribution of water resources. The objective of this are is to transfer the water resources of second-order basins to grid cells of 1 km ×1 km, at which few studies have been conducted, to reveal the spatial patterns and distributions of water resources in China.
2. Materials and methods
2.1. Study area
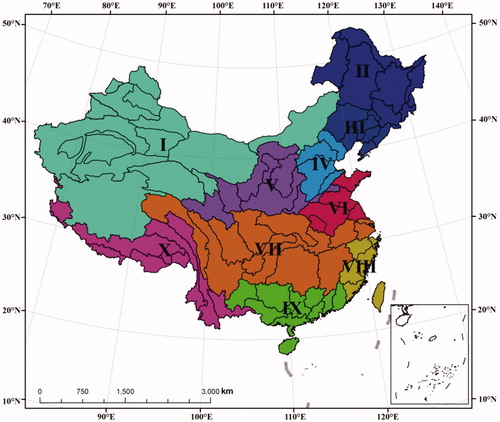
There are 10 first-order river basins and 80 second-order river basins in China (Wang et al. Citation2007; Yu et al. Citation2015) (). The regional disparity of water resources is great because of its vast territory and significant differences in the ecological environments. Influenced by the monsoon climate, the spatial distribution of water resources in China is uneven (Liu Citation2013; Tu et al. Citation2016). In general, the water resources increase gradually from inland in the northwest to the southeast coastal region. Moreover, the northern region of China is facing increasingly severe water scarcity, whereas the water resources of the southern part of the country are rich. The regional combination of soil and water resources is not aligned, and the contradiction between supply and demand of water resources differs largely between regions (Lei et al. Citation2007; Shi et al. Citation2014).
Figure 1. Spatial distributions of 10 first-order basins. I refers to Northwestern River Basin; II refers to Songhua River Basin; III refers to Liaohe River Basin; IV refers to Haihe River Basin; V refers to Yellow River Basin; VI refers to Huaihe River Basin; VII refers to Yangtze River Basin; VIII refers to Southwestern River Basin; IX refers to Pearl River Basin; X refers to Southwestern River Basin.
2.2. Data
The daily meteorological data, including precipitation and temperature, were derived from 839 stations present in China and can be downloaded for free from the China Meteorological Data Sharing Service System. However, the spatial distribution of meteorological stations is uneven, and then the Tropical Rainfall Measuring Mission (TRMM) data (TRMM3B42) with a spatial resolution of 0.25°×0.25°, available at https://trmm.gsfc.nasa.gov/, was utilized to construct the time-series dataset of interpolated stations. In this article, the interpolated stations were mostly distributed in Tarim Basin and northern Tibet Plateau and its eco-environment was similar to that of Qaidam Basin. Thus, the statistical spatial downscaling algorithm of TRMM (EquationEquation (1)(1)
(1) ) was adopted in this study (Jia et al. Citation2011; Liu Citation2013; Guo et al. Citation2017). In addition, the overall precision of the interpolated temporal precipitation data was 92.6%, which could fulfil the data accuracy requirements for this research.
(1)
(1)
where Pd refers to the daily precipitation of the meteorological stations; ptrmm is the daily precipitation derived from 3-hourly precipitation of TRMM3B42.
In order to obtain the daily precipitation from 3-hourly precipitation rate based on TRMM3B42, we firstly multiply each 3-hourly precipitation rate by 3 hours to calculate the precipitation for each 3-hour period utilizing FORTRAN. Then, we accumulate all the 3-hourly precipitation in defined 24-hour period to get the daily precipitation.
The land use types at 1:100,000 were obtained from the Institute of Remote Sensing and Digital Earth, Chinese Academy of Sciences, which were acquired from Landsat TM/ETM+. The digital elevation model (DEM) data with a spatial resolution of 90 m was downloaded for free at http://srtm.csi.cgiar.org. The NDVI dataset of MOD13A2 was organized in grid cells of 1 km ×1 km, with15-day intervals. The evapotranspiration data were obtained from MOD16A3, which was a yearly composite product and produced at 500 metre pixel resolution. These two datasets were obtained from National Aeronautics and Space Administration Earth Observing System, available at https://ladsweb.modaps.eosdis.nasa.gov.
2.3. Method
2.3.1. Factor standardization
Standardization must be applied to eliminate the unit difference among factors which are measured in different dimensions (Guo et al. Citation2017). Moreover, factors play different roles in the spatial distribution of water resources. For example, precipitation can increase regional water resources, which is a positive factor. In contrast, evapotranspiration can decrease the surface water resources, which is identified as a negative factor. Therefore, different types of factors can be processed using the following equations (Zhang et al. Citation2013; Guo et al. Citation2017):
(2)
(2)
where Vi refers to the standardized factor of Ii; Ii,min is the minimum value of Ii; and Ii,max is the maximum value of Ii.
2.3.2. Partition-weight assignment method
Assigning an appropriate weighting for each factor based on its relative importance in the evaluation system is of great importance. Due to the significant differences in the eco-environments over the whole study region, factors have different effects on the water cycle processes and the distribution of water resources (Rosegrant et al. Citation2000; Guo and Wang Citation2005; Guo et al. Citation2017). According to the correlation coefficients between water resources and their relative factors for the ten first-order basins (), their weighting has been determined utilizing the AHP. The processes of calculating the weighting are shown in .
Table 1. Scale of binary comparison.
Table 2. Correlation coefficients between water resources and their associated factors for the 10 first-order basins in China.
Table 3. Relative weighting factors for the Analytic Hierarchy Process (AHP) (taking Yangtze River Basin as an example).
Table 4. Relative weighting of different catchment types.
2.3.3. The gridded method for water resource distribution in China
Transferring statistical areal water resource data to continuous data by constructing the regression modelling method of dependent variables and independent variables based on GIS and RS, can better reflect the spatial–temporal distribution difference of the statistical data (Bindra et al. Citation2003;Venot et al. Citation2011; Kang et al. Citation2012; Huang Citation2015; Guo et al. Citation2017). The same projection and spatial resolution should be adopted for all associated factors in the gridded water resource distribution. The gridded method is as follows (Guo et al. Citation2017; Wang et al. Citation2017):
(4)
(4)
where Sj refers to the water resource of gridded cell j; S refers to the statistical value of one basin; m is the total number of gridded cells in one basin; n refers to number of associated factors; Aij refers to the standardized factor of i; and wi refers to weight of factor i.
2.3.4. Accuracy verification method
To quantitatively test the spatialization accuracy of the gridded water resource distribution, the statistical sum of different third-order basins or administrative units, based on gridded water resource distribution, were obtained based on the Zonal Statistics Tool of ArcGIS 10.2. Then, the spatialization error between simulated values and statistical data was calculated by EquationEquation (5)(5)
(5) as follows (Tu et al. Citation2016; Wang et al. Citation2017; Guo et al. Citation2017):
(5)
(5)
where SE is the spatialization error; Wst refers to the statistical data of water resources for third-order basins or administrative units; and Wsi refers to the simulated value of water resources for third-order basins or administrative units.
3. Associated factors of water resources
The selection of associated factors plays an important role in distributing the water resources. And these factors should be indicative, representative, and operational (Cai et al. Citation2013; Wang et al. Citation2014; Tu et al. Citation2016) ().
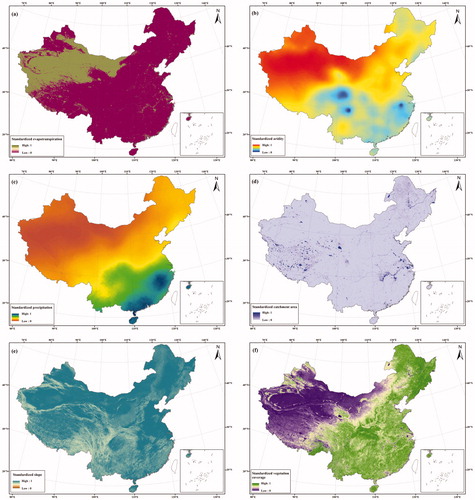
(1) Precipitation, aridity, and evapotranspiration
Considering the processes of the water cycle, liquid water turns into vapour by evaporation and evapotranspiration and water vapour can change into liquid (precipitation) or solid (snow) under certain conditions (Wang et al.,Citation2017). The process of evapotranspiration can reduce the surface water resource (river or lake), whereas precipitation can contribute to surface water resources. There is a significant positive relationship between annual precipitation and water resources. In contrast, there is a negative relationship between evapotranspiration and water resources. The amount of evapotranspiration reflects the actual water loss while the aridity can indicate the potential capacity of water evapotranspiration (Tu et al. Citation2016). Thus, annual rainfall, aridity, and water evapotranspiration, as meteorological factors, are important indicators of the regional water resources available. The annual water evapotranspiration was derived from MOD16A3. The annual precipitation and aridity were calculated based on daily meteorological data by EquationEquations (6)(6)
(6) and Equation(7)
(7)
(7) , respectively.
(6)
(6)
where pyear refers to the annual precipitation (mm); pdaily refers to the daily precipitation (mm); A represents the aridity index, refers to the sum of temperature larger than 10 °C in one year, and P10 is the total precipitation while the temperature is higher than 10 °C.
(2) Slope
As an indicator of the underlying surface conditions, the topographic features greatly affect the storage of water resources (Guo et al. Citation2017). The velocity of water flow increases with enlarging slope or topographic relief. In addition, the water holding capacity becomes smaller as the water gathering time becomes shorter due to quickly receding water, which leads to severe water and soil loss. Thus, slope has a negative relationship with water resource availability. This factor was calculated based on dataset of DEM with the slope tool of ArcGIS 10.2.
(3) Catchment area
Catchment area refers to the percentage of catchment in one square kilometre. Surface catchments, including river, lake, wetland, and glacier, contribute to a large proportion of total water resources (Xia et al. Citation2011; Kang et al. Citation2012; Liu Citation2013). Therefore, water resources and catchment area have a positive relationship. However, there are great differences between relative contribution rates for the types of catchments. According to the water holding capacity, the relative weights of different types of catchments were determined (). The factor for catchment area was calculated based on dataset of land use.
(4) Vegetation coverage
Regional vegetation coverage plays an important role in water conservation and the regulation of the surface runoff. Forest has strong storage capacity when it comes to water, which can increase soil infiltration rate and underground runoff, and then decrease runoff in the rainy season (Tu et al. Citation2016; Guo et al. Citation2017). Therefore, it can change the annual distribution of runoff. Grassland can improve the storage capacity of a lake, mitigate rainfall erosivity and prevent the soil erosion. Vegetation conditions (vegetation coverage and vegetation types) have an impact on the process of evaporation, interception and the yield of runoff. On the other hand, the grown of vegetation is largely restrained by the spatial distribution of water resource. Therefore, the vegetation coverage and water resources have a positive relationship. This factor was calculated based on MOD13A2 by EquationEquation (8)(8)
(8) (Guo et al. Citation2017).
(8)
(8)
where VC refers to vegetation coverage; ndviveg refers to the maximum value of pure vegetation at a confidential level (CL) of 0.95; ndvisoil is the minimum value of pure bare soil (CL= 0.05).
Figure 2. Spatial patterns of standardized factors (a) evapotranspiration; (b)aridity; (c) precipitation; (d) catchment area; (e) slope;(f) vegetation coverage.
4. Results
4.1. Process of creating a gridded water resource distribution
The six associated factors were first standardized to eliminate the dimensional difference (). Then, according to the correlation coefficients between water resource and its associated factors for the 10 first-order basins, the weight assignments were determined by AHP (). Third, the spatial distribution of comprehensive weight for all factors was calculated. Finally, the gridded water resource distribution was obtained based on comprehensive weightings for the 10 first-order basins and statistical water resources of the second-order basins ().
Figure 3. Gridded spatial distrubution of water resources.
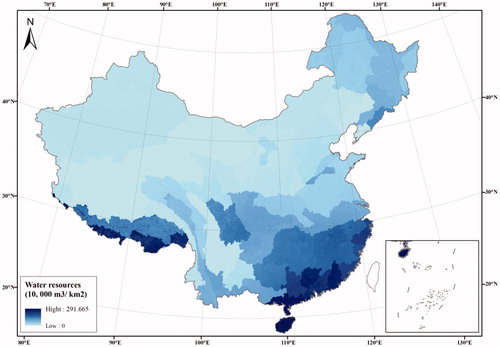
Table 5. Weights of factors for ten first-order basins.
4.2. Spatial patterns of the gridded water resource distribution
As shown in , there is a decrease in water resources from northwest to southeast across the country which consistent with spatial patterns of precipitation. The water resources of the Yangtze River Basin, Songhua River basin, Southeastern River Basin, Pearl River Basin, and Yarlung Zangbo River are relatively rich. On the contrary, water resources in the Yellow River Basin, Northwestern River Basin are much smaller. In the south and northwest of China, the water resources are mostly derived from precipitation. However, glacier melting water was the main water source of the Northwestern River Basin, especially for western part of this basin. Due to the wide distribution of glaciers among Tianshan Mountain, Kunlun Mountains, Altai Mountains, the amount of water resource was much larger in the northwest inland region than in the Inner Mongolia Plateau. The Southwestern River Basin has less water resources than Yangtze River Basin because of its steep terrain.
4.3. Spatial patterns of water resource deficit
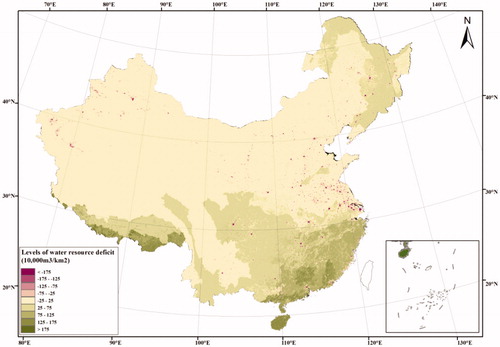
The population spatialization data with a spatial resolution of 1 km ×1 km was utilized to calculate the water resource deficit (WRD) (). However, the water consumption per capita differed greatly over the study region, so the per capita water consumption of 31 provincial administrative units was combined to obtain the spatial distribution of the WRD. As is shown in , there are severer water shortages in northern China relative to southern China. Regions in the Yangtze River Basin, Southeastern River Basin, southern Tibet River basin, Pearl River Basin, and Songhua River basin have relatively plentiful water resources. Most of northern and northwestern China belong to the level of supply and demand balance (−25 < WRD ≤ −25) due to the sparse population and scarce water resources. In addition, regions with severe WRDs are concentrated in urban belts, such as the Beijing-Tianjin-Hebei Region, the Central Plains Economic Region, the Shanghai-Nanjing-Hangzhou Economic Belt, and the Pearl River Delta Economic Belt.
Figure 4. Spatial patterns of population density.
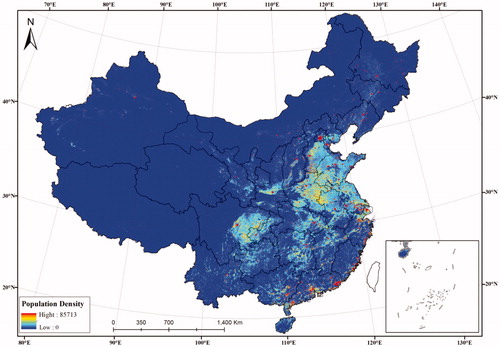
Figure 5. Spatial patterns of water resource deficit.
5. Discussions
5.1. Accuracy assessment for the gridded water resource distribution
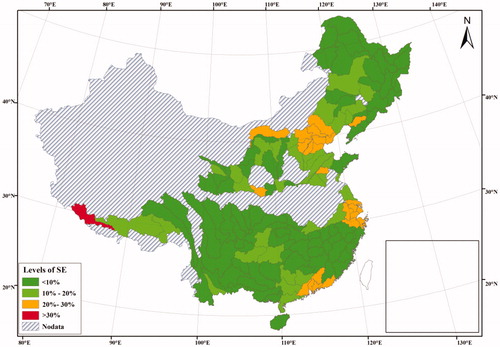
As shown in , 148 third-order basins, derived from the Ministry of Water Resources of the People’s Republic of China and water resources bulletins of provinces, were utilized to test the accuracy of gridded water resource distribution due to the lack of data for the other third-order basins. The improved water resource gridded method was proved to be efficient with the overall SE of 7.68%. There were 83 third-order basins with SE ranging 0–10%, which were mostly distributed in the Yangtze River Basin, Songhua River basin, and the upper reaches of Yellow River Basin. This is because the spatial distribution of water resources was mainly influenced by natural factors, such as precipitation, vegetation, and slope (Cai et al. Citation2013; Deng et al. Citation2014; Ge et al. Citation2014; Wang et al. Citation2014). The SE of 37 third-order basins ranged 10–20%, which were mainly distributed in the middle and lower reaches of Yellow River Basin, Yarlung Zangbo River basin, and Liaohe River Basin. The SE of 27 third-order basins ranged 20%–30%, which was greatly affected by urbanization and agricultural irrigation. There was 1 third-order basin with SE greater than 30%. The spatial distribution of water resources here was greatly influenced by glaciers and desert (Wu et al. Citation2014).
Figure 6. The spatialization error of gridded water resource distribution based on 127 third-order basins.
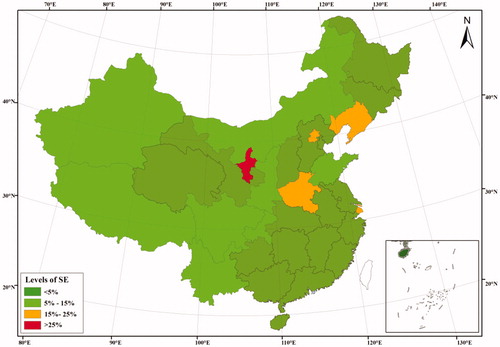
In order to further examine the spatialization results of gridded water resource distribution, the statistical data of provincial administrative units were applied to assess the spatialization precision. shows that the SE of 18 provincial administrative units is lower than 5%, and SE of 8 provincial administrative units ranged between 5% and 15%. There were 3 provincial administrative units with SE ranging 15–25%, which resulted from intensive human activities. The SE of the Ningxia Hui Autonomous Region was greater than 25%, which resulted from the widely distributed desert and the large amount of water consumption required for Industry and agriculture in the region (Zhang et al. Citation2011). The overall SE was 7.25%, which indicated the high efficiency of this improved water resource gridded method for China.
Figure 7. The spatialization error of gridded water resource distribution based on provincial administrative units.
5.2. Relationship between GDP density and water resource distribution
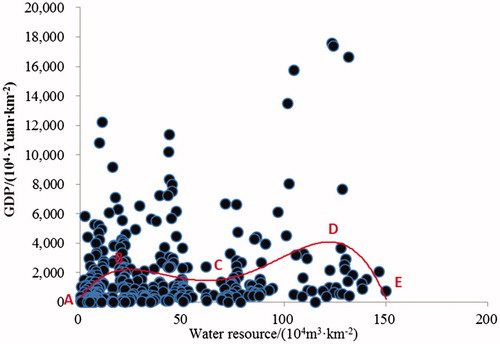
shows a double-peak relationship between GDP density and water resources (WR). This indicates indicated that there are four types of cities according to their relative supply and demand for WR. In the AB section of the curve (WR <20 × 104 m3·km−2), the GDP increased with rising water resource distribution. Water is an indispensable factor for industrial and agricultural production, and in this type city, which included Lanzhou, Yinchuan, Urumchi, with scare WR, there is a positive relationship between GDP intensity and WR. In the BC section (20 × 104 m3·km−2 ≤ WR <70 × 104 m3·km−2), there was a negative relationship between GDP density and WR, and in this type city, which included Tianjin, Zhengzhou, Jinan, Taiyuan, the social development greatly exceeded the carrying capacity of regional water resources so that the economic development was restrained by the water resources available. In the CD section (70 × 104 m3·km−2 ≤ WR <130 × 104 m3·km−2), there was a positive relationship between WR and GDP density. For these cities, which included Suzhou, Hangzhou, Qingdao, Wuxi, Chengdu, Shanghai, Kunming, the abundant WR were conducive to the development of different industries(Velazquez Citation2006). In the DE section (WR ≥130 × 104 m3·km−2), the GDP intensity decreased with the increased water resources. For this type city, which included Guangzhou, the WR were not abundant enough to support the rapid development of urbanization and different industries. Overall, the section AC could indicate the relationship between economic development and water resource availability for the cities of Northern China while section of CE would indicate effects of water resource availability on the development of different industries.
Figure 8. Relationship between GDP density and water resource distribution.
6. Conclusions
Considering the spatial differentiation patterns of the eco-environments for the 10 first-order basins, six factors, including precipitation, aridity, evapotranspiration, slope, vegetation, and catchment area, were introduced to develop an improved water resource gridded model for China based on the partition-weight assignment method. Then the spatial distribution of WR and their impact factors were analysed. The key findings can be summarized as follows:
The improved gridded water resource distribution based on second-order basins has high applicability for China, with the overall SE of 7.68% for third-order basins and 7.25% for provincial administrative units.
The spatialization was more precise for the Yangtze River Basin, Songhua River basin and Southern River Basin than for the middle and lower reaches of Yellow River Basin, Huaihe River Basin and Northwestern River Basin.
Human activities could greatly affect spatialization precision. The relationship between WR and GDP density differed depending on the amount of urbanization in a region and the geographical locations.
Disclosure statement
No potential conflict of interest was reported by the authors.
Additional information
Funding
Related Research Data
References
- Alejandro CM, Hewings GJD. 2011. Water price and water sectoral reallocation in Andalusia. A computable general equilibrium approach. Environ Econ. 12(6):217–227.
- Bao C, Chen XJ. 2015. The driving effects of urbanization on economic growth and water use change in China: a provincial-level analysis in 1997–2011. J Geogr Sci. 25(5):530–544.
- Bao C, He DM. 2015. The causal relationship between urbanization, economic growth and water use change in provincial China. Sustainability. 7(12):16076–16085.
- Bindra SP, Muntasser M, El Khweldi M, El Khweldi A. 2003. Water use efficiency for industrial development in Libya. Desalination. 158(1–3):167–178.
- Cai XM. 2008. Water stress, water transfer and social equity in Northern China–implications for policy reforms. J Environ Manag. 87(1):14–25.
- Cai WJ, Chang CP, Song S, Li J, Zhang F, Li FD. 2013. Spatial distribution and sources of groundwater phosphorus in Dezhou Region. Chin J Eco-Agric. 21(4):456–464. (In Chinese)
- Chen Y, Zhang DQ, Sun YB, Liu XN, Wang NZ, Savenije HHG. 2005. Water demand management: A case study of the Heihe River Basin in China. Phys Chem Earth Parts A/B/C. 30(6–7):408–419.
- Daniels PL, Lenzen M, Kenway SJ. 2011. The ins and outs of water use—a review of multi-region input–output analysis and water footprints for regional sustainability analysis and policy. Econ Syst Res. 23(4):353–370.
- Deng X, Zhang F, Wang Z, Li X, Zhang T. 2014. An extended input output table compiled for analyzing water demand and consumption at county level in China. Sustainability. 6(6):3301–3320.
- Do VH, Thomas-Agnan C, Vanhems A. 2015. Accuracy of areal interpolation methods for count data. Spat Stat. 14:412–438.
- Duarte R, Sánchez-Chóliz J, Bielsa J. 2002. Water use in the Spanish economy: an input–output approach. Ecol Econ. 43(1):71–85.
- Geng Y, Wang ML, Sarkis J, Xue B, Zhang L, Fujita T, Yu XM, Ren WX, Zhang LM, Dong HJ. 2014. Spatial–temporal patterns and driving factors for industrial wastewater emission in China. J Clean Prod. 76:116–124.
- Ge YC, Li X, Tian W, Zhang YL, Wang WZ, Hu XL. 2014. The impacts of water delivery on artificial hydrological circulation system of the middle reaches of the Heihe River Basin. Adv Earth Sci. 29285–294. (In Chinese)
- Guo HM, Wang YX. 2005. Geochemical characteristics of shallow groundwater in Datong Basin, northwestern China. J Geochem Explor. 87(3):109–120. In Chinese)
- Guo B, Zhang FF, Yang G, Jiang L. 2017. Improved method of freeze–thaw erosion for the Three-river source region in the Qinghai–Tibetan Plateau, China. Geomat, Nat Haz Risk. 8(2):1678–1694.
- He ZA, Zhao K. 2000. Investigation on drinking water quality in rural areas of Hubei Province. J Environ Health. 17(2), 87–89.
- Huang GW. 2015. From water-constrained to water-driven sustainable development—a case of water policy impact evaluation. Sustainability. 7(7):8950–8964.
- Jia SF, Zhu WB, Lű AF, Yan TT. 2011. A statistical spatial downscaling algorithm of TRMM precipitation based on NDVI and DEM in the Qaidam Basin of China. Remote Sens Environ. 115(12):3069–3079.
- Kang YH, Wang RS, Wan SQ, Hu W, Jiang SF, Liu SP. 2012. Effects of different water levels on cotton growth and water use through drip irrigation in an arid region with saline ground water of Northwest China. Agric Water Manag. 109:117–126.
- Lei Y, Jiang D, Yang XH, Wang JH. 2007. The water distribution model application based on spatial information technology. J Geo-Inform Sci. 564–69. (In Chinese)
- Li SS, Ma Y. 2014. Urbanization, economic development and environmental change. Sustainability. 6(8):5143–5161.
- Liu CM. 2013. Spatial analysis of agricultural water resources based on GIS and AHP. Wuhan: Central China Normal University.
- Liu S. 2013. Water productivity per cubic meter of water in Zhangye City. Water Sav Irrig. 217:29–30. (In Chinese).
- Jiang XH, Liu CM. 2010. The response of vegetation to water transport in the lower reaches of the Heihe River. J Geogr Sci. 20(5):701–797.
- Rosegrant MW, Ringler C, McKinney DC, Cai X, Keller A, Donoso G. 2000. Integrated economic-hydrologic water modelling at the basin scale: The Maipo River Basin. Agric. Econ. 24(1):33–46.
- Shi JM, Wang L, Wang XJ. 2011. A study on changes and driving factors of agricultural water supply and demand in Zhangye after water reallocation of the Heihe River. Resour Sci. 331:489–1497.
- Shi QL, Chen SY, Shi CC, Wang Z, Deng XZ. 2014. The impact of industrial transformation on water use efficiency in northwest region of China. Sustainability. 7(1):56–74.
- Tian W, Li X, Cheng GD, Wang XS, Hu BX. 2012. Coupling a groundwater model with a land surface model to improve water and energy cycle simulation. Hydrol Earth Syst Sci. 16(12):4707–4723.
- Tu MG, Wang FT, Zhou Y, Wang SX. 2016. Gridded water resource distribution simulation for China based on third-order basin data from 2002. Sustainability. 8(12):1309–1323.
- Velazquez E. 2006. An input-output model of water consumption: aNALYSING intersectoral water relationships in Andalusia. Ecol Econ. 56(2):226–240.
- Venot J-P, Bharati L, Giordano M, Molle F. 2011. Beyond water, beyond boundaries: Spaces of water management in the Krishna river basin, South India. Geogr J. 177(2):160–170.
- Wang WP, Gao L, Liu P, Hailu A. 2014. Relationships between regional economic sectors and water use in a water-scarce area in China: A quantitative analysis. J Hydrol. 515:180–190.
- Wang JX, Huang JK, Rozelle S, Huang QQ, Blanke A. 2007. Agriculture and groundwater development in northern China: trends, institutional responses, and policy options. Water Policy. 9(S1):61–74.
- Wang SX, Wang LS, Zhou Y, Wang FT, Liu XF, Xu CN, Wu L. 2017. Spatial allocation of water resources in the Yangtze River basin. Sci Surveying Mapping. 8:33–39. (In Chinese)
- Wang H, You JJ. 2008. Advancements and development course of research on water resources deployment. J Hydraul Eng. 10:1168–1175.
- Wu F, Zhan JY, Zhang Q, Sun ZX, Wang Z. 2014. Evaluating impacts of industrial transformation on water consumption in the Heihe River Basin of Northwest China. Sustainability. 6(11):8283–8296.
- Xia J, Zhai JL, Zhan CS. 2011. Some reflections on the research and of development water resources in China. Adv Earth Sci. 26:905–915. (In Chinese)
- Yu XM, Geng Y, Heck P, Xue B. 2015. A review of China’s rural water management. Sustainability. 7(5):5773–5792.
- Zhang L, Heerink N, Dries L, Shi XP. 2013. Water users associations and irrigation water productivity in northern China. Ecol Econ. 95:128–136.
- Zhang ZY, Shi MJ, Yang H, Chapagain A. 2011. An input–output analysis of trends in virtual water trade and the impact on water resources and uses in China. Econ Syst Res. 23(4):431–446.
- Zhou S, Huang YF, Yu BF, Wang GQ. 2015. Effects of human activities on the eco-environment in the middle Heihe River Basin based on an extended environmental Kuznets curve model. Ecol Eng. 76:14–26.