
 ?Mathematical formulae have been encoded as MathML and are displayed in this HTML version using MathJax in order to improve their display. Uncheck the box to turn MathJax off. This feature requires Javascript. Click on a formula to zoom.
Abstract
A geophysical approach, based on the integration of satellite differential interferometric SAR technique and in situ geoelectrical and seismic methods, was applied with the aim to characterize a portion of urban area of Avigliano (PZ) town in Basilicata Region (southern Italy) affected by ground instability phenomena. Satellite analysis helped to discriminate areas of the town affected by superficial deformations and to monitor the dynamic behaviour of the structures located in these areas. Results from geoelectrical and seismic (active and passive) methods were compared with direct data (stratigraphic) and were interpreted with the aim to reconstruct the geometry of the subsoil. The joint application of both in situ techniques allowed the overcoming of the specific limits of each method and to improve the poor quality of the data due to the noise conditions typical of measurements carried out in urban areas. A preliminary geophysical model of the subsoil was obtained. The geophysical contrasts highlighted the presence of lithological discontinuities due to the superficial deformation processes that are affecting the portion of the investigated urban area. All the information has been transferred to the public administration technicians involved in the mitigation of hydrogeological risk in Basilicata Region.
Introduction
In line with a sustainable development vision, a successful management of the urban growth (United Nations – Urbanization Prospects: The 2018 Revision) cannot anymore fail to consider the urban underground space as a resource (Bobylev Citation2016; Bobylev and Sterling Citation2016; Doyle Citation2016) that requires to be integrated in urban planning policies (Admiraal and Cornaro Citation2016; Van der Meulen et al. Citation2016). Whether we look at the subsoil as a strategic source of energy (e.g. groundwater, geothermal fluids) or as a space to host structures and infrastructures, tailored and innovative methodological approaches are required for an as much as possible complete modelling (Showstack Citation2014; Mielby et al. Citation2016). A crucial step for a geological risk mitigation strategy in urban areas is an improved subsoil exploration, characterization, and modelling from a few to several hundred meters in depth (Wycisk et al. Citation2009; Miller Citation2013). By its very nature, the urban environment imposes strong restrictions on direct surveys which, while providing valuable information regarding vertical variations of subsoil properties, have the limitation of being point-scale measures (Lapenna Citation2017). Thanks to the diverse range of now mature exploration methodologies, applied geophysics holds a great potential for the collection of spatially distributed data that can be both combined with each other and with data derived from direct surveys. Geophysical methods have been applied in environmental and engineering studies with the aim to locate and characterize near-surface geological structures (Caputo et al. Citation2003; Giocoli et al. Citation2007; Galli et al. Citation2017), aquifers (Vereecken et al. Citation2006), landfills (Konstantaki et al. Citation2015), landslides (Jongmans and Garambois Citation2007; Perrone et al. Citation2014), liquefaction phenomena (Giocoli et al. Citation2014), to investigate site for building foundations (Soupios et al. Citation2007), to locate underground excavations (Kovačević et al. Citation2013), to evaluate earthquake hazard and to support seismic microzonation studies (Boncio et al. Citation2011; Gallipoli et al. Citation2011; Mucciarelli et al. Citation2011; Vignola et al. Citation2018).
While most of the published studies in these research areas have been carried out in rural areas, the application of geophysical methods in urban areas can still be considered as an emerging topic. The main limitations encountered in the urban environment mainly concern the high level of noise, that is mainly due to human activities, such as traffic, work sites, etc., as well as the logistic constraints, i.e. presence of pavement, car traffic, presence of pedestrians, which can, in turn, also influence the data quality. Nevertheless, applied geophysics has been used in urban contexts to assess the possible site amplification effects linked with earthquakes (Mucciarelli et al. Citation2003, Citation2011), to estimate the fundamental frequencies and damping of buildings (Gallipoli et al. Citation2009), for detecting shallow cavities in historical areas (Piscitelli et al. Citation2007), to delineate fracture zones (Mehta et al. Citation2017), to detect possible causes of subsidence effects (Manunta et al. Citation2008; Scifoni et al. Citation2016; Leucci et al. Citation2017; Solari et al. Citation2017) and to monitor subsurface leakage in industrial and nuclear areas (Rucker et al. Citation2013; Kuras et al. Citation2016).
This paper reports the results related to the differential interferometric SAR satellite technique, geoelectrical and seismic methods applied in the framework of an Operational Agreement signed by the Institute of Methodologies for Environmental Analysis (IMAA) of the Italian National Research Council (CNR) and the Soil Protection Office of Basilicata Region aiming at supporting the phases of diagnostics and monitoring of instability phenomena affecting areas and structures of the urban centre of the Avigliano (PZ) town in Basilicata Region (southern Italy). To this end, a methodological approach to investigate ground deformation, to characterize the geometry of phenomenon and to monitor slope stability, successfully applied by other authors in rural context (Perrone et al. Citation2006; Calò et al. Citation2014; Manconi et al. Citation2014; Giocoli et al. Citation2015; Wilkinson et al. Citation2016), is here tested in a urban environment. The approach is based on a top-down philosophy where satellite and ground-based geophysical techniques are applied in a coordinated way. The paper highlights how the integration of different survey techniques in urban areas is to be encouraged in order to provide more realistic results. These can contribute to achieve a reliable geological model of the subsoil that can be used to better manage the geological risk affecting the investigated area.
Study area
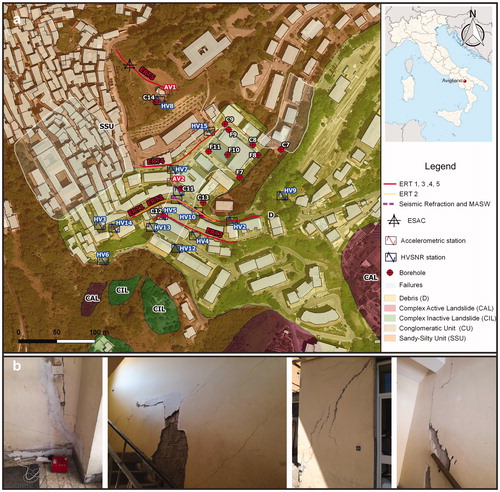
Avigliano is an urban centre of north-western Basilicata, not far from Potenza (Basilicata Region, Italy). As testified by several authors (Polemio and Sdao Citation1999; Sdao et al. Citation2005), the urban area of Avigliano and the surrounding areas are heavily affected by ancient and recent landslides, classifiable as a multiple and complex roto-translational-earthflow landslide (Cruden and Varnes Citation1996), periodically undergoing to partial or total reactivation. Along with major landslides, significant instability phenomena affect the most superficial and altered layer of sands formations and/or slope debris layer, abundantly reported in the urban area, resulting in heavy damage to buildings and facilities. In particular, the sector of the Avigliano town located near Via Roma (40.729608 N, 15.719757 E) has long been affected by superficial deformation phenomena, with apparent impacts on the buildings that are therein (). As reported in the geological maps drawn up for the Seismic Microzonation activities (Seismic Microzonation of Basilicata Region, 2018:https://rsdi.regione.basilicata.it/servizi-in-linea/) and for the local general urban development plan, such phenomena could be ascribed to differential failures of detrital nature of the material used to fill an old channel.
Figure 1. (a) Sketch map of geophysical and geotechnical survey locations superposed to the geological map of the central urban area of Avigliano (PZ). (b) Accelerometer (SARA-Electronic Instruments SL06) used in the ‘palazzo Mancusi’ (AV2) along with photos of structural damages.
Materials and methods
In order to achieve a characterization of the site as accurate as possible, a top-down approach was applied by using a suite of geophysical methods. Firstly, satellite SAR data were analyzed by means of the Small BAseline Subset (SBAS) DInSAR algorithm (Lanari et al. Citation2004; Bonano et al. Citation2012) to highlight the superficial deformation phenomena at a coarser scale. Afterwards, between June 2016 and February 2017, a series of in situ geoelectrical and seismic methods were applied ():
Five Electrical Resistivity Tomographies (ERTs).
One refraction seismic profile.
One active seismic array Multichannel Analysis of Surface Waves (MASW).
One bi-dimensional passive seismic array processed with Extended Spatial Auto-Correlation (ESAC) technique.
15 single-station seismic ambient noise measurements (analyzed by means of Horizontal-to-Vertical Noise Spectral Ratio, HVNSR).
Local and regional earthquake recordings by accelerometers in two sites (analyzed by means of Horizontal-to-Vertical Spectral Ratio, HVSR).
The SBAS-DInSAR technique for surface deformation analysis
Differential Synthetic Aperture Radar Interferometry (DInSAR) (Gabriel et al. Citation1989) is a well-established microwave remote sensing technique that allows us to investigate surface displacements affecting wide areas. This is accomplished through the generation of spatially dense deformation maps ([tens of thousands of km2] with centimetre to millimetre accuracy. To this aim, DInSAR exploits the phase difference (i.e. interferogram) between pairs of SAR images, collected over an investigated area at different times. Such data pairs are acquired with nearly the same illumination geometry and from sufficiently close flight tracks, whose separation is typically referred to as baseline. More specifically, the DInSAR technique analyses the so-called differential interferograms, generated by removing from an interferogram its topography-related phase component, calculated by means of an external digital elevation model (DEM) of the investigated area.
Recently, DInSAR has evolved from the analysis of single deformation episodes towards the study of the temporal evolution of the detected displacements via the generation of deformation time series. To this aim, the DInSAR community has benefitted from the availability of long-term SAR data archives collected since 1992, as those acquired from the European Space Agency (ESA) ERS and ENVISAT satellite systems. Accordingly, in the past decades several advanced DInSAR techniques have been developed. Such methods are mainly based on a proper combination of a set of multi-temporal interferograms relevant to an area, in order to compute the deformation time series. Among these techniques, the one referred to as Small BAseline Subset (SBAS) algorithm (Berardino et al. Citation2002) generates deformation time series and corresponding mean deformation velocity maps, projected along the radar line of sight (LOS). This is carried out by exploiting, and properly combining, a large number of DInSAR interferograms, produced by interferometric SAR data pairs with short temporal and spatial baselines between the acquisition orbits, in order to limit the noise (decorrelation) effects (Zebker and Villasenor Citation1992). Benefitting from the generated small baseline interferograms, the SBAS approach allows retrieving mean deformation velocity maps and corresponding time series for each coherent pixel. It is worth noting that the achieved accuracy is of about 1–2 mm/year for what concerns the mean deformation velocity information, and 5–10 mm for the single deformation measurement (Casu et al. Citation2006).
Finally, the SBAS approach has proven to be an effective tool able to carry out multi-scale (Lanari et al. Citation2004) and multi-sensor surface deformation analyses (Pepe et al. Citation2005; Bonano et al. Citation2012). Such a peculiarity allows providing insights into the spatial and temporal characteristics of the detected displacements at both regional (medium resolution analysis) and local (full resolution analysis) spatial scales; moreover, it allows guaranteeing the continuity in the monitoring of the Earth’s surface deformation phenomena, as well. In particular, at the regional scale the SBAS approach exploits average (multi-look) interferograms to detect and analyse deformation phenomena relevant to very large areas, with a ground spatial resolution ranging from about 30 to 100 m (Sansosti et al. Citation2014). Moreover, at the local (full resolution) scale, the SBAS approach exploits single-look interferograms, which are generated at the full sensor spatial resolution (down to three meters in the case of X-band stripmap data acquired by the Italian COSMO-SkyMed constellation), to study localized deformation. This is particularly the case of urban areas or slope instability zones, where very localized displacements associated to ground subsidence or landslides phenomena can be detected at the scale of single buildings and man-made features (Bonano et al. Citation2013; Arangio et al. Citation2014).
Electrical resistivity tomography
The electrical resistivity tomography technique provides the imaging of the subsoil electrical properties in two or three spatial dimensions. Linking the measured electrical resistivity values with the lithologic nature of the outcropping soils allows reconstructing the geological and structural setting with a good approximation and highlighting any surfaces of discontinuity in areas affected by instability phenomena (Perrone et al. Citation2014). Electrical current is injected into the subsoil via a pair of electrodes and the difference of potentials induced is measured at another pair of electrodes. Electrodes can be placed on the ground by using different configurations (array), depending on the resolution and depth of investigation to be achieved.
A total number of five ERT were carried out in the area: ERT 1, 2 and 3 intersect the area showing ground instability phenomena, whereas ERT 4 and 5 are located to the NW of the target area (). Due to the similar resistivity distribution with ERT 1, in this paper ERT 2 is not reported. Apparent electrical resistivity values were acquired by means of a Syscal Pro Switch 48 (IRIS Instruments) georesistivimeter connected to two multi-electrode cables, by using Wenner and dipole–dipole arrays, with a constant spacing ‘a’ between the adjacent electrodes (e.g. from 2.5 to 5 m). Along each profile, we applied different combinations of dipole length (i.e. 1a, 2a, 3a) and ‘n’ numbers of depth levels (n ≤ 6), obtaining a depth of investigation (DOI) ranging from about 20 m (for a = 2.5 m) to about 30 m (for a = 5 m).
The number and spacing of electrodes () were chosen taking into account the desired target resolution and logistical constraints. In order to improve the coupling between electrodes and ground, each hole was filled with bentonite and salty water. Furthermore, thanks to the help of the local administration technicians underground utilities were well localized helping to interpret the resistivity distribution. Apparent electrical resistivity bad-quality data were filtered out analysing the data quality parameter returned by the Syscal Pro named ‘Dev’ or Q-factor (Deceuster et al. Citation2013).
Table 1. ERT details: electrode spacing (a), electrode number (e), profile length (L), array (W: Wenner; DD: dipole–dipole), depth of investigation (DOI).
Subsequently, these data were inverted by means of the RES2DINV software (Loke Citation2013).
Seismic methods
The basic feature of ambient vibration measurements has been providing a fast and cheap prospecting tool useful to supply subsoil information. Having to perform measurements in urban environment, we have used fast and non-invasive approaches: single-station seismic ambient noise measurements (Mucciarelli Citation1998; Chávez-Garcı´a and Cárdenas Citation2002; Gallipoli et al. Citation2004; Mucciarelli et al. Citation2011), earthquakes recordings (HVSR, Castro et al. Citation1998; Di Giulio et al. Citation2005; Gallipoli et al. Citation2014) and noise array measurements (Okada Citation2003). The joint use of single-station and multi-station ambient vibration measurements could provide important contribution to the development of a reliable geological model of the area of interest and to feed numerical procedures devoted to the assessment of seismic response (Bard Citation1999).
Spectral ratio techniques by seismic noise and earthquakes
The fifteen single-station seismic ambient noise measurements were carried out in the urban area of Avigliano (PZ) using a 24 bit digital tromograph (Moho-Tromino). Each acquisition had a duration of 14–20 min and a sampling frequency of 128 Hz. During the acquisition great attention has been paid to the choice of the sites, preferring, when possible, gardens and taking care to avoid underground services.
Prior to the computation of HVNSR of each site, the recorded data were processed in the same way for horizontal and vertical components: the waveforms are divided in non-overlapping 20 s windows; for each signal window, the mean and the trend is removed from the time series; tapering and zero padding is carried out on cut waveforms; spectral amplitudes are computed by means of Discrete Fourier Transform; retrieved spectra are smoothed by means of triangular windows having a width equal to 5% of the central frequency.
Then, the N–S and E–W horizontal components of the ground motion are combined in a single horizontal spectrum (H) by computing the Euclidean average. For each of the 20 s window, the horizontal-to-vertical spectral ratio is computed. Finally, the average H/V spectrum of every 20 s windows is obtained, providing also the relative 2σ confidence interval.
Local and regional earthquakes were recorded by two accelerometers (SARA-Electronic Instruments SL06 with 1 g full scale): one (AV1) was installed in a stable site (), close to the Curch of San Michele Arcangelo located to the north of the target area. The second (AV2) was placed at the ground floor of a building, named ‘palazzo Mancusi’, located in Via Roma n° 179, which suffered structural damage due to instability phenomena (). From February 13th to July 31st, 2017, the accelerometric stations recorded 30 (AV1) and 17 (AV2) local and regional earthquakes. Nonetheless, only signals characterized by a good signal-to-noise ratio were used for our analyses. Selected earthquakes (see ) were mainly distributed south of the two stations and their distances range from about 10 km to more than 1000 km. Earthquake data are processed in a very similar way as the one above described for ambient noise measurements. For each component of the accelerometric recordings: time series are filtered in the frequency range 0.1–25 Hz; the mean and the trend are removed from accelerograms; tapering is performed; spectra are computed by means of DFT and smoothed with Konno–Ohmachi function (Konno and Ohmachi Citation1998).
Table 2. List of the local and regional earthquakes recorded by the AV1 and AV2 accelerometers with their principal seismological parameters.
For each earthquake recording, the EW/V and NS/V spectral ratio are computed, along with the ratio of the average horizontal spectrum to vertical one. Finally, the average HVSR, with the uncertainty represented by σ, are retrieved.
Bi-dimensional seismic array
L-shaped arrays of 24 geophones with 4.5 Hz frequency and a variable inter-distance and length in range 50–190 m were used for ESAC (in the array location is shown). Noise acquisition was performed using a Geometrics-Geode instrument (a 24 bit data-logger with 144 dB dynamic range and a sampling rate of 8 ms) at a sampling frequency of 125 Hz and for a duration of 30–40 min. The passive bi-dimensional seismic arrays have been processed using the Extended Spatial Auto-Correlation technique (ESAC; Ohori et al. Citation2002; Okada Citation2003; Parolai and Galiana-Merino Citation2006).
Active seismic methods
Seismic refraction
In this study, data acquisition was carried out with a 24-channel modular seismographs (Geometrix) with a sampling interval of 125 µs–2 ms and a 24-bit signal to noise ratio. Vertical geophones with a frequency of 14 Hz were used as 2 m spaced receivers. For each measurement, five shots were made, one at the centre and two on both sides of the investigated profile. A hitting weight of 10 kg dropped onto a 5 cm thick aluminium plate was used as energy source.
Multichannel analysis of surface waves
The multichannel analysis of surface waves(MASW) technique is a seismic methodology used for the characterization of subsurface units (about 30 m depth) by generating one-dimensional profiles and two-dimensional tomography of the S wave velocity field (Vs) (Park et al. Citation1999). For the acquisition, a Geode seismograph (Geometrics) was used, equipped with 4.5 Hz geophones (Geospace). The Surfseis 1.5 software (Kansas Geological Survey) was used for the analysis and interpretation of the seismic data acquired. For the realization of the 52 m MASW profile, 24 vertical geophones with a 4.5 Hz frequency were linearly arranged with distance of 2 m and with a source-first receiver distance variable from 4 to 6 m. The sensor ground coupling was carried out using appropriate steel pins with a mass capable of ensuring an optimal union between geophones and road pavement. In that way, the noise is minimized.
Results
The SBAS-DInSAR results on the Avigliano municipality
To carry out surface deformation analysis related to the Avigliano town (southern Italy), we applied the multi-scale interferometric DInSAR technique referred to as SBAS approach (Lanari et al. Citation2004; Bonano et al. Citation2013) to a large X-band SAR data archive collected from the Italian COSMO-SkyMed (CSK) constellation over the investigated area. In particular, the exploited X-band dataset comprises a sequence of 53 CSK data frames, acquired over descending orbits during the three-year time interval between March 2012 and September 2015. Starting from the available SAR acquisitions, a set of small baseline interferometric data pairs were identified and selected, by imposing a constraint of 600 m on the maximum spatial baseline values of the CSK dataset. Then, 145 CSK DInSAR interferograms were generated, using precise satellite orbital information and the 1-arcsec Shuttle Radar Topography Mission (SRTM) DEM of the study area to remove the topographic phase component (Gabriel et al. Citation1989).
In order to provide a detailed analysis of the surface displacements occurring at the scale of single buildings and man-made infrastructures on the Avigliano town, we applied the multi-scale SBAS-DInSAR approach on the above mentioned CSK dataset. In we present the geocoded CSK SBAS-DInSAR mean deformation velocity map, superimposed on an optical image of the investigated area and relevant to the coherent pixels, only, achieved by applying the full resolution SBAS-DInSAR approach. It is evident the high level of details achievable via the X-band CSK satellite system, which allows us to detect most of the human-made buildings and structures within the investigated area; indeed, the improved spatial resolution of the X-band SAR sensors allows us to detect a large number of coherent points within the SBAS deformation maps. From a qualitative viewpoint, the full resolution CSK SBAS-DInSAR velocity map reported in does not show any significant deformation pattern, thus revealing a general stable behaviour of the entire urban area. However, some localized displacements of a few mm/year were detected in correspondence to some buildings and isolated edifices located at South-East and South-West of the urban centre of Avigliano, which are identified with the labels A, B and C in , respectively. In , we report the zoomed views of the full resolution deformation velocity map relevant to the above mentioned areas highlighted in , characterized by localized displacements of about 3–4 mm/year, and the corresponding CSK deformation time series for three pixels located within the maximum deformation area and labelled as P1, P2 and P3 in . It is worth noting that the pixel density enhancement guaranteed by the X-band CSK sensors can be also beneficial for investigating displacements associated with portions of the analyzed structures, thus easily detecting possible intra-building differential movements affecting single elements of a complex structure, as for the case of the DInSAR measurements observed in correspondence to the North–South facade of the building reported in , reaching a maximum deformation rate of about 5 mm/year, as clearly visible by the plot of the deformation time series relevant to pixel P2. This is particularly relevant for geotechnical applications and structural engineering analyses. Moreover, the high temporal sampling rate guaranteed by the CSK constellation has a large impact on the capability to follow and monitor small-rate, fast-varying, and nonlinear deformation signals over time. Such a reduced revisit time is particularly effective in presence of deformation analyses related to short time intervals, where a possible limited number of collected SAR acquisitions may compromise the typical performances of the SBAS-DInSAR approach.
Figure 2. Full resolution SBAS-DInSAR results relevant to the Avigliano municipality (southern Italy). LOS deformation velocity map, expressed in [cm/year] and superimposed on an optical image of the investigated area. The results are relevant to the full resolution SBAS-DInSAR processing of the CSK dataset acquired from descending orbits during the March 2012–September 2015 time interval. Labels A, B and C indicate three zones interested by localized displacements (of a few mm/year), whose deformation velocity maps are reported in the zoomed views of Figure 3, together with the plots of the deformation time series for three coherent pixels within the maximum deformation area.
![Figure 2. Full resolution SBAS-DInSAR results relevant to the Avigliano municipality (southern Italy). LOS deformation velocity map, expressed in [cm/year] and superimposed on an optical image of the investigated area. The results are relevant to the full resolution SBAS-DInSAR processing of the CSK dataset acquired from descending orbits during the March 2012–September 2015 time interval. Labels A, B and C indicate three zones interested by localized displacements (of a few mm/year), whose deformation velocity maps are reported in the zoomed views of Figure 3, together with the plots of the deformation time series for three coherent pixels within the maximum deformation area.](/cms/asset/b13f3be5-8df7-4650-8d2a-acc8e66f02e2/tgnh_a_1526220_f0002_c.jpg)
Figure 3. On the left, zoomed views of the LOS mean deformation velocity map relevant to the full resolution SBAS-DInSAR processing of the CSK dataset available for the Avigliano municipality (southern Italy), expressed in [cm/year] and superimposed on optical images of the areas labelled as A, B and C in Figure 2. On the right, the plots are relevant to the full resolution deformation time series of three coherent pixels, labelled as P1, P2 and P3, located within the maximum deformation area of the Avigliano municipality.
![Figure 3. On the left, zoomed views of the LOS mean deformation velocity map relevant to the full resolution SBAS-DInSAR processing of the CSK dataset available for the Avigliano municipality (southern Italy), expressed in [cm/year] and superimposed on optical images of the areas labelled as A, B and C in Figure 2. On the right, the plots are relevant to the full resolution deformation time series of three coherent pixels, labelled as P1, P2 and P3, located within the maximum deformation area of the Avigliano municipality.](/cms/asset/a948e9e6-d1eb-43a7-b191-ff4cad1b140c/tgnh_a_1526220_f0003_c.jpg)
Geophysical characterization of the subsoil: joint analysis of ERT and active/passive seismic measurements
Electric and seismic techniques were applied to achieve a geophysical characterization of the subsoil of the area affected by surface deformation phenomena, located by means of the satellite analysis. During the surveys, it was immediately evident that urban noisy conditions had affected some measurements. The use of non-invasive, low-cost and easy-to-perform techniques has made it possible to overcome the limitation of urban noise, as it was possible to re-perform and/or extend the measuring points. Due to the poor coupling between electrodes and ground and to the presence of underground utilities in the first layers of subsoil, the quality of electrical resistivity data proved to be not satisfactory, requiring a detailed analysis and a strong filtering before the inversion. To integrate electrical data and to improve the quality of the results, several ambient seismic noise measurements, performed along each ERT profile, and seismic refraction and ESAC measurements were carried out.
The ERT1 () shows the presence of a concave shaped material with a relatively higher electrical conductivity (ρ < 25 Ωm) in the shallow subsoil resting on a more resistive material (ρ > 60 Ωm). While the relatively more conductive material exhibiting a thickness of about 15 m can be attributed to debris accumulation material (D) as described in the geological map (), the underlying more resistive material is attributable to fine and silty sands. The inferred setting is confirmed by both the stratigraphy of the D10 survey and by the Vs profile estimated by the inversion of dispersion curve provided by MASW (). In detail, similarly to the electric contrast in the ERT, the Vs profile shows an impedance contrast at about 15 m, i.e. between the debris accumulation material (Vs about 320–380 m/s) and the underlying sandy-silty unit (Vs about 620 m/s).
Figure 4. (a) ERT1 (vertical exaggeration in model section display is 1; first and last electrodes are located at 0 m and 185.5, respectively) with stratigraphic data (D10); (b) mean HVNSR (HV11, HV10 e HV2) and HVSR (AV2); (c) directional HVNSR, (d) the depth Vs profile and (e) the dispersion curve obtained by the MASW survey along Viale della Vittoria in the urban center of Avigliano (PZ, Italy). Black arrows point to the limits of the differential failures.
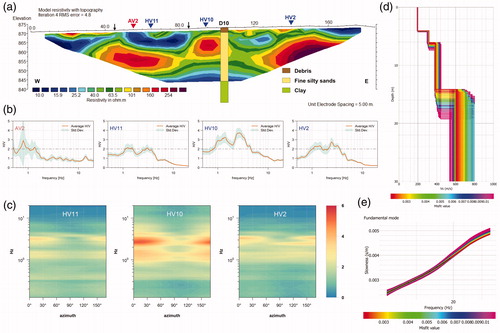
The HVNSRs show two resonance peaks, at about 1.5 Hz and 2.5 Hz. As these resonance frequencies are present in all the estimated HVSR functions, both inside and outside the area affected by failure, it could be said that they are the litho-stratigraphic properties of the investigated site. This suggests that the 2.5 Hz frequency could be due to the contrast between the sands and underlying clays while the 1.5 Hz frequency could be originated by the clays and the bedrock which is characterized by the conglomerate unit.
In addition, the directional analysis of the three HVNSR functions shows that both resonance peaks of the deformation phenomenon have a --directionality of approximately 30° respect to the main axis of the deformation area. The HVSR function estimated in the area of the failure (AV2 in ), from the analysis of earthquake recordings on the ground floor of the building affected by the structural damage, did not show any particular resonance peaks. It is therefore assumed that the presence of substructures and containment works in the area below did not allow a correct estimate of the site seismic response.
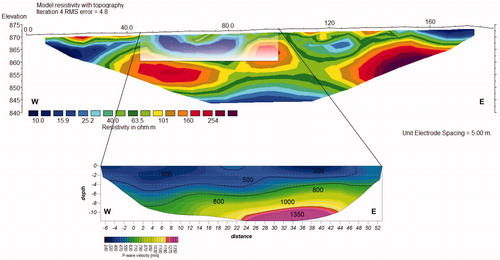
Seismic refraction measurements were also carried out along the same profile as ERT 1, between the progressive 55 and 95 m from the origin of the profile, reaching a depth of investigation of about 15 m. The seismic model shows three seismostrata with increasing P-wave velocities, basically confirming the results obtained by the resistivity model (). The first two seismostrata are indeed comparable with the conductive material characterizing the area affected by the deformation phenomenon while the deepest one, which is characterized by higher velocities, is comparable with the resistive material characterizing the central part of ERT1 ().
Figure 5. Comparison of ERT 1 with the seismic refraction tomography carried out along the same profile in Viale della Vittoria.
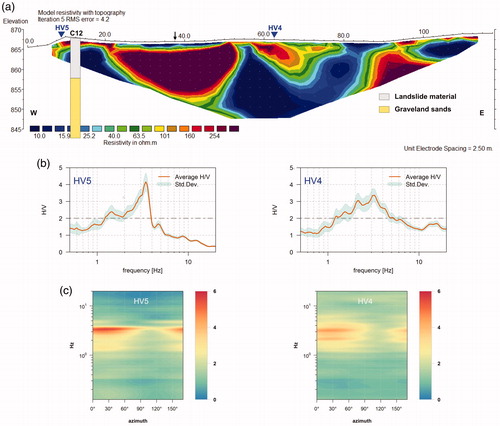
The ERT3 was carried out in an area where works of slope stabilization have been realized (). The resistivity values of ERT 3 are comparable with those measured in ERT 1 with a large resistive core from 20 m up to 55 m from the origin, likely caused by the presence of stabilization earthworks beneath a building, overlying the investigated subsoil, as reported by the technicians of the Avigliano municipality (). The comparison with the stratigraphy of the C12 survey does not help to improve the interpretation of the geoelectrical survey, as it is positioned at the origin of the profile, where the geoelectric information is lacking. The HVNSR investigations show a resonance peak at about 3 Hz with an orientation of about 30° to the main axis of the deformed area. This resonance peak is compatible with the one of 2.5 Hz retrieved by HVNSR analysis along the ERT 1 profile. The difference of frequency is probably due to the thickness reduction of the sand layer, according to the topography. It is worth noting that the presence of geo-engineering artefacts hinder the joint interpretation of geoelectric data and seismic data.
Figure 6. (a) ERT3 (vertical exaggeration in model section display is 1; first and last electrodes are located at 0 m and 117.5, respectively) with stratigraphic data (C12); (b) mean HVNSR (HV5 and HV4); (c) directional HVNSR in Via Leonardo da Vinci in the urban centre of Avigliano (PZ, Italy). Black arrows point to the limits of the differential failures.
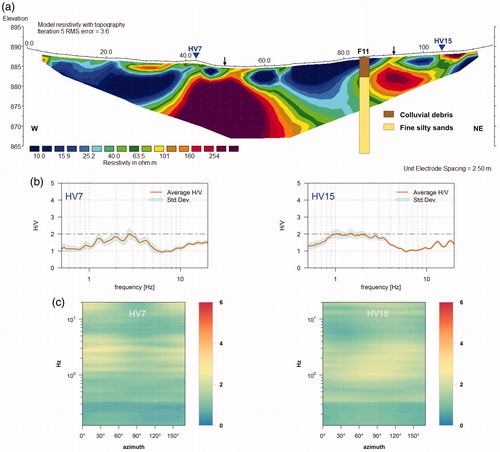
ERT4 is characterized by resistivity values comparable to those measured in other ERT. In particular, there are two large concave areas filled with conductive material ascribable to colluvial debris resting on a more resistive sandy ground, as confirmed by the stratigraphic column of the F11 survey (). The HVNSR do not show significant resonance peaks, because these measurements were carried out in correspondence of the geological limit between the ground debris (south of HV7 and HV15) and the sandy-silty unit (north of HV7 and HV15), as reported in the geological map ().
Figure 7. (a) ERT4 (vertical exaggeration in model section display is 1; first and last electrodes are located at 0 m and 117.5, respectively) with stratigraphic data (F11); (b) mean HVNSR (HV7 and HV15); (c) directional HVNSR carried out in via S. Michele outside the walls in the urban centre of Avigliano (PZ).
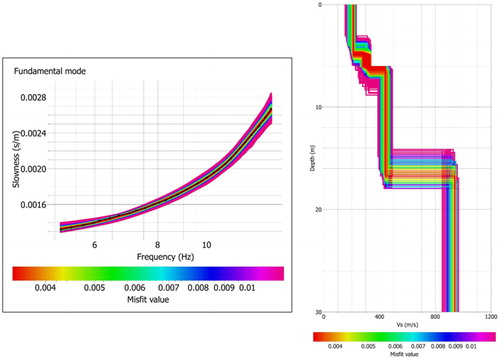
ERT5 shows a somewhat homogeneous distribution of resistivity values without any obvious contrast (). The comparison with the stratigraphy of the C14 survey indicates that the relatively resistive material present in the whole ERT can be ascribed to the silty sand. The HVSR ratios obtained from both ambient seismic noise and the analysis of 20 earthquakes (AV1) show a slight resonance peak at about 3-3.5 Hz, probably due to the contrast between the sand and the underlying clays. Finally, shows the dispersion curve and the Vs profile obtained by the ESAC survey. Two clear seismic impedance contrasts are evident, one in the first meters and the other one at about 15–20 m. It is not possible to compare these results with ERT5 because the depth of investigation is different.
Figure 8. (a) ERT5 (vertical exaggeration in model section display is 1; first and last electrodes are located at 0 m and 100, respectively) with stratigraphic data (C11); (b) mean HVNSR (HV8) and directional HVNSR carried out close to the Church of the Angel in the urban centre of Avigliano (PZ); (c) mean HVSR (AV 1).
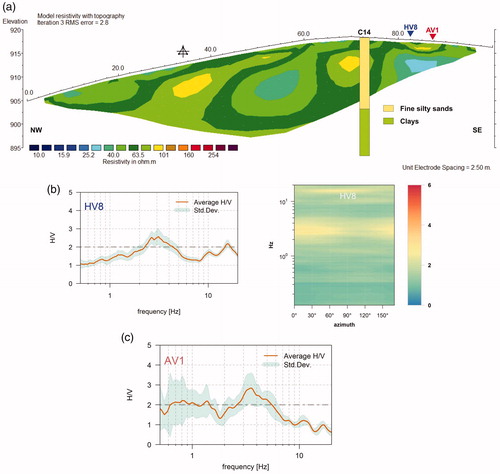
Figure 9. (Left panel) dispersion curve and (right panel) Vs waveforms obtained by the ESAC survey.
Discussions
Different geophysical techniques, from satellite to ground-based, have been jointly applied to the diagnostics and monitoring of superficial deformation phenomena affecting different portions of the Avigliano urban area in Basilicata Region (southern Italy). In the top-down approach here adopted, the superficial deformations were firstly delineated by means of satellite SAR data, analyzed by using SBAS DInSAR algorithm. The LOS mean deformation velocity map obtained by processing satellite CSK dataset, acquired between March 2012 and September 2015, highlighted three deformed areas. The ones reported as B and C in interest suburban portions of the Avigliano town and are associated with well-known hydrogeological phenomena. The deformation of area A () affects the urban area of the town where moderate to heavy damages of buildings () have been observed. Such deformation seemed to be constant during the observation period with an average displacement of about 3–4 mm/year.
Geoelectrical (ERT) and seismic (active and passive) methods were applied in the deformed area A with the aim to reconstruct the litho-stratigraphic setting and to verify the geophysical characteristics of the subsoil. ERTs were carried out transversally to the deformed area. Preliminary analysis of the ERT immediately highlighted the poor quality of the data due to the noise conditions typical of the measurements carried out in urban areas. Indeed, the contact resistance values were very high due to the difficult coupling between the electrodes and the ground, although it was improved by filling each hole with bentonite and salty water. Furthermore, the presence of underground services and man-made structures influenced the path of electric signal, distorting the electrical field and providing some artefacts on resistivity distribution. For this reason, resistivity data were analyzed in detail and heavily filtered before applying the inversion process. In order to carry out a more realistic interpretation of the ERT and to proceed to a geophysical modelling of the subsoil, along each ERT profile several ambient seismic noise measurements were carried out. Moreover, passive (ESAC) and active seismic (MASW and refractive seismic) measurements were realized along some specific profiles very close to the structures most damaged by the deformation phenomenon. These structures were also equipped with two accelerometers to assess their dynamic behaviour.
The joint analysis allowed us to obtain more realistic results and to overcome the intrinsic drawbacks of each technique. As example, seismic measurements, both active (MASW and seismic refraction) and passive (ambient seismic noise), and ERT1 were carried out along the same profile located very close to the most damaged building (). MASW provided a detailed Vs profile (), useful to estimate the depth of the geophysical contrasts highlighted by the other techniques. The inversion of the active seismic refraction measurements generated a detailed subsurface 2 D Vp (P-wave velocity) tomography that was compared with ERT1 (). This comparison allowed a better interpretation of the subsoil geometry because of the use of two different observables (resistivity and P-wave seismic velocity) and gave the opportunity to overcome misinterpretation of ERT results generally affected by anthropic perturbations. Moreover, ERT1 extended on a longer profile the information obtained by the active seismic measurements.
In order to obtain information on the deeper seismic discontinuities, passive seismic ESAC method was applied. ESAC is based on the processing of ambient noise records (including traffic noise from surrounding roads, factory noise, etc.) and proved to be very suitable in urban areas investigation, allowing the reconstruction of the Vs profile () at an investigation depth higher than 30 m with a good resolution. As ESAC, HVNSR analysis is also based on the ambient noise recordings so it is suitable in urban areas investigation too. Thanks to the Vs velocity profiles provided by MASW and ESAC, the two resonance peaks observed on HVNSR functions, retrieved both inside and outside the deformed area, were used to estimate the depth of two deeper seismic contrasts, not observed in Vp seismic and ERT tomographies.
The results of the in situ geophysical techniques were interpreted integrating stratigraphic data and considering the location of underground services. The integration of all the results allowed the detailed geometrical reconstruction of the deformed area, helping to locate at a depth of about 15 m a geophysical discontinuity that can be associated with the limit of the material affected by the deformation process. This material is characterized by resistivity values <25 Ωm and S-waves velocities of about 320–380 m/s. The estimated HVNSR functions showed two resonance peaks at about 1.5 Hz and 2.5 Hz, both inside and outside the investigated area, associated with deeper discontinuities not investigated by ERT and seismic profiles.
Conclusions
The proposed approach, based on the integration of satellite and in situ geophysical techniques, proved to be very suitable in the investigated urban area to locate sites affected by ground deformation and to reconstruct in detail their litho-stratigraphic and geometrical structure. Furthermore, the non-invasiveness of the investigations, their low cost and the rapidity of the measures represented an additional advantage of the proposed approach. Anyway, it did not provide information on the process causing the ground deformation. Indeed, it was not possible to verify if the deformation is due to the compaction of filling material, as hypothesized by the technicians of the municipality, or to a hydrogeological phenomenon. To better understand the process causing ground deformation, additional information, such as piezometric and inclinometric measurements, rain-gauge data, etc., needs to be acquired.
The obtained results were transferred to the public administration technicians involved in the managing of risk. Such information could be useful to develop a reliable geological model of the area for planning future intervention actions.
Disclosure statement
No potential conflict of interest was reported by the authors.
Related Research Data
References
- Admiraal H, Cornaro A. 2016. Why underground space should be included in urban planning policy and how this will enhance an urban underground future. Tunn Undergr Sp Technol. 55:214–220.
- Arangio S, Calò F, Di Mauro M, Bonano M, Marsell M, Manunta M. 2014. An application of the SBAS-DInSAR technique for the assessment of structural damage in the city of Rome. Struc Infrastr Eng. 10(11):1469–1483.
- Bard PY. 1999. Microtremor measurements: a tool for site effect estimation? In: K. Irikura, K. Kudo, H. Okada, T. Sasatani, editors. The effects of surface geology on seismic motion. Rotterdam, The Netherlands: Balkema; p. 1251–1279.
- Berardino P, Fornaro G, Lanari R, Sansosti E. 2002. A new algorithm for surface deformation monitoring based on small baseline differential SAR interferograms. IEEE Trans Geosci Remote Sensing. 40(11):2375–2383.
- Bobylev N. 2016. Underground space as an urban indicator: measuring use of subsurface. Tunn Undergr Sp Technol. 55:40–51.
- Bobylev N, Sterling R. 2016. Urban underground space: a growing imperative. perspectives and current research in planning and design for underground space use. Tunn Undergr Sp Technol. 55:1–4.
- Bonano M, Manunta M, Marsella M, Lanari R. 2012. Long-term ERS/ENVISAT deformation time-series generation at full spatial resolution via the extended SBAS technique. Int J Remote Sens. 33(15):4756–4783.
- Bonano M, Manunta M, Pepe A, Paglia L, Lanari R. 2013. From previous C-Band to New X-Band SAR systems: assessment of the DInSAR mapping improvement for deformation time-series retrieval in urban areas. IEEE Trans Geosci Remote Sens. 51(4):1973–1984.
- Boncio P, Pizzi A, Cavuoto G, Mancini M, Piacentini T, Miccadei E, Cavinato GP, Piscitelli S, Giocoli A, Ferretti G, et al. 2011. Geological and geophysical characterisation of the Paganica – San Gregorio area after the April 6, 2009 L'Aquila earthquake (Mw6.3, central Italy): implications for site response. Boll Geofis Teor Appl. 52(3):491–512.
- Calò F, Ardizzone F, Castaldo R, Lollino P, Tizzani P, Guzzetti F, Lanari R, Angeli M, Pontoni F, Manunta M. 2014. Enhanced landslide investigations through advanced DInSAR techniques: the Ivancich case study, Assisi, Italy. Remote Sens Environ. 142:69–82.
- Caputo R, Piscitelli S, Oliveto A, Rizzo E, Lapenna V. 2003. The use of electrical resistivity tomographies in active tectonics: examples from the Tyrnavos Basin, Greece. J Geodyn. 36(1–2):19–35.
- Castro RR, Mucciarelli M, Pacor F, Federici P, Zaninetti A. 1998. Determination of the characteristic frequency of two dams located in the region of Calabria, Italy. Bull Seismol Soc Am. 88(2):503–511.
- Casu F, Manzo M, Lanari R. 2006. A quantitative assessment of the SBAS algorithm performance for surface deformation retrieval from DInSAR data. Remote Sens Environ. 102(3–4):195–210.
- Chávez-Garcı́a FJ, Cárdenas M. 2002. The contribution of the built environment to the ‘free-field’ ground motion in Mexico City. Soil Dynam Earthquake Eng. 22(9–12):773–780.
- Cruden DM, Varnes DJ. 1996. Landslides types and processes. In: Landslides: investigate and mitigation. Edited by Transportation Research Board; First edition (June 1, 1996). Transport research board, USA: National Academy Press; p. 36–71.
- Deceuster J, Kaufmann O, Van Camp M. 2013. Automated identification of changes in electrode contact properties for long-term permanent ERT monitoring experiments. Geophysics. 78(2):E79–E94.
- Di Giulio G, Azzara RM, Cultrera G, Giammarinaro MS, Vallone P, Rovelli A. 2005. Effect of local geology on ground motion in the city of Palermo, Italy, as inferred from aftershocks of the 6 September 2002 MW 5.9 earthquake. Bull Seismol Soc Am. 95(6):2328–2341.
- Doyle MR. 2016. From hydro/geology to the streetscape: evaluating urban underground resource potential. Tunn Undergr Sp Technol. 55:83–95.
- Gabriel AK, Goldstein RM, Zebker HA. 1989. Mapping small elevation changes over large areas: differential interferometry. J Geophys Res. 94(B7):9183–9191.
- Galli P, Giaccio B, Messina P, Peronace E, Amato V, Naso G, Nomade S, Pereira A, Piscitelli S, Bellanova J, et al. 2017. Middle to Late Pleistocene activity of the northern Matese fault system (southern Apennines, Italy). Tectonophysics. 699:61–81. doi:10.1016/j.tecto.2017.01.007.
- Gallipoli MR, Mucciarelli M, Castro RR, Monachesi G, Contri P. 2004. Structure, soil–structure response and effects of damage based on observations of horizontal-to-vertical spectral ratio of microtremors. Soil Dynam Earthquake Eng. 24(6):487–495.
- Gallipoli MR, Mucciarelli M, Vona M. 2009. Empirical estimate of fundamental frequencies and damping for Italian buildings. Earthquake Eng Struct Dynam. 38(8):973–988.
- Gallipoli MR, Albarello D, Mucciarelli M, Bianca M. 2011. Ambient noise measurements to support emergency seismic microzonation: the Abruzzo 2009 earthquake experience. Boll Geofis Teor Appl. 52(3):539–559.
- Gallipoli MR, Chiauzzi L, Stabile TA, Mucciarelli M, Masi A, Lizza C, Vignola L. 2014. The role of site effects in the comparison between code provisions and the near field strong motion of the Emilia 2012 earthquakes. Bull Earthquake Eng. 12(5):2211–2230.
- Giocoli A, Magrì C, Vannoli P, Piscitelli S, Rizzo E, Siniscalchi A, Burrato P, Basso C, Di Nocera S. 2007. Electrical resistivity tomography investigations in the Ufita Valley (Southern Italy). Ann Geophys-Italy. 51:213–223.
- Giocoli A, Quadrio B, Bellanova J, Lapenna V, Piscitelli S. 2014. Electrical resistivity tomography for studying liquefaction induced by the May 2012 Emilia-Romagna earthquake (Mw =6.1, northern Italy). Nat Hazards Earth Syst Sci. 14(4):731–737.
- Giocoli A, Stabile TA, Adurno I, Perrone A, Gallipoli MR, Gueguen E, Norelli E, Piscitelli S. 2015. Geological and geophysical characterization of the southeastern side of the High Agri Valley (southern Apennines, Italy). Nat Hazards Earth Syst Sci. 15(2):315–323.
- Jongmans D, Garambois S. 2007. Geophysical investigation of landslides: a review. Bull Soc Geol Fr. 178(2):101–112.
- Konno K, Ohmachi T. 1998. Ground-motion characteristic estimated from spectral ratio between horizontal and vertical components of micro-tremor. Bull Seismol Soc Am. 88:228–241.
- Konstantaki LA, Ghose R, Draganov D, Diaferia G, Heimovaara T. 2015. Characterization of a heterogeneous landfill using seismic and electrical resistivity data. Geophysics. 80(1):EN13–EN25. doi:10.1190/GEO2014-0263.1
- Kovačević MS, Marčić D, Gazdek M. 2013. Application of geophysical investigations in underground engineering. Technical Gazette. 20(6):1111–1117.
- Kuras O, Wilkinson PB, Meldrum PI, Oxby LS, Uhlemann S, Chambers JE, Binley A, Graham J, Smith NT, Atherton N. 2016. Geoelectrical monitoring of simulated subsurface leakage to support high-hazard nuclear decommissioning at the Sellafield Site, UK. Sci Total Environ. 566–567:350–359. doi:10.1016/j.scitotenv.2016.04.212.
- Lanari R, Mora O, Manunta M, Mallorquí JJ, Berardino P, Sansosti E. 2004. A small baseline approach for investigating deformations on full resolution differential SAR interferograms. IEEE Trans Geosci Remote Sens. 42(7):1377–1386.
- Lapenna V. 2017. Resilient and sustainable cities of tomorrow: the role of applied geophysics. Boll Geof Teor App. 58(4):237–251.
- Leucci G, De Giorgi L, Gizzi FT, Persico R. 2017. Integrated geo-scientific surveys in the historical centre of Mesagne (Brindisi, Southern Italy). Nat Hazards. 86(S2):363–383.
- Loke MH. 2013. Tutorial: 2-D and 3-D electrical imaging surveys. http://www.geotomosoft.com (accessed 6 Jan 2017)
- Manconi A, Casu F, Ardizzone F, Bonano M, Cardinali M, De Luca C, Gueguen E, Marchesini I, Parise M, Vennari C, et al. 2014. Brief communication: Rapid mapping of event landslides: the 3 December 2013 Montescaglioso landslide, Italy. Nat Hazards Earth Syst Sci. 14(7):1835–1841. doi:10.5194/nhess-14-1835-2014.
- Manunta M, Marsella M, Zeni G, Sciotti M, Atzori S, Lanari R. 2008. Two-scale surface deformation analysis using the SBAS-DInSAR technique: a case study of the city of Rome, Italy. Int J Remote Sens. 29(6):1665–1684.
- Mehta S, Bastani M, Malehmir A, Pedersen LB. 2017. Resolution and sensitivity of boat-towed RMT data to delineate fracture zones – example of the Stockholm bypass multi-lane tunnel. J Appl Geophys. 139:131–143.
- Mielby S, Eriksson I, Campbell D, de Beer J, Bonsor H, Le Guern C, Van der Krogt R, Lawrence D, Ryzynski G. 2016. Opening the subsurface for the cities of tomorrow. TU1206 COST Sub-Urban WG2.0-001 Report. http://sub-urban.squarespace.com/new-index/#publications, (accessed 27 Sep 2018)
- Miller R. 2013. Introduction to this special section: urban geophysics. Leading Edge. 32(3):248–249.
- Mucciarelli M. 1998. Reliability and applicability of Nakamura's technique using microtremors: an experimental approach. J Earthq Eng. 2(4):625–638.
- Mucciarelli M, Masi A, Vona M, Gallipoli MR, Harabaglia P, Caputo R, Piscitelli S, Rizzo E, Picozzi M, Albarello D, Lizza C. 2003. Quick survey of the possible causes of damage enhancement observed in San Giuliano after the 2002 Molise, Italy seismic sequence. J Earth Eng. 7(4):599–614.
- Mucciarelli M, Bianca M, Ditommaso R, Vona M, Gallipoli MR, Giocoli A, Piscitelli S, Rizzo E, Picozzi M. 2011. Peculiar earthquake damage on a reinforced concrete building in San Gregorio (L’Aquila, Italy): site effects or building defects? Bull Earthquake Eng. 9(3):825–840.
- Ohori M, Nobata A, Wakamatsu K. 2002. A comparison of ESAC and Fk methods of estimating phase velocity using arbitrarily shaped microtremor arrays. Bull Seismol Soc Am. 92(6):2323–2332.
- Okada H. 2003. The microtremor survey method. Geophysical Monograph Series SEG. Soc Explor Geophys Tulsa, Oklahoma.
- Park CB, Miller RD, Xia J. 1999. Multichannel analysis of surface waves. Geophysics. 64(3):800–808.
- Parolai S, Galiana-Merino JJ. 2006. Effect of transient seismic noise on estimates of H/V spectral ratios. Bull Seismol Soc Am. 96(1):228–236.
- Pepe A, Sansosti E, Berardino P, Lanari R. 2005. On the generation of ERS/ENVISAT DInSAR time-series via the SBAS technique. IEEE Geosci Remote Sens. Lett. 2(3):265–269.
- Perrone A, Lapenna V, Piscitelli S. 2014. Electrical resistivity tomography technique for landslide investigation: a review. Earth-Sci. Rev. 135:65–82.
- Perrone A, Zeni G, Piscitelli S, Pepe A, Loperte A, Lapenna V, Lanari R. 2006. Joint analysis of SAR interferometry and electrical resistivity tomography surveys for investigating ground deformation: the case-study of Satriano di Lucania (Potenza, Italy). Eng Geol. 88(3–4):260–273.
- Piscitelli S, Rizzo E, Cristallo F, Lapenna V, Crocco L, Persico R, Soldovieri F. 2007. GPR and microwave tomography for detecting shallow cavities in the historical area of ‘‘Sassi of Matera’’ (southern Italy). NSG. 5(6):275–284.
- Polemio M, Sdao F. 1999. The role of rainfall in the landslide hazard: the case of the Avigliano urban area (Southern Apennines, Italy). Eng Geol. 53(3–4):297–309.
- Rucker DF, Myers DA, Cubbage B, Levitt MT, Noonan GE, McNeill M, Henderson C, Lober RW. 2013. Surface geophysical exploration: developing noninvasive tools to monitor past leaks around Hanford’s tank farms. Environ Monit Assess. 185(1):995–1010.
- Sansosti E, Berardino P, Bonano M, Calò F, Castaldo R, Casu F, Manunta M, Manzo M, Pepe A, Pepe S, et al. 2014. How second generation SAR systems are impacting the analysis of ground deformation. Int J Appl Earth Obs Geoinf. 28:1–11.
- Scifoni S, Bonano M, Marsella M, Sonnessa A, Tagliafierro V, Manunta M, Lanari R, Ojha C, Sciotti M. 2016. On the joint exploitation of long-term DInSAR time series and geological information for the investigation of ground settlements in the town of Roma (Italy). Remote Sens Env. 182:113–127. doi:10.1016/j.rse.2016.04.017.
- Sdao F, Pascale S, Rutigliano P. 2005. Geomorphological features and monitoring of a large and complex landslide near Avigliano urban area (South Italy). Adv Geosci. 2:97–101.
- Showstack R. 2014. Scientists call for a renewed emphasis on urban geology. Eos Trans Agu. 95(47):431–432.
- Solari L, Ciampalini A, Raspini F, Bianchini S, Zinno I, Bonano M, Manunta M, Moretti S, Casagli N. 2017. Combined use of C- and X-Band SAR data for subsidence monitoring in urban area. Geoscience 7(2):21.
- Soupios PM, Georgakopoulos P, Papadopoulos N, Saltas V, Andreadakis A, Vallianatos F, Sarris A, Makris JP. 2007. Use of engineering geophysics to investigate a site for a building foundation. J Geophys Eng. 4(1):94–103.
- Van der Meulen MJ, Campbell SDG, Lawrence DJ, Lois González RC, Van Campenhout IAM. 2016. Out of sight out odf mind? Considering the subsurface in urban planning - State of the art. COST TU1206 Sub-Urban Report, TU1206-WG1-001. http://www.sub-urban.ue.
- Vereecken H, Kemna A, Münch HM, Tillmann A, Verweerd A. 2006. Aquifer characterization by geophysical methods. In: MG Anderson, JJ McDonnell, editors. Encyclopedia of hydrological sciences. USA: John Wiley & Sons, Ltd.
- Vignola L, Gallipoli MR, Chiauzzi L, Stabile TA, Piscitelli S, Santarsiero G, Bellanova J, Calamita G, Perrone A. 2018. Geophysical and engineering analysis of different earthquake damage in Pescara del Tronto and Vezzano (Arquata del Tronto Municipality) following the 24th August 2016 central Italy earthquake. Bull Earth Eng. 1–23.
- Wilkinson P, Chambers J, Uhlemann S, Meldrum P, Smith A, Dixon N, Loke MH. 2016. Reconstruction of landslide movements by inversion of 4‐D electrical resistivity tomography monitoring data. Geophys Res Lett. 43(3):1166–1174.
- Wycisk P, Hubert T, Gossel W, Neumann C. 2009. High-resolution 3D spatial modelling of complex geological structures for an environmental risk assessment of abundant mining and industrial megasites. Comput Geosci. 35(1):165–182.
- Zebker HA, Villasenor J. 1992. Decorrelation in interferometric radar echoes. IEEE Trans Geosci Remote Sens. 30(5):950–959.