
 ?Mathematical formulae have been encoded as MathML and are displayed in this HTML version using MathJax in order to improve their display. Uncheck the box to turn MathJax off. This feature requires Javascript. Click on a formula to zoom.
abstarct
The Datong basin is one of the complex geologic environments in China. Several faults are distributed in the basin, and a number of hidden faults have been discovered within the basin. Ground fissures (GFs) and land subsidence occur in this region. In the past, ground subsidence at Datong basin has been studied using groundwater level records, intermittent small-scale levelling measurements and field investigations. However, due to the low spatial resolution and temporal sampling of these records, detailed ground deformation within the basin remains poorly understood. In this study, we exploited Envisat ASAR and ALOS PALSAR images to map the ground deformation between 2007 and 2010. Most of the deformation within the basin occurred at rates of <20 mm/year. In addition to the subsidence due to coal mining in the western mountainous areas, at least four large subsidence zones could be detected. Our analysis indicates that the ground subsidence is affected by groundwater extraction and the distribution of faults. Additionally, the vertical deformation is much larger than the deformation in the east–west direction. Obvious deformation gradients occurred on individual GFs and the activity of the GFs varied spatially. Finally, Interferometric synthetic aperture radar (InSAR) observations related to groundwater exploitation and GFs were modelled and discussed.
Abbreviations: GFs: ground fissures; SAR: Synthetic Aperture Radar; ASAR: Advanced Synthetic Aperture Radar; ALOS: Advanced Land Observing Satellite; PALSAR: Phased Array type L-band Synthetic Aperture Radar; InSAR: Interferometric Synthetic Aperture Radar; ESA: European Space Agency; JAXA: Japan Aerospace Exploration Agency; SBAS: Small Baseline Subsets; SRTM: Shuttle Radar Topography Mission; DEM: Digital Elevation Model; DORIS: Dopper Orbitography and Radiopositioning Integrated by Satellite instrument; MCF: minimum cost flow; LOS: line-of-sight2D/3D: two-dimensional/three-dimensional
1. Introduction
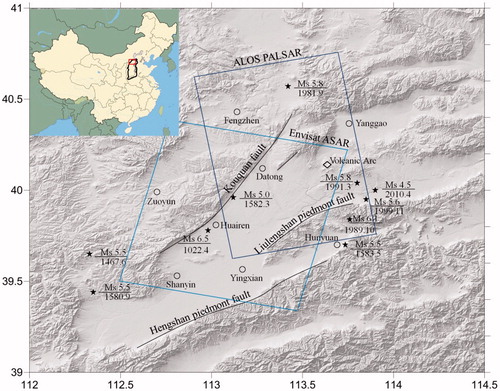
Datong basin, which contains the largest deposit of coal in China, is located in the northern part of Shanxi Province (). The urban area of Datong is surrounded on three sides by mountains, has passed only to the east and southwest, and has elevations that generally increase from southeast to northwest. The well-known Datong Volcanic Arc lies in the east of the Datong basin, and the Kouquan fault and Liulengshan piedmont fault are located in the western and eastern parts of Datong, respectively (). Several moderately strong earthquakes have occurred in the Datong area in its history (Wang et al. Citation2001; Xie et al. Citation2003). Since the Datong–Yanggao Earthquake (Ms 6.1) on 18 October 1989, a number of low-magnitude earthquakes have occurred in this region, indicating potentially damaging active seismicity in the area (). In addition, ground fissures (GFs) and ground subsidence occur in this region. Since the 1980s, the groundwater has been greatly over-exploited due to the need for industrial development and domestic water, which has led to the occurrence of ground subsidence and GFs (Liu et al. Citation1999; Zan Citation2006). At present, there are more than 10 GFs in Datong with a total length of more than 34.5 km (Li and Yuan Citation2002; Ren et al. Citation2004).
Figure 1. Shaded relief map of the Datong basin. Counties are depicted with small circles. The black stars indicate earthquake locations. The diamond indicates the location of the volcanic arc. Near the black stars, the digits above the short line indicate the earthquake magnitude, and the digits below the short line indicate the time of earthquake occurrence. The solid polylines indicate the main faults in the region. The inset at the top-left is the base map of Datong, Shanxi Province, China. The light-blue solid line box shows the coverage of the descending Envisat ASAR images, and the black solid line box shows the coverage of the ascending ALOS PALSAR images.
As Datong is an important city in northwest China and many geological phenomena occur here, a number of studies on ground subsidence and GF activities have been conducted based on underground water level records, levelling measurement, and field investigation (Liu et al. Citation1999; Zan Citation2006). However, because of the low spatial resolution of the underground water level records and levelling measurement, detailed ground deformation remains poorly understood. The Interferometric synthetic aperture radar (InSAR) technique, which has been proven to be a useful tool for measuring many geophysical phenomena (Massonnet et al. Citation1993; Zebker et al. Citation1994; Lu et al. Citation2003; Zhao et al. Citation2012; Ji et al. Citation2015; Yang et al. Citation2016), have been used to study the ground deformation of Datong basin with Envisat ASAR images in 2014 (Yang et al. Citation2014). However, what is the horizontal displacement field in the basin? What is the relationship between the GFs and hidden faults in the region? These problems are still not well understood.
The aim of this study was to contribute to a better understanding of the ground deformation and GF activities in the Datong basin. In this work, we applied the time-series InSAR technique to Envisat ASAR images (C-band) from the descending path and ALOS-1 PALSAR images (L-band) from the ascending path to map the ground deformation in Datong between 2007 and 2010. Ground deformation characteristics in two dimensions were obtained, and cross-correlations among the regional ground subsidence, fault activity, GFs, and underground water level were evaluated.
This article is organized as follows. First, the data collection and processing are described in Section 2. Then, the InSAR results from C- and L-band are reported and a discussion is presented in Sections 3 and 4, respectively. Finally, modelling results are discussed in Section 5, and a conclusion is provided in Section 6.
2. SAR data and InSAR processing
2.1. SAR data
The SAR images covering the Datong area were acquired on the descending Envisat ASAR from the European Space Agency (ESA, Paris, France) and the ascending ALOS-1 PALSAR from the Japan Aerospace Exploration Agency (JAXA, Tokyo, Japan). A total of 25 Envisat ASAR images (period of May 2007 to September 2010) and 13 ALOS-1 PALSAR images (period of June 2007 to May 2010) were collected. The coverage of the SAR images is shown in . The radar line-of-sight look angles at scene centre were 22.8 and 38.7 degrees off nadir for ASAR and PALSAR, respectively, which means that there was a different sensitivity towards the vertical deformation. The azimuth angles were 167.9 and 10.0 degrees counter clockwise from north for ASAR and PALSAR, respectively. All of the information pertaining to the SAR images is listed in .
Table 1. Information of SAR data used in this study.
2.2. InSAR processing
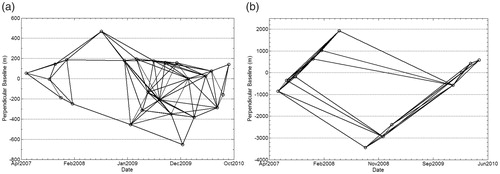
The interferometric processing was performed with GAMMA software (ERS-ENVISAT Symposium, Gothenburg, Sweden) (Werner et al. Citation2000). The small baseline subsets (SBAS) differential-InSAR approach was utilized to determine the time series deformation (Berardino et al. Citation2002; Lanari et al. Citation2004). A Shuttle Radar Topography Mission (SRTM) C-band digital elevation model (DEM) with a resolution of 1 arc-second (30 m) was used as an external DEM to remove the topographic phase from the differential interferograms. ESA DORIS precision orbits data for the Envisat satellite were employed to remove the reference phase from the differential interferograms. To eliminate the impact of temporal and spatial decorrelation (Rosen et al. Citation2000; Lu and Dzurisin Citation2014), we set spatial baselines of <650 and <2500 m and temporal baselines of <400 and <700 d for the C and L bands, respectively. Finally, 81 interferograms from C-band and 35 interferograms from L-band were generated (). The co-registration procedure was conducted with the aid of a DEM, which improved the coherence for the image pairs with a larger spatial baseline (Lu and Dzurisin Citation2010). To improve the signal-to-noise ratio, interferograms were multi-looked by 2 looks in range and 10 looks in azimuth for Envisat ASAR (40 × 40 m) and 4 looks in range and 10 looks in azimuth for ALOS-1 PALSAR (30 × 30 m). The adaptive filter based on the local fringe spectrum was used twice for each differential interferogram (Goldstein and Werner Citation1998) with window dimensions of 128 × 128 and 32 × 32 pixels. The minimum cost flow (MCF) method was carried out to retrieve the unwrapped phase. Low-pass filtering, followed by temporal high-pass filtering, was implemented in the spatial domain to identify undesired atmospheric artefacts (Berardino et al. Citation2002; Lu and Dzurisin Citation2014). This operation also allowed us to detect possible orbital ramps. The atmospheric artefacts and the orbital ramps were removed following their identification. Most other processing steps followed the conventional SBAS InSAR approach.
Figure 2. Baselines of interferograms from Envisat ASAR (left) and ALOS PALSAR (right). The Y-axis shows the perpendicular baseline in meters, and the X-axis shows the image acquisition dates. All of the connecting lines represent interferometric pairs used for time-series analysis.
3. Results and analysis
3.1. Results from Envisat ASAR and ALOS PALSAR
According to the aforementioned processing procedure, time-series ground deformation maps in line-of-sight (LOS) over the Datong basin were obtained during the period of 2007–2010. shows the annual deformation rate calculated from the Envisat ASAR data () and from the ALOS-1 PALSAR data (). The positive and negative signs represent displacement towards and away from the satellite in LOS, respectively. The reference region of the deformation is the ancient town of Datong, which was considered to be stable based on a previous study (Chang’an University Citation2014). We averaged the deformation values on the coherent points within a 2 × 2 km region (black box in ) to obtain the reference value. Then, the reference value was subtracted from the InSAR results.
Figure 3. InSAR results of annual average deformation rates in LOS from C- and L-band. (a) InSAR results from C-band Envisat ASAR images, (b) InSAR results from L-band ALOS-1 PALSAR images. The black box indicates the reference area of ground deformation. The solid triangles represent the positions where the time series results were extracted in .
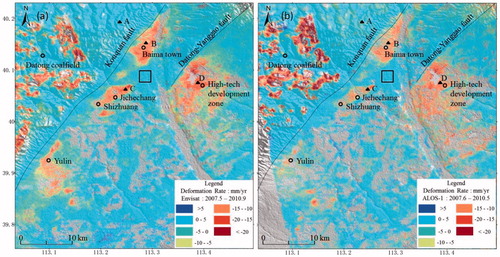
Based on the LOS deformation results from the descending Envisat () and the results from the ascending ALOS (), the deformation characteristics are consistent between the two measurements. The deformation rate within the basin was generally small, and deformation occurred mainly in the internal region of the basin, except for the western mountain coalfield area. Most of the deformation occurred at rates of less than 20 mm/year, and the deformation was bounded by faults. At least four large subsidence zones could be detected, including Baima town, Shizhuang–Jichechang, the high-tech development zone, and Yulin County. Several local settlement locations in the lower-left corner of correspond to coal production plants.
3.2. InSAR accuracy assessment
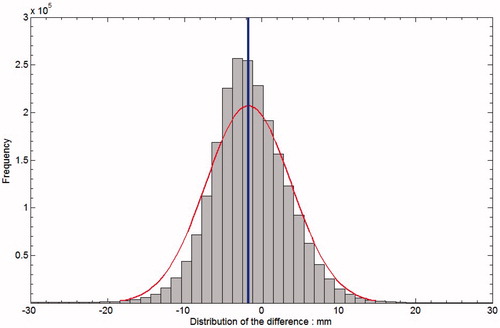
The previous levelling measurement was conducted prior to the start of SAR acquisitions used in this study, and no measurement data covering our research timeframe was collected. As a result, an internal validation strategy was adopted to verify the accuracy of our InSAR results (Qu et al. Citation2014). After the LOS measurements were converted to vertical displacements with their corresponding incidence angles, the common part of the displacement maps between C- and L-band was selected for internal precision evaluation. Vertical deformation from the C band was subtracted from the L band measurement. shows a histogram of the differences. The distribution of the differences is basically a normal distribution. The standard deviation is about 5.5 mm, and the mean of the differences is −1.6 mm; large differences occurred mainly in the coal mine area in the western mountainous region and in the farmland within the basin. Basically, the L-band and C-band InSAR results are consistent.
Figure 4. Distribution of the difference between the C-band and L-band InSAR results.
3.3. Time series of deformation
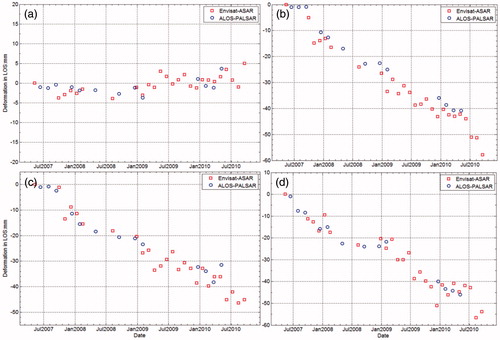
Time series of the deformation was produced from the C- and L-band interferograms based on the SBAS InSAR approach. To analyse the deformation characteristics of the time series, four points, mountain (A), town of Baima (B), Jichechang (C), and high-tech development zone (D), were extracted (shown as triangles in ). We produced the final deformation result for each of the selected regions by averaging the deformation values of all coherence points within a box of 200 × 200 m. The results are shown in . It is worth noting that the two measurements were projected into the vertical direction before the comparison. We used the nearest two Envisat results in time to interpolate the Envisat deformation values corresponding to the ALOS acquisition dates. After that, we calculated the differences between the interpolated Envisat deformation estimates and the corresponding deformation values from ALOS-1 PALSAR. The standard deviations of the differences at A, B, C, and D are 1.1, 1.8, 2.9, and 3.4 mm, respectively. They have good consistency. The difference between the two results may be due to the difference in the number of coherence points within the selected region from Envisat and ALOS datasets. The interpolation of Envisat measurements to match the ALOS-1 acquisition dates might also contribute the difference. Based on , the cumulative subsidence values around the town of Baima, Jichechang, and the high-tech development zone within nearly three- and one-half years were 60, 45, and 55 mm, respectively. The point in the mountains was basically stable. It is worth noting that the presence of horizontal displacement also has an impact on the accuracy of the converted vertical displacement.
Figure 5. InSAR time series results for selected points (a, mountain; b, town of Baima; c, Jichechang; d, high-tech development zone).
3.4. Estimation of horizontal and vertical displacements
Due to the different perspectives on ground movement, SAR images from descending and ascending tracks can be used to recover 2D and/or 3D surface displacement fields (Wright et al. Citation2004; Bechor and Zebker Citation2006; Samsonov and Tiampo Citation2006; Jung et al. Citation2011). Because the deformation in LOS was not sensitive to displacements in the north–south direction, with the near-polar orbits of the SAR satellites, 2D deformation velocity fields in the east–west and vertical directions could be investigated with the Envisat ASAR (descending) and ALOS-1 PALSAR (ascending) data. In fact, this is reasonable for the Datong basin. Previous studies have shown that the displacement in the north-south direction is very small (Qu et al. Citation2013; Chang’an University Citation2014). The measurements equation can be written as
(1)
(1)
where is the 2D deformation vector in the east and up directions;
is the InSAR displacements in LOS form Envisat ASAR and ALOS-1 PALSAR,
and
are the radar incidence angles, and
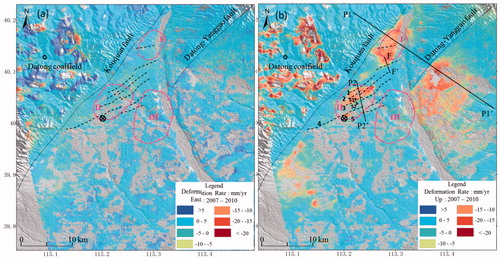
are the satellite heading angles. As a result, the 2D deformation velocity fields in the east–west and vertical directions can be recovered. The 2D deformation rate field from the common coverage between the Envisat ASAR and ALOS-1 PALSAR images was obtained (). The displacement in the east–west direction was very small compared to that in the vertical direction, and the horizontal displacement occurred mainly in the mountainous coal mine area where the vertical deformation is large (). Different directions of horizontal displacement occurred between two sides of the mining subsidence centre. The vertical displacement () presented a deformation pattern similar with those of , indicating that vertical motion dominates the deformation field in the Datong basin. This result is consistent with a previous investigation (Chang’an University Citation2014).
Figure 6. Two-dimensional displacement obtained from C-band (descending) and L-band (ascending). (a) Displacement rate in the east–west direction. Eastward displacement is positive and westward displacement is negative. (b) Displacement rate in the vertical direction. Negative values represent subsidence and positive values represent uplift. The closed pink curves represent underground water level fall funnel locations. I, II, and III represent the fall funnels for Gudian–Baima, Shizhuang, and Zhijiabao, respectively. The circle with the cross shows the location of the underground water level monitoring station that was mentioned in Section 4.2. Two opposing triangles represent levelling stations mentioned in Section 4.3. The numbers 1–5 represent the GF numbers crossed by profile P2–P2’.
3.5. Mining subsidence
The Datong coalfield is one of the biggest coal production mines in China. The coalfield consists of the Jurassic coalfield and the Carboniferous-Permian coalfield with a total area of 2500 km2. In 2005, coal production exceeded 100 million tons. The large-scale and long-term underground extraction has caused serious environmental problems, such as mine-induced subsidence, landslides, earthquakes, buildings damage, etc. Previous studies have focused on coal mining subsidence monitoring in Datong Coalfield (Zhao et al. Citation2014; Yang et al. Citation2017). According to our InSAR results, the mining-induced subsidence rate is much larger than 20 mm/year. In addition, there are incoherent areas caused by large deformation gradients in the coal mining area, where deformation rates are likely much larger. According to our InSAR results, the mine-induced subsidence area reached 208 km2 during the monitoring period.
4. Discussion
4.1. Ground deformation and faults
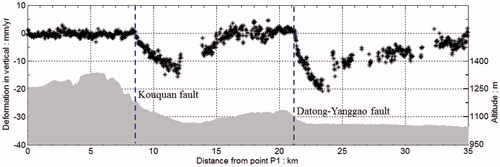
The basement of the Datong basin has different faults (including hidden faults) in different directions, and the main fault directions are north-northeast and northeast (Liu Citation1980; Cheng and Yang Citation1996). According to the InSAR results (), the distribution of ground subsidence is bounded by the faults. For example the subsidence funnels at the western side of the town of Baima, Shizhuang–Jichechang, and Yulin County are clearly affected by the Kouquan fault. The subsidence funnel of the high-tech development zone is bounded by the Datong–Yanggao fault. Affected by the buried faults, the Shizhuang–Jichechang settlement centre appears to have a meteor-like shape ( and ). The profile along P1–P1’ () was extracted, and the result is shown in . The terrain profile is shown at the bottom of the figure. The blue dotted lines show the locations of the Kouquan fault and Datong–Yanggao fault, respectively. The profile shows that the turning points of the deformation occur at the locations of faults.
Figure 7. Profile of the deformation rate along P1–P1’ (shown in ). The blue dotted lines show the locations of faults. The grey shadow represents the terrain along the profile.
4.2. Ground deformation and groundwater
Many studies have shown that groundwater exploitation can cause an aquifer system to have reduced pore water pressure (Holzer and Johnson Citation1985; Woldai et al. Citation2009; Calderhead et al. Citation2010). As a result, the aquifer becomes compressed and ground subsidence occurs. The Datong basin is an inland basin, and the main water resource is groundwater. Since the 1980s, groundwater extraction has been greater than recharge, causing the groundwater level to decrease year by year (Liu et al. Citation1999; Zan Citation2006). According to a report in Datong Daily (Jin and Shuang Citation2007), the water level was less than 10 m below the surface in the 1970s but is now more than 60 m below. The groundwater level was particularly and obviously decreased in the area where industrial and agricultural productions are concentrated. The rate of descent was 0.52–1.24 m/year, and the well density was 11–19 wells per km2. The rate of descent of the groundwater level in the centre of the funnel was 3.67–12.4 m/year, resulting in the local aquifer being in a basically dry state (Jin and Shuang Citation2007).
At present, three groundwater fall funnels have formed in Datong. They are the Gudian–Baima, Shizhuang, and Zhijiabao funnels () (Liu et al. Citation1999; Zan Citation2006). According to the InSAR results, the Gudian–Baima and Shizhuang groundwater fall funnels have good correspondence with ground settlement. However, this is not the case for the Zhijiabao groundwater fall funnel. Due to the stratigraphic structure, compressed layer thickness and other factors also affect the occurrence of ground subsidence at this location (Sun et al. Citation2007). We infer that the mechanical properties of the Zhijiabao area may differ from those of the other two locations. According to the underground water level records at the position of the circle with a cross in (Geological Environment Monitoring Center of Shanxi Province Citation2010), the underground water level dropped 1.5 m during the period of 2007–2010, and our InSAR results show that 20 mm of sedimentation occurred during the same period.
Due to the good correspondence between the ground deformation in the town of Baima and the groundwater fall funnel, we consider that the surface deformation in this area is caused mainly by the exploitation of groundwater. A uniformly opening sill embedded in an elastic half-space was used to explain the vertical deformation (Okada Citation1985; Sun et al. Citation2017; Kim and Lu Citation2018). Eight parameters were defined in the sill model: length, width, depth, strike, dip, opening and location (two parameters). The optimal parameters and associated uncertainties of the model were estimated by the downhill simplex method and Monte Carlo simulations (Press et al. Citation1992). The root mean square error (RMSE) between the InSAR measurements and modelled results was employed to measure the goodness of the prediction.
Because the main depth of groundwater extraction in Datong is within 200 m of the surface (Chang Citation2004; Zan Citation2006), we fixed the depth in our model at 180 m. The remaining parameters were estimated freely. After multiple iterations, the best-fit values for the model parameters (shown in ) were well constrained. presents the InSAR measurements (a), the sill model results (b), and the residual (c) between the InSAR observations and the model deformation. Although some local residuals exist, the model fits the InSAR-derived deformation reasonably well. The best-fit model sill for the deformation is 6.3 km long, 2.7 km wide, has a strike of N39°E, and has an opening rate of 14.4 mm/year. There are still some local settlement areas that cannot be modelled. The residual settlement may be caused by localized extraction of ground water for domestic or industrial applications.
Figure 8. Observed, model, and residual rate maps. (a) Average deformation obtained from InSAR; (b) modelled deformation from the sill; (c) the residuals between the observations and the model.
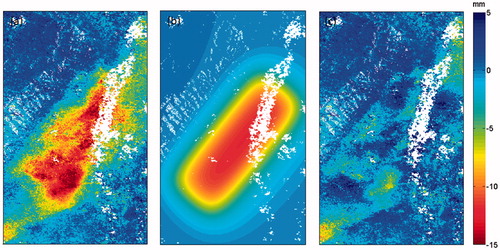
Table 2. Parameters for the best-fitting model sill. Uncertainties correspond to the 95% confidence level.
4.3. Ground fissure activities
GFs are one of the major geological hazards in Datong, and several studies on the GFs in Datong have been published (Li and Yuan Citation2002; Ren et al. Citation2004; Zan Citation2006; Deng Citation2007). According to these investigations, the occurrence of the fissures in Datong was followed by a lowering of the groundwater level. The earliest groundwater drawdown funnel formed in the Jichechang area in the late 1980s. At the same time, several GFs appeared in this region. To 1997, more than 10 GFs had formed in Datong () (Li and Yuan Citation2002; Ren et al. Citation2004). According to the locations and the formation times of GFs and groundwater fall funnels, it is apparent that groundwater overexploitation has impacted GF activity.
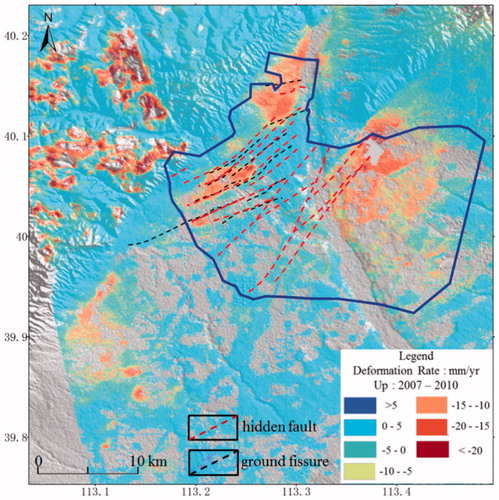
Several published studies have reported that the formation of GFs is related to hidden faults (Peirce Citation1979; Lu et al. Citation2013; Peng et al. Citation2013; Brunori et al. Citation2015). Upward expansion of hidden faults can be promoted due to a combination of tectonic factors and human factors. If the absorption effect of the overlying strata cannot resist the expansion of the hidden faults, GFs will be generated. As a result, the direction of a GF is generally consistent with the direction of its associated hidden fault. We investigated whether this was true for the case of Datong. According to the Geological Environment Monitoring Center of Shanxi Province (Citation2006), there are 18 hidden faults in the Datong urban area (). The blue line in outlines the investigation area of hidden faults. The directions of the faults are in the range of N30–N80 °E, and the dominant direction is roughly N50 °E, which is the same as that of the GFs. We superimposed the positions of the hidden faults onto the GFs, and most of the GFs corresponded to the hidden faults (). This result indicates that the formation of the GFs may have been controlled by the hidden faults.
Figure 9. The distribution of GFs and hidden faults in Datong. The red dashed lines represent hidden faults, and the black dashed lines represent GFs. The blue line outlines the investigation area of hidden faults.
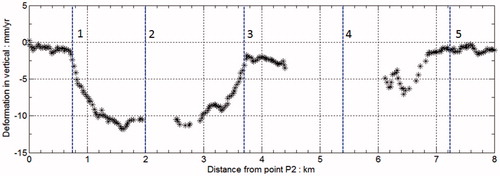
The profile along P2–P2’ (), which is perpendicular to the GFs, was extracted, and the result is shown in . Five GFs are crossed by the profile. No useful InSAR results were collected near GF No. 4. Obvious deformation gradients occur near GFs No. 1 and No. 3, and gentle deformation gradients occur near GFs No. 2 and No. 5. In other words, the activity of the GFs is different at different locations. The activity of GFs is affected by tectonic factors, such as underlying concealed faults and surrounding seismic activity, and non-tectonic factors, such as groundwater exploitation, stratigraphic lithology, etc. (Lu et al. Citation2013). The difference in the activity of GFs at Datong also reflects the difference of tectonic and non-tectonic factors between the GFs.
Figure 10. Profile of the deformation rate along P2–P2’ (shown in ). The blue lines show the locations of GFs. The numbers 1–5 represent the numbers of the GFs crossed by profile P2–P2’, as shown in .
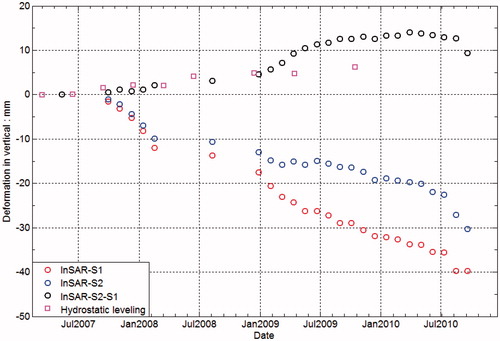
We collected the monitoring data of GF at Jichechang. The positions of GF monitoring stations are shown as two opposing triangles in . The monitoring data were obtained quarterly from 2007 to 2009 by levelling measurement, which was used to monitor the vertical relative displacement between two sides of the GF. Two measuring devices are 15 m apart and are located on either side of the GF. To compare these measurements with InSAR results, time series deformation on two InSAR measurement points (S1 and S2 in ) that are close to the levelling stations are plotted (). Time series vertical deformation from Envisat ASAR images was used in the comparison. The InSAR-derived relative deformation difference between the two sides of GF has a similar increasing trend as that from levelling (). The correlation coefficient of the deformation difference derived from InSAR and that from levelling is 0.58, and the RMSE between InSAR and levelling measurements is 3.3 mm. The reason for the moderate correlation is that the two InSAR measurement points are about 500 m apart while it is 15 m between the levelling stations. As a result, the relative height difference from InSAR is greater than that from the levelling.
Figure 11. Comparison of GF activity between levelling and INSAR measurements. The red and blue circles represent InSAR-derived displacements on point S1 and point S2, respectively. The black circles show the cumulative deformation between S2 and S1. The purple squares represent the levelling measurements.
A creeping dislocation buried in an elastic homogeneous half-space can be used to explain the geodetic observations near a vertical strike-slip fault (Vergne et al. Citation2001; Biggs et al. Citation2008). The model that is usually used to describe the ground deformation across an active fault can be expressed as the following equation (Savage and Burford Citation1973):
(2)
(2)
where is the fault-parallel velocity,
is the distance from the fault,
is the fault slip rate,
is the locking depth, and
is a static offset.
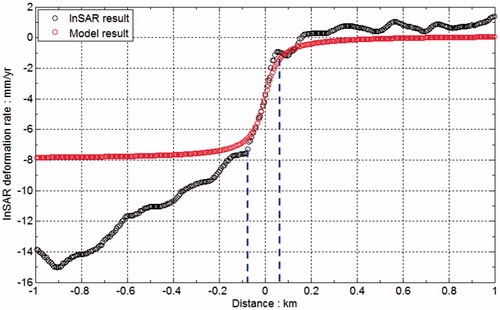
The GFs in Datong are tectonic ones, which have the characteristics of associated hidden faults. The above model can be used to study the deformation across these GFs. As an example, we extracted a profile along F–F’ (), where there is an obvious deformation gradient. The deformation profile is shown in . A gradient of about 6 mm/year exists between the two sides of the crack. The width of influence of the crack along this cross section is approximately 200 m, judging from the distance of the crack deformation gradient.
To model the ground deformation caused by the GF, we took the central position of the deformation gradient as the zero-value position of x in EquationEquation (2)(2)
(2) . Because the deformation beyond the deformation gradient is not considered to be associated with the tectonic activity of the GF, only the deformation values close to the deformation gradient were used in the model. We found the best-fit values for the model parameters using a grid-search method. A locking depth of 44 m and a far field velocity of ∼7.8 mm/year are the best-fit model parameters. The best fitting model is shown as the red line in . According to the model results, the cracks exist in the shallow soil layer within 50 m of the surface.
Figure 12. Deformation rate across the GF and the model result. The blue dotted lines indicate the extent (in distance) of the crack deformation gradient.
5. Conclusion
Several geological hazards occur in the Datong basin, including fault activity, GFs, and land subsidence. In this article, Envisat ASAR images (C-band) and ALOS PALSAR images (L-band) were exploited to map the ground deformation of Datong between 2007 and 2010. In addition to the mining deformation in the western mountains, four major deformation zones were found in the Datong basin. The ground deformations within the basin were considered to be related to groundwater exploitation, fault activities, and urban construction. The ground deformation within the basin is bounded by faults. The formation of GFs, one of the major hazards, is controlled mainly by hidden faults in the basin, which determine the strike and distribution of the GFs. Two-dimensional deformation velocity fields in the east–west and vertical directions were recovered from C- and L-band SAR images. The results showed that vertical displacements dominate the deformation field in the Datong basin. A simple model in a homogeneous elastic half-space was used to model the GF deformation. A locking depth of 44 m and a far field fault slip velocity of −7.8 mm/year were the best-fit model parameters. We also used a uniformly opening sill embedded in an elastic half-space to model the vertical deformation caused by groundwater exploitation and discussed the results.
Disclosure statement
No potential conflict of interest was reported by the authors.
Additional information
Funding
Related Research Data
References
- Bechor NBD, Zebker HA. 2006. Measuring two-dimensional movements using a single InSAR pair. Geophys Res Lett. 33(16):L16311.
- Berardino P, Fornaro G, Lanari R, Sansosti E. 2002. A new algorithm for surface deformation monitoring based on small baseline differential SAR interferometry. IEEE Trans Geosci Remote Sens. 40(11):2375–2383.
- Biggs J, Burgmann R, Freymueller J, Lu Z, Parsons B, Ryder I, Schmalzle GM, Wright T. 2008. The postseismic response to the 2002 M7.9 Denali Fault earthquake: constraints from InSAR. Geophys J Int. 176(2):353–367. 10.1111/j.1365-246X.2008.03932.x.
- Brunori CA, Bignami C, Albano M, Zucca F, Samsonov S, Groppelli G, Norini G, Saroli M, Stramondo S. 2015. Land subsidence, ground fissures and buried faults: InSAR monitoring of Ciudad Guzmán (Jalisco, Mexico). Remote Sens. 7(7):8610–8630. doi: 10.3390/rs70708610
- Calderhead A, Martel R, Alasset P, Rivera A, Garfias J. 2010. Land subsidence induced by groundwater pumping, monitored by D-InSAR and field data in the Toluca Valley, Mexico. Can J Remote Sens. 36(1):9–23.
- Chang Y. 2004. Groundwater regime analysis in water supply area of Datong city. Shanxi Hydrotech. 153(3):72–74.
- Chang’an University. 2014. Monitoring land subsidence and ground fissures over Fenwei Basin by using InSAR and GPS techniques, Xi’an, China.
- Cheng S, Yang G. 1996. Late quaternary segmentation and segmented variation in tectonic geomorphology of southern marginal fault zone. Seismol Geol. 18(4):289–300.
- Deng A. 2007. Discussion of the genesis, distribution characteristics and control measures of the ground fissures in Datong city. Safety Environ Eng. 14(4):44–48.
- Geological Environment Monitoring Center of Shanxi Province. 2006. Survey report on Datong ground fissures. Taiyuan, China: Geological Environment Monitoring Center of Shanxi Province (Datong station). p. 135.
- Geological Environment Monitoring Center of Shanxi Province. 2010. Investigation and monitoring of ground subsidence and ground fissures in Shanxi Basin, Taiyuan, China: Geological Environment Monitoring Center of Shanxi Province (Datong station). p. 158.
- Goldstein RM, Werner CL. 1998. Radar interferogram filtering for geophysical applications. Geophys Res Lett. 25(21):4035–4038. http://dx.doi.org/10.1029/1998GL900033.
- Holzer TL, Johnson AL. 1985. Land subsidence caused by groundwater withdrawal in urban areas. GeoJ. 11(3):245–255.
- Ji L, Liu L, Hao M. 2015. Crustal deformation characteristics of Zhenkang-Yongde region in southwest Yunnan observed by InSAR technology. J Seismol Res. 38(1):84–89.
- Jin X, Shuang H. 2007. Lack of water resources highlight the problem of over-exploitation of groundwater. Datong Daily. 2007(002):11–14.
- Jung HS, Lu Z, Won J, Poland M, Miklius A. 2011. Mapping three-dimensional surface deformation by combining multiple aperture interferometry and conventional interferometry: application to the June 2007 eruption of Kilauea Volcano, Hawaii. IEEE Geosci Remote Sens Lett. 8(1):34–38.
- Lanari R, Mora O, Manunta M, Mallorqui JJ, Berardino P, Sansosti E. 2004. A small-baseline approach for investigating deformations on full-resolution differential SAR interferograms. IEEE Trans Geosci Remote Sens. 42(7):1377–1386.
- Kim JW, Lu Z. 2018. Association between localized geohazards in West Texas and human activities, recognized by Sentinel-1A/B satellite radar imagery. Sci Rep. 8:4727. doi: 10.1038/s41598-018-23143-6.
- Li SD, Yuan RM. 2002. The formation mechanism of ground fissure in Datong city. Acta Sci Nat Univ Pekinensis. 38:104–108.
- Liu YH, Cheng ZX, Niu FJ. 1999. Characteristics of land subsidence and environmental geology effects induced by groundwater exploration in Datong city. Chin J Geol Hazard Control. 9:155–160.
- Liu Z. 1980. Geological structure and seismic activity of Datong basin. Earthquake Res Shanxi. 4:1–4.
- Lu Q, Zhao F, Peng J, Bo F. 2013. Overview on rupture propagation studies of buried ground fissures. J Eng Geol. 21(6):898–907.
- Lu Z, Dzurisin D. 2010. Ground surface deformation patterns, magma supply, and magma storage at Okmok volcano, Alaska, inferred from InSAR analysis: II. Coeruptive deflation, July-August 2008. J Geophys Res. 115:B00B03. doi: 10.1029/2009JB006970.
- Lu Z, Dzurisin D. 2014. InSAR imaging of Aleutian volcanoes: monitoring a volcanic arc from space. Chichester (UK): Springer; p. 390.
- Lu Z, Fielding E, Patrick M, Trautwein C. 2003. Estimating lava volume by precision combination of multiple baselines spaceborne and airborne interferometric synthetic aperture radar: the 1997 eruption of Okmok Volcano, Alaska. IEEE Trans Geosci Remote Sens. 41(6):1428–1436. doi: 10.1109/TGRS.2003.811553.
- Massonnet D, Rossi M, Carmona C, Adragna F, Peltzer G, Feigl K, Rabaute T. 1993. The displacement field of the Landers Earthquake mapped by radar interferometry. Nature. 364(6433):138–142. doi: 10.1038/364138a0.
- Okada Y. 1985. Surface deformation due to shear and tensile faults in a half-space. Bull Seismol Soc Am. 75:1135–1154.
- Peirce HW. 1979. Subsidence fissures and faults in Arizona. Bureau Geol Mineral Technol. 9(2):1–6.
- Peng JB, Chen LW, Huang QB, Men YM, Fan W, Yan JK. 2013. Physical simulation of ground fissures triggered by underground fault activity. Eng Geol. 155:19–30.
- Press W, Teukolsky S, Vetterling W, Flannery B. 1992. Numerical recipes in C. The art of scientific computing. Cambridge (UK): Cambridge University Press; p. 994.
- Qu FF, Zhang Q, Lu Z, Zhao CY, Yang CS, Zhang J. 2014. Land subsidence and ground fissures in Xi’an, China 2005–2012 revealed by multi-band InSAR time-series analysis. Remote Sens Environ. 155:366–376. 10.1016/j.rse.2014.09.008.
- Qu W, Wang QL, Zhang Q, Peng JB, Zhang M. 2013. Present crustal deformation and strain characteristics of Datong Basin. J Geodesy Geodyn. 33(3):11–15.
- Ren JG, Gong WG, Jiao XJ. 2004. Distribution characteristics of ground fissure in Datong and its development trend. Earthquake Res Shanxi. 13:39–42.
- Rosen PA, Hensley S, Joughin IR, Li FK, Madsen SN, Rodriguez E, Goldstein RM. 2000. Synthetic aperture radar interferometry. Proc IEEE. 88(3):333–376.
- Samsonov S, Tiampo K. 2006. Analytical optimization of DInSAR and GPS dataset for derivation of three-dimensional surface motion. IEEE Geosci Remote Sens Lett. 3(1):107–111.
- Savage J, Burford R. 1973. Geodetic determination of relative plate motion in central California. J Geophys Res. 78(5):832–845.
- Sun H, Zhang Q, Zhao C, Yang C, Sun Q. 2017. Monitoring land subsidence in the southern part of the lower Liaohe plain, China with a multi-track PS-InSAR technique. Remote Sens Environ. 188:73–84.
- Sun ZY, Ma T, Ma J, Ma R, Yan CM. 2007. Effect of strata heterogeneity on spatial pattern of land subsidence in Taiyuan City. Rock Soil Mech. 28(2):399–403.
- Vergne J, Cattin R, Avouac J. 2001. On the use of dislocations to model interseismic strain and stress build-up at intracontinental thrust faults. Geophys J Int. 147(1):155–162.
- Wang X, Zhao X, Zhao L, Peng H. 2001. Crustal deformation and strain field analysis of moderately strong earthquake risk along Shanxi seismic belt. Earthquake. 21(1):14.
- Werner C, Wegmüller U, Strozzi T, Wiesmann A. 2000. GAMMA SAR and interferometric processing software. Proceedings of ERS-Envisat Symposium; Gothenburg. Oct 15–20. University Park (PA): CiteSeerX.
- Woldai T, Oppliger G, Taranik J. 2009. Monitoring dewatering induced subsidence and fault reactivation using interferometric synthetic aperture radar. Int J Remote Sens. 30(6):1503–1519.
- Wright TJ, Parsons BE, Lu Z. 2004. Toward mapping surface deformation in three dimensions using InSAR. Geophys Res Lett. 31:L01607.
- Xie X, Jiang W, Wang R, Wang H, Feng X. 2003. Holocene paleo-seismic activities on the Kouquan Fault Zone, Datong Basin, Shanxi Province. Seismol Geol. 25(3):359–374.
- Yang CS, Zhang Q, Xu Q, Zhao CY, Peng JB, Ji LY. 2016. Complex deformation monitoring over the Linfen–Yuncheng Basin (China) with time series InSAR technology. Remote Sens. 8(4):284. doi: 10.3390/rs8040284
- Yang CS, Zhang Q, Zhao CY, Wang QL, Ji LY. 2014. Monitoring land subsidence and fault deformation using the small baseline subset InSAR technique: a case study in the Datong Basin, China. J Geodyn. 75:34.
- Yang Z, Li Z, Zhu J, Yi H, Hu J, Feng G. 2017. Deriving dynamic subsidence of coal mining areas using InSAR and logistic model. Remote Sens. 9(125):1–19.
- Zan YL. 2006. Relation between ground fissure formation and groundwater mining in urban Datong. Coal Geol Chin. 18:26–29.
- Zebker HA, Rosen PA, Goldstein RM, Gabriel A, Werner CL. 1994. On the derivation of coseismic displacement fields using differential radar interferometry: the Landers Earthquake. J Geophys Res. 99(B10):19617–19634. doi: 10.1029/94JB01179.
- Zhao C, Zhong L, Qin Z, Yang C, Zhu W. 2014. Mining collapse monitoring with SAR imagery data: a case study of Datong mine, China. J Appl Remote Sens. 8(1):083574. doi: 10.1117/1.JRS.8.083574
- Zhao C, Zhong L, Qin Z, de La Fuente J. 2012. Large-area landslide detection and monitoring with ALOS/PALSAR imagery data over northern California and southern Oregon, USA. Remote Sens Environ. 124:348–359. doi: 10.1016/j.rse.2012.05.025