
 ?Mathematical formulae have been encoded as MathML and are displayed in this HTML version using MathJax in order to improve their display. Uncheck the box to turn MathJax off. This feature requires Javascript. Click on a formula to zoom.
Abstract
Gas outburst can result in great loss of life and property during tunnel construction. Gas outburst in tunnels in non-coal formation is often more harmful than that in coal-bearing formation. In order to take effective countermeasures to prevent the occurrence of gas outburst during tunnel construction, it is essential to assess the risk of gas outburst before tunnel construction. This paper attempts to establish an assessment system for evaluating the risk of gas outburst in tunnels in non-coal formation in the survey phase of tunnelling based on the attribute mathematical theory. Based on the principle of relevance and operability, eight factors that influence the gas outburst in non-coal formation are selected as the attribute evaluation indices. Attribute measure functions are constructed to calculate the single index attribute measures for evaluation indices. The fuzzy Analytic Hierarchy Process is used to determine weights of evaluation indices. A confidence criterion is applied to recognize the risk grade of the evaluation object. The proposed attribute evaluation system is applied to assess the gas outburst risk in a tunnel in the survey phase. The evaluation results show good agreement with the practical situation of gas, verifying the applicability of this attribute assessment system.
1. Introduction
Gas outburst is one of the major disasters encountered during underground excavation (Beamish and Crosdale Citation1998; Valliappan and Wohua Citation1999; Aguado and Nicieza Citation2007). Gas outburst in tunnels is the phenomenon that gas accompanied by broken rock mass or coal instantaneously spew into the excavated space. Gas outburst occurring during tunnel construction can cause the collapse of the tunnel face as well as the emission of gas into the excavated space, which may cause asphyxia of humans, corrosion of machine, and even combustion and explosion. Many cases of gas outburst have occurred during the tunnel construction and caused huge casualties and economic loss (Proctor Citation2002; Copur et al. Citation2012; Kang et al. Citation2013).
Many studies have been carried out on gas outburst for the tunnel construction in the coal-bearing ground. Experience referred from coal mining (Rodríguez and Lombardía, Citation2010) and some special technologies have been applied to prevent the coal and gas outburst during the tunnel construction (Lin and Zhou Citation1995; Zheng et al. Citation2000; Jiang et al. Citation2005; Kissel Citation2006). Emphasis has also been placed on assessing hazards potential for gas outburst and explosion (Kissel Citation2006).
However, research on gas outburst for the tunnel construction in non-coal formation is limited. The construction of tunnels crossing non-coal formation is greatly affected by gas outburst. shows some cases of tunnel construction in non-coal formation encountering gas-related problems. In the construction of tunnels crossing coal seams, as the locations of coal seams are relatively fixed, the risk related to gas released by coal seams can be possibly predicted with some specific survey means. However, compared with gas released by coal seams, the gathering and emission of the gas in the non-coal formation are of higher randomness and nonuniformity (Cheng et al. Citation2016). As it is more difficult to obtain the information of gas in non-coal formation, gas outburst in tunnels in non-coal formation is often more harmful than that in coal-bearing formation (Kang et al. Citation2013; Cheng et al. Citation2016). Therefore, the study on risk assessment of gas outburst in tunnels in non-coal formation has a very important practical significance.
Table 1. Cases of tunnel construction in non-coal formation encountering gas-related problems (after Copur et al. Citation2012; Kang et al. Citation2013).
Table 2. Attribute grade subdivision of single evaluation index.
Currently, some mathematical methods have been applied in the risk assessment of gas outburst in tunnels, including fuzzy logic and Bayesian probability analysis (Longo and Dinis Da Gama Citation2002), grey correlation analysis (Wu et al. Citation2005), the coupling analysis based on set pair analysis and triangular fuzzy number (Chen et al. Citation2011), and Fuzzy Analytic Hierarchy Process (Qiu et al. Citation2015). However, these studies either only pay attention to the factor related to coal seam (Wu et al. Citation2005; Chen et al. Citation2011; Qiu et al. Citation2015) or only consider the influence of geographical factors to gas outburst (Longo and Dinis Da Gama Citation2002), making their assessment system inapplicable to the gas outburst risk in non-coal formation. In addition, each mathematical method mentioned above has its limitations: the membership function constructed in the fuzzy logic method has randomness and the Bayesian probability analysis requires vast amounts of statistical data; the evaluation indices are simplified to have equal importance for gas outburst in the correlation analysis; the coupling analysis is based on random simulation experiment and the calculation process is relatively complex; the Fuzzy Analytic Hierarchy Process is too subjective. These limitations may make the assessment results unreasonable in some cases.
This paper attempts to establish an assessment system for evaluating the risk of gas outburst in non-coal formation based on the attribution mathematical theory. The evaluation indices for this assessment system are chosen based on the analysis of the cases of gas encountered during tunnelling in non-coal formations, which include both the geological factors and gas properties measured in site. Additionally, the attribute measure function constructed to obtain attribute measure for the single index is unique and a confidence criterion is proposed to recognize the risk grade. These features make the evaluation results more reliable than the results derived from other mathematical methods. A case study is also provided to verify the practicability of this system in assessing gas outburst risk in tunnels in no-coal formation.
2. Theoretical concept
The attribute mathematical theory is developed by Cheng (Citation1997a) to discuss and solve problems of measure of quantitative description and relationship between different quantitative descriptions. An attribute synthetic assessment system mainly consists of three components: single index attribute measure analysis, multiple indices synthetic attribute measure analysis and attribute recognition analysis (Cheng Citation1997b).
Assume that xi (i = 1,2, …, p) are the objects to be evaluated, set X = {x1, x2, …, xp} is the object space, F is one attribute of the object xi and is called the attribute space. If the attribute F comprises of m states, C1, C2, …, Cm, then Ck (k = 1,2, …, m) is regarded as the subset of F and called attribute set. If the object xi has n evaluation indices, I1, I2, …, In, and tj (j = 1,2, …, n) is the measured value of the evaluation index Ij (j = 1,2, …, n), the object can be expressed as a n-dimension variable xi= (t1, t2, …, tn). Then the attribute (Ck) of the object (xi) can be determined by attribute synthetic measure evaluation based on measured value (t1, t2, …, tn). The attribute synthetic evaluation system mainly consists of three components: single index attribute measure analysis, multiple indices synthetic attribute measure analysis and attribute recognition analysis.
2.1. Single index attribute measure analysis
The extent that a measured value tj belonging to an attribute Ck is evaluated by the single index attribute measure, μxjk, whose value can be obtained by establishing attribute measure function. To construct the attribute measure function (μxjk) for each single evaluation index, the value of each index is first divided into m ranges corresponding to the m attributes, as shown in , where ajk (j = 1, 2, …, n; and k = 0, 1, 2, …, m) should satisfy aj0 < aj1 <··· < ajm or aj0 > aj1 >··· > ajm. Two necessary parameters, bjk and djk, are given in the following forms (Table 2) (Li et al. Citation2013):
(1)
(1)
(2)
(2)
Let t represent the value of evaluation index; k = 1,2, …, m-1, and j = 1,2, …, n.
When aj0 < aj1 <··· < ajm, the attribute measure functions are expressed as EquationEquations (1)(1)
(1) to Equation(3)
(3)
(3) .
(1)
(1)
(2)
(2)
(3)
(3)
When aj0 > aj1 >··· >ajk, the attribute measure functions are expressed as EquationEquations (4)(4)
(4) to Equation(6)
(6)
(6) .
(4)
(4)
(5)
(5)
(6)
(6)
2.2. Multiple indices synthetic attribute measure analysis
The extent that the object (xi) having the attribute (Ck) is evaluated by the synthetic attribute measure, μxk. Multiple indices synthetic attribute measure, μxk, is expressed as the following form.
(7)
(7)
where k = 1,2, …, m; μxjk is the single index attribute measure; and wj is the weight of evaluation index Ij.
2.3. Attribute recognition analysis
In attribute recognition analysis, the attribute sets, C1, C2, …, Ck, must be disjointed and comparable. Then a confidence criterion is used to recognize the attribute Ck0 of the evaluation object (xi) based on the synthetic attribute measure μxk. The confidence criterion is expressed as following forms.
When the attribute set meets that C1> C2> ··· > Ck (1 ≤ k ≤ m),
(8)
(8)
or when the attribute set meets that C1 <C2< ··· <Ck (1≤ k≤ m),
(9)
(9)
the object x belongs to k0th risk grade Ck0; where λ is the confidence coefficient and 0.5≤ λ ≤ 1.0. In general, the value of λ is found to be in the range of 0.6–0.7 (Cheng Citation1997b).
3. Attribute synthetic evaluation system for assessing gas outburst risk in tunnel
Based on the attribute mathematical theory, the risk assessment of gas outburst in tunnels in non-coal strata is defined as the following forms:
The space of object X= {tunnel in non-coal formation}; the attribute space F={gas outburst} which comprises of four subsets, C1, C2, C3 and C4, and each subset represent a risk grade of gas outburst in tunnel; I1, I2, …, I10 are ten evaluation indices of gas outburst as presented in section 3.1; t1, t2, …, t10 are measured values of these evaluation indices in the survey phase of tunnelling. The single index attribute measures, μxjk (j = 1,2, …, 10 and k = 1,2, …, 4), is constructed to assess the extent that the measured value of the index belong to each risk grade of gas outburst, and the synthetic attribute measure, μxk, is obtained to determine the gas outburst risk grade.
3.1. Evaluation indices for gas outburst risk in tunnels
Gas outburst is the phenomenon that gas accompanied with broken rock mass suddenly ejects into the excavated space under the effect of ground stress and gas pressure and is influenced by a variety of factors. In the survey phase of tunneling, three main categories of factors affecting gas outburst in tunnels in non-coal formation are selected as the attribute evaluation indices. The selection of the evaluation indices is based on the existing related researches (Shepherd et al. Citation1981; Lama and Bodziony Citation1998; Peng et al. Citation2008; Rodríguez and Lombardía Citation2010; Zarei et al. Citation2011; Kang et al. Citation2013; Cheng et al Citation2016) and analysis of the cases of gas encountered during tunnelling in non-coal formation is presented in .
3.1.1. Gas-related properties
In the survey phase of tunnelling in areas where gas may exist, boreholes are essentially drilled to obtain information of gas properties. The gas concentration obtained in boreholes can roughly reflect the concentration of gas in the ground. The maximum gas concentration tested in boreholes is chosen as an attribute evaluation index for gas outburst risk assessment. The index is graded accordingly to four risk grades (Gan Citation2014): 0 < C ≤ 5000 ppm, 5000 ppm < C ≤ 10,000 ppm, 10,000 ppm < C ≤ 15,000 ppm and C > 15,000 ppm, where C is the maximum gas concentration in boreholes and ppm means parts-per-million, 10−6.
The gas pressure is the other significant property of gas, which is the power source of gas outburst. A higher gas pressure tends to lead to a higher gas emission speed. The maximum gas pressure tested in borehole is chosen as an attribute evaluation index for gas outburst risk assessment and graded accordingly to four grades (Kang Citation2009): 0 < Pm≤0.35 MPa, 0.35 MPa < Pm ≤ 0.74 MPa, 0.74 MPa < Pm ≤ 1.0 MPa and Pm > 1.0 MPa, where Pm is the maximum gas pressure measured in boreholes.
3.1.2. Geological conditions
The geological structures, mainly including faults and folds, are closely related to the gas outburst (Shepherd et al. Citation1981). Fold and fault can act as main structural traps to make gas reservoirs (Zarei et al. Citation2011). The occurrence probability of gas outburst in the areas with sealed geological structures tends to be higher than that in areas with open geological structures (Kang Citation2009).
Formation lithology is also an important factor influencing the gas burst. If a formation crossed by tunnels contains gas-productive rocks, such as shale, gneiss and so on, the formation is the source of gas. Even if the rock formation crossed by the tunnel zone is not gas-productive, the permeability of the rocks also affects the presence of gas in the formation. Gas is easily gathering in the high-permeability strata which are covered by the low-permeability strata (Han Citation2012; Yuan Citation2014).
The integrity of rock mass in the tunnel zone influences the presence of gas. The joints, fissures, and caves in rock mass are the storage spaces for gas. It is easier for gas gushing out from the fractured rock mass than that from the relatively intact rock mass (Kang Citation2009). The integrity of rock mass (kv) can be calculated by kv = (Vpm/Vpr)2, where Vpm is the longitudinal wave velocity in rock mass and Vpr is the longitudinal wave velocity in intact rock. The Vpm and Vpr can be tested in geological borehole. The kv is graded accordingly to four gas outburst risk grades: kv > 0.55, 0.35 < kv ≤ 0.55, 0.15 < kv ≤ 0.35 and 0 < kv ≤ 0.15.
The attitude of the rock stratum influences the diffusion of gas. The strata with a steep dip are beneficial for gas to diffuse outside the tunnel zone, while the flat strata are in favor of preserving gas in the zone (Yuan Citation2014). The inclination angle of the rock formation (θ) is chosen as attribute evaluation indices and graded accordingly to four gas outburst risk grades: θ > 60°, 30 < θ ≤ 60°, 10 < θ ≤ 30°, and 0 < θ ≤ 10°.
The spaces occupied by groundwater and gas are complementary. The flow of groundwater can drive the migration of gas, and groundwater can also take away some of the gas blended into it (Kang Citation2009). Therefore, the flow of groundwater can reduce the presence of gas in the ground. The groundwater flow rate (Q), which can be tested in geological boreholes, is selected as an attribute evaluation index and graded according to four gas outburst risk grades: Q > 5 L/s·m−1, 1 L/s·m−1 ≤ Q ≤ 5 L/s·m−1, 0.1 L/·m−1 <Q ≤ 1 L/s·m−1 and 0 < Q ≤ 1 L/s·m−1.
3.1.3. Engineering properties of the proposed tunnel
Engineering properties of the proposed tunnel also influence gas outburst in tunnels, among which the depth of the proposed tunnel is the most significant one. The buried depth not only influences the gas pressure but also influences the storage of gas in the strata. Generally, gas pressure increases with increasing of the buried depth, and the higher buried depth is not beneficial for gas for gas escaping towards the ground face. Therefore, larger buried depth is more conducive to the occurrence of gas outburst (Peng et al. Citation2008). The depth of the proposed tunnel (h) is graded according to four gas outburst risk grades: 0≤ h < 100 m, 100≤ h < 300 m, 300 m≤ h < 500 m and h > 500 m.
The above-mentioned influence factors were elected as the attribute evaluation indices and the evaluation index system for the attribute assessment system is shown in . To meet the data format of the extension theory, the evaluation indices were quantitatively graded into four grades according to the existing studies and the statistical data from cases of gas encountered during tunnelling in non-coal formation (Appendix A). The quantitative grading of the evaluation indices is presented in . Index I1, I2, I5, I6, I7 and I8 are quantitatively graded by their values, and index I3 and I4 are quantitatively graded according to their ratings obtained by expert evaluation. The rating standards of indices I3 and I4 are presented in and , respectively. The corresponding risk gradation of gas outburst in tunnels is shown in .
Figure 1. Evaluation index system for risk assessment of gas outburst in tunnels in non-coal formation.
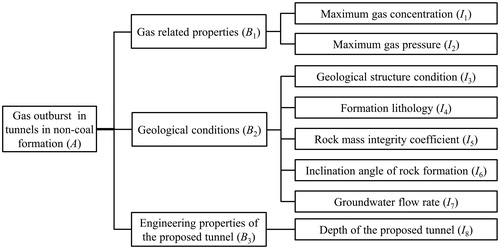
Table 3. Quantitative grading of the evaluation indices.
Table 4. Rating standard of the index, geological structure condition (I3).
Table 5. Rating standard of the index, formation lithology (I4).
Table 6. Risk gradation of gas outburst in tunnels in non-coal formation.
3.2. Attribute measure function for single evaluation index
Based on the quantitative grading standard of the evaluation indices shown in , attribute measure function of the single index can be constructed according to EquationEquations (1)(1)
(1) to Equation(8)
(8)
(8) . shows the images of attribute measure functions of the evaluation indices (I1∼I8).
Figure 2. Attribute measure functions for evaluation indices: (a) Maximum gas concentration (I1), (b) Maximum gas pressure (I2), (c) Geological structure condition (I3) and formation lithology (I4), (d) Rock mass integrity coefficient (I5), (e) Inclination angle of rock formation (I6), (f) Groundwater flow rate (I7), and(g) Depth of the proposed tunnel (I8).
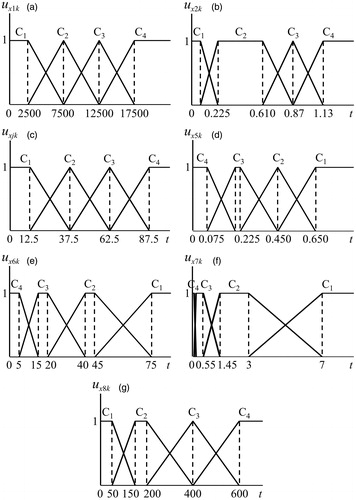
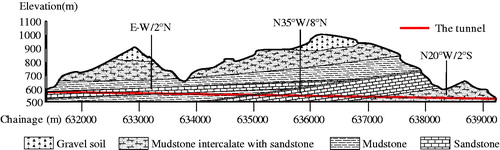
Figure 3. Engineering geology of the tunnel.
3.3. Weights distribution for evaluation indices
The weights of evaluation indices are determined by using the fuzzy Analytical Hierarchy Process (FAHP), which was originally developed by Chang (1996). The FAHP calculation steps are presented in Appendix B (after Nezarat et al. Citation2015). The relative importance scales described by triangular fuzzy numbers (TFN) are used to express expert judgement is shown in .
Table 7. Relative importance and corresponding TFN (after Nezarat et al., Citation2015).
The pairwise comparison matrix for B-criteria level and I-criteria level are constructed and presented in . As the consistency ratio (CI) values of the three comparison matrixes are computed as 0.016, 0 and 0.02, respectively, it means these three comparison matrixes meet the consistency requirement. Then, the weights of evaluation indices in each criteria level are calculated and presented in the corresponding tables. The integrated weights of the eight evaluation indices are calculated and shown in .
Table 8. The fuzzy pairwise comparison matrix and weights for indices at B-criteria level.
Table 9. The pairwise comparison matrix and weights for indices (I1 and I2) at B1-criterion level.
Table 10. The pairwise comparison matrix and weights for indices (I3 to I7) at B2-criterion level.
Table 11. Integrated weights for evaluation indices I1 to I8.
4. Case study
4.1. Project overview of the tunnel
A tunnel for the case study is located in Guangyuan, Sichuan Province in China. This tunnel, a single tube tunnel with two lanes, is part of the Lanzhou-Chongqing Railway and has a length of 7868 m and a maximum depth of 420 m. The entrance and exit chainage of the tunnel is 631,367 and 639,235 m, respectively. No coal seams were found in the tunnel zone, but the gas-productive strata located about 2000 to 2800 m below the tunnel zone were verified by drilling and seismic exploration. The gas might diffuse upward to the tunnel zone through the fissures in rock mass and gas outburst would occur during the tunnel construction. To take measure to reduce the gas outburst risk, the system described previously is applied to assess the gas outburst risk before tunnel construction.
4.2. Risk assessment of gas outburst in the survey phase
In the survey phase, the seismic exploration was applied to obtain the geological structure information for the tunnel. Probe boreholes were drilled to obtain geological information, including formation lithology, the inclination angle of rock formation, the integrity of rock mass and flow rate of groundwater, and the gas-related information, including gas concentration and gas pressure. The tunnel zone is located in monocline formation, and no fault crosses the tunnel zone. The inclination angle of rock formation changes from 2° to 8°. The main geologic formations crossed by the tunnel are composed of sandstone, mudstone, and mudstone intercalated with sandstone. shows the engineering geology for the tunnel. Gas was found in two boreholes that were drilled at chainage 635,165 and 637,745 m. The maximum concentration tested in borehole was 6500 and 2730 ppm, respectively, and the maximum gas pressure was 0.2 and 0.12 MPa, respectively. Based on the geological structure information and the gas-related information obtained in the survey phase, the risk of the gas outburst at chainage 635,165 m and 637,745 m was assessed by using the proposed attribute synthetic evaluation system.
Based on measurements and expert evaluation, values of attribute evaluation indices for the two chainage points were determined and presented in .
Table 12. Values of the attribute evaluation indices at chainage 635,165 and 637745 m.
Based on the values of evaluation indices presented in , the value of each single index attribute measure can be calculated by using the attribute measure function is shown in . Then the multiple indices synthetic attribute measure can be obtained by EquationEquation (7)(7)
(7) , where the weights of the eight evaluation indices in were used. In the survey phase, the confidence coefficient λ can be valued as 0.7 considering the safety of tunnel construction (Li et al. Citation2013). Because the lower risk of gas outburst is beneficial to the safety of tunneling, the order of the attribute sets is determined as C1 > C2 > C3 > C4 (Cheng Citation1997a), thus the confidence criterion of attribute recognition analysis can be expressed as the following equation:
(10)
(10)
Based on the calculated result of synthetic attribute measure, the risk grade of gas outburst in the two locations was determined by EquationEquation (10)(10)
(10) and the evaluation results were presented in . According to the evaluation results, the gas outburst risk at 635,165 and 637,745 m was both assessed as C2.
Table 13. Evaluation results of gas outburst risk in survey phase.
4.3. Countermeasures and filed-observed data
To reduce the risk of gas outburst and ensure the safety of tunnel construction, countermeasures had been taken during construction of the tunnel. The probe boreholes, with a diameter of 89 mm and a length of at least 30 m, were drilled on tunnel face to detect gas ahead of the tunnel face (see ). The probe boreholes were drilled with the cycle length of 25 m and overlapping length of at least 5 m. When gas was found in the boreholes, the gas emission rate and gas pressure were tested. A KJ101N automatic monitoring system (see ) was applied to monitor gas in the tunnel. The CJG-10 optical interference gas detector (see ) and JCB4 portable gas detector (see ) were used to detect gas concentration at places where gas gathers easily, such as tunnel vault, uneven parts on tunnel face or sidewall, collapse chamber, parts where tunnel cross section changes and so on. When the gas concentration, the proportion of gas occupied in the air, measured in specific locations exceeded the limits, the corresponding countermeasures were conducted following the criteria shown in .
Figure 4. Probe borehole for detecting gas.
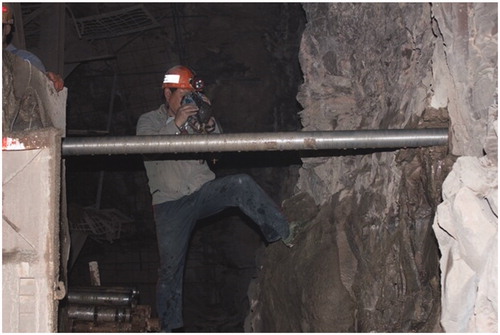
Figure 5. Equipment used to detect gas during tunnel construction: (a) Structure diagram of KJ101N automatic monitoring system; (b) CJG-10 optical interference gas detector; and (c) JCB4 portable gas detector.
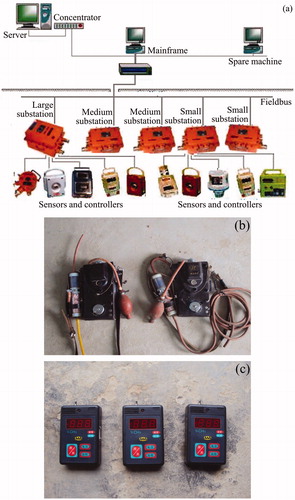
Table 14. Gas concentration limits and corresponding countermeasures (after Ministry of Railways of China Citation2002).
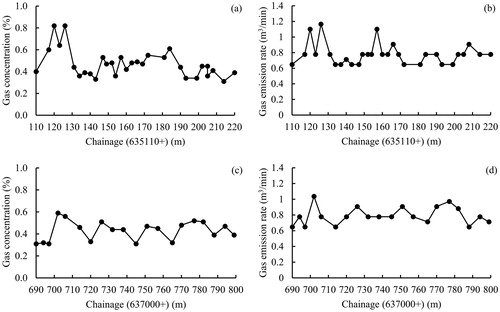
To verify the assessment results of gas outburst risk obtained by using the proposed evaluation system, the gas emission situation in the areas near the assessment points at 635,16 and 637,745 m were recorded. Although no gas or broken rock mass was found to instantaneously spew into the excavated space during excavation at chainage 635,110 to 635,220 m and 637,690 to 637,800 m, the maximum gas concentration and gas emission rate were relatively high at these two sections. The measured maximum gas concentration and the calculated gas emission rate at chainage 635,110 to 635,220 m and 637,790 to 637,800 m were presented in and 7, respectively. It can be seen that the maximum gas concentration reached 0.82% at chainage 635,110 to 635,220 m while that was 0.59% at chainage 637,790 to 637,800 m. The minimum value of gas emission rate was 0.65 m3/min at chainage 635,110 to 635,220 m and 637,790 to 637,800 m, but the maximum gas emission rate was 1.17 m3/min in the former chainage section and was 1.04 m3/min in the latter chainage section. As no gas or broken rock mass instantaneously spewed into the tunnel but the gas emission rate was larger than 0.5 m3/min in the two chainage sections, the gas outburst risk was determined as C2 according to the risk gradation in . So, the assessment results of gas outburst risk were verified to be consistent with the practical situation.
Figure 6. Maximum gas concentration and gas emission rate: (a) Maximum gas concentration measured at 635,110–635,220 m; (b) gas emission rate at 635,110–635,220 m; (c) Maximum gas concentration measured at 637690–637800 m; and (d) gas emission rate at 637,690–637,800 m.
4.4. Discussion
Based on the attribute evaluation system, the gas outburst risk at the two points, at chainage 635,165 m (point A) and at chainage 637,745 m (point B), were both assessed as C2. However, there were differences between the attribute recognition results of point A and point B. For point A, the sum of the first two synthetic attribute measures (µx1+µx2= 0.2480 + 0.5234) was 0.7714, while for point B, the sum of the first two synthetic attribute measures (µx1+µx2= 0.3195 + 0.5507) was 0.8702. As 0.7714 is closer to 0.7 than that of 0.8702, the gas outburst risk grade of point A should be closer to C3 than that of point B according to the attribute recognition confidence criterion shown in EquationEquation (10)(10)
(10) . That is to say, the gas outburst risk at point A should be relatively higher than that of point B. Actually, the maximum gas concentration in the chainage section 635,110–635,220 m section A) where the point A locates was 0.82%, while that in the chainage section 635,110–635,220 m (section B) where the point B locates was 0.59%. The maximum gas emission rate in Section A was 1.17 m3/min, whereas that in section B was 1.04 m3/min. The field-observed data shown that the gas outburst risk in section A was relatively higher than that in section B, indicating that the inference based on the synthetic attribute measures was is consistent with the field-observed situation. Therefore, the synthetic attribute measures can be further used to distinguish the difference between the objects which had been assessed as having the same gas outburst risk grade.
5. Conclusions
Based on the attribute mathematical theory, an evaluation system is proposed to assess the gas outburst risk in tunnels in non-coal formation in the survey phase of tunnelling. Based on other related literatures and analysis of the cases of gas encountered during tunnelling in non-coal formation, eight influence factors, including the maximum gas concentration, maximum gas pressure, geological structure conditions, formation lithology, rock mass integrity, inclination angle of rock formation, groundwater flow rate and depth of the proposed tunnel, are selected as the attribute evaluation indices. The attribute evaluation indices are quantitatively graded according to four gas outburst risk grades based on their values or expert ratings. And the risk grades of gas outburst in tunnels in non-coal formation are also defined.
In the proposed attribute evaluation system, the attribute measure functions are constructed to calculate the single index attribute measures for evaluation indices, and a confidence criterion is applied to determine the risk grade of gas outburst. As the attribute measure function constructed for evaluation index is unique and the attribute recognition confidence criterion is based on the orderliness characteristics of the risk grades of gas outburst, the evaluation results obtained from the attribute evaluation system have high reliability.
The proposed attribute evaluation system was used to assess the gas outburst risk in a tunnel in China. In the survey phase, the outburst risk at chainage 635,165 and 637,745 m were assessed to be grade C2. The evaluation results were verified to be in good agreement with the practical situation of gas recorded during tunnel construction. Based on the comparison between the synthetic attribute measures, the difference of the gas outburst risk of the two points was further distinguished. This difference was also consistent with the different gas concentration and gas emission rate recorded at the two points. The proposed attribute evaluation system was verified to be an efficient tool for assessing the gas outburst risk in tunnels in non-coal formation in the survey phase of tunnelling.
However, the proposed evaluation system in this paper still has its limitations. The quantitative grading of some indices and the weights of the indices are derived from expert judgement, making the evaluation results influenced by subjectivity. To improve the accuracy of the attribute evaluation results, a more reasonable evaluation index system should be established in the future research.
Appendix A: Cases of gas encountered during tunnelling in non-coal formation
Appendix B: FAHP calculation process
A TFN represented by the symbol is shown in . A TFN is simply denoted as
= (l, m, u). The parameters l, m and u, respectively, denote the smallest possible value, the most promising value and the largest possible value that describe a fuzzy event. Each TFN has linear representations on its left and right side such that its membership function can be defined as EquationEquation (B1)
(B1)
(B1) .
(B1)
(B1)
A fuzzy number can always be given by its corresponding left and right representation of each degree of membership:
(B2)
(B2)
Let X= {x1, x2, …, xn} be object set and G= {g1, g2,…, gn} be goal set. The m extent analysis values for each object can be obtained by the following EquationEquation (B3)(B3)
(B3) :
(B3)
(B3)
where
(j = 1, 2, …, m) are TFN.
Then, the value of fuzzy synthetic extent with respect to the ith object is obtained by EquationEquation (B4)(B4)
(B4) .
(B4)
(B4)
To obtain , the fuzzy addition operation of m extent analysis values for a matrix is defined:
(B5)
(B5)
And the inverse of the vector is computed by the following EquationEquation (B6)
(B6)
(B6) .
(B6)
(B6)
If M1= (l1, m1, u1) and M2= (l2, m2, u2) are two TFN, as shown in , the degree of possibility of M2 ≥ M1 is defined as EquationEquation (B7)(B7)
(B7) .
(B7)
(B7)
And can be expressed as the following EquationEquation (B8)(B8)
(B8) :
(B8)
(B8)
where d is the ordinate of the highest intersection point D between
and
. To compare M1 and M2, the value of V(M1≥M2) need to be obtained as the same approach as V(M2≥M1).
Therefore, the possibility degree for a convex fuzzy number to be greater than k convex fuzzy numbers Mi (i = 1, 2, …, k) can be defined by the following equation:
(B9)
(B9)
Let d(Ai)= min[V(Si≥Sk)] for k = 1, 2, …, n; k≠i. Then the weight vector is shown as EquationEquation (B10)(B10)
(B10) .
(B10)
(B10)
where Ai (i = 1,2, …, n) are n elements. Via normalization, the normalized weight vectors are shown in EquationEquation (B11)
(B11)
(B11) .
(B11)
(B11)
where W is a nonfuzzy number as the goal of weight.
Table A1. Cases of gas encountered during tunnelling in non-coal formation.
Acknowledgments
The authors would like to thank Prof. Dwayne Tannant at University of British Columbia for his help in completing this work.
Disclosure statement
No potential conflict of interest was reported by the authors.
Additional information
Funding
Related Research Data
References
- Aguado MBD, Nicieza CG. 2007. Control and prevention of gas outbursts in coal mines, Riosa–Olloniego coalfield, Spain. Int J Coal Geol. 69(4):253–266.
- Beamish BB, Crosdale PJ. 1998. Instantaneous outbursts in underground coal mines: an overview and association with coal type. Int J Coal Geol. 35(1–4):27–55.
- Chen GY, Qin S, Ge S, Wang MW. 2011. A novel coupling analysis model of SPA, TFN and SS for the gas burst in tunnel. China Civ Eng J. 44:240–243.
- Cheng Q. 1997a. Attribute recognition theoretical model with application. Acta Scientiarum Naturalium Universitatis Pekinensis. 33(1):12–20.
- Cheng Q. 1997b. Attribute mathematical model and fuzzy mathematical model for quality assessment. Math Stat Manag. 16(6):18–23.
- Cheng QX, He C, Quan XL. 2016. Analytical investigation of gas burst disasters during tunnelling in non-coal measure strata. Mod Tunnel Technol. 53(3):146–150.
- Copur H, Cinar M, Okten G, Bilgin N. 2012. A case study on the methane explosion in the excavation chamber of an EPB-TBM and lessons learnt including some recent accidents. Tunnel Undergr Space Technol. 27:159–167.
- Gan GY. 2014. The characteristics of the storage status of the oil and gas along the Chengdu-Chongqing Passenger Railway and comprehensive evaluation on the tunnel gas hazards [master’s thesis]. Chengdu: Southwest Jiaotong University.
- Han M. 2012. Study on risk evaluation of tunnel gas disaster [master’s thesis]. Changsha: Central South University.
- Jiang DY, Liu C, Zhang GY, Zheng JL. 2005. Technologies of whole cutting through coal seam and preventing collapse in highway tunnels. Rock Soil Mech. 26(6):906–909.
- Kang XB. 2009. Study on gas disaster risk assessment system of tunnel engineering [dissertation]. Chengdu: Chengdu University of Technology.
- Kang XB, Xu M, Luo S, Xia Q. 2013. Study on formation mechanism of gas tunnel in non-coal strata. Nat Hazards. 66(2):291–301.
- Kissel FN. 2006. Preventing methane gas explosions during tunnel construction. In: Kissel FN, editor. Handbook for methane control in mining. Information Circular 9486. Pittsburgh: National Institute for Occupational Safety and Health (NIOSH), pp 169–184.
- Lama RD, Bodziony J. 1998. Management of outburst in underground coal mines. Int J Coal Geol. 35(1-4):83–115.
- Li SC, Zhou ZQ, Li LP, Xu ZH, Zhang QQ, Shi SS. 2013. Risk assessment of water inrush in karst tunnels based on attribute synthetic evaluation system. Tunnel Underground Space Technol. 3850–3858.
- Lin BQ, Zhou SN. 1995. Outburst preventive mechanism of stress relaxation groove in coal tunnel. Chin J Geotech Eng. 17(3):32–38.
- Longo S, Dinis Da Gama C. 2002. Prevention of gas invasion risks during tunnel excavation with favourability functions. The ISRM International Symposium on Rock Enginnering for mountanious regions and the (Eurock 2002), Funchal, Madeira Island, Portugal.
- Ministry of Railways of China 2002. Technical code for railway tunnel with gas. Beijing: China Railway Press.
- Nezarat H, Sereshki F, Ataei M. 2015. Ranking of geological risks in mechanized tunneling by using Fuzzy Analytical Hierarchy Process (FAHP). Tunnel Undergr Space Technol. 50:358–364.
- Peng L, An Y, Zhang Y, Shi C. 2008. Identification of gas burst in tunnel at the prospecting stage by using extension theory: A case study. China Civ Eng J. 41(4):81–85.
- Proctor RJ. 2002. The San Fernando tunnel explosion, California. Eng Geol. 67(1-2):1–3.
- Qiu C, Chen S, Tan X, Huo X. 2015. Construction risk assessment for gas tunnels based on Fuzzy Analytic Hierarchy Process. Chin J Undergr Space Eng. 11(3):774–780.
- Rodríguez R, Lombardía C. 2010. Analysis of methane emissions in a tunnel excavated through carboniferous strata based on underground coal mining experience. Tunnel Undergr Space Technol. 25(4):456–468.
- Shepherd J, Rixon KL, Griffiths L. 1981. Outbursts and geological structures in coal mines: a review. Int J Rock Mech Min Sci Geomechan. 18(4):267–283.
- Valliappan S, Wohua Z. 1999. Role of gas energy during coal outbursts. Int J Numer Meth Eng. 44(7):875–895.
- Wu AY, Xiao HF, Wang CL, He LW. 2005. Establishment and application of weights and gray association model based on coal and gas outburst controlled factors assessment. J China Coal Soc. 30(1):58–62.
- Yuan H. 2014. Research of gas occurrence and migration in tunnel of Chengdenan Express Way [master’s thesis]. Chengdu: Southwest Jiaotong University.
- Zarei HR, Sharifzadeh M, Uromyehi A. 2011. Gas ground risks and geological investigations for TBM tunneling in Iran. In: Asian and, Iranian Tunneling Symposium.
- Zheng JL, Zhang GY, Li XH, Yang L, Dong YK. 2000. The technology of cutting through coal seam and preventing collapse in the right line of Huayingshan highway tunnel. Chin J Geotech Eng. 22(5):559–561.