
 ?Mathematical formulae have been encoded as MathML and are displayed in this HTML version using MathJax in order to improve their display. Uncheck the box to turn MathJax off. This feature requires Javascript. Click on a formula to zoom.
Abstract
Lakes are the most important water resource in arid and semi-arid regions and are good indicators of climate change. The study of lake expansion and contraction can reveal important information about climate change and regional responses. In this study, MOD09A1 global surface reflectance data of MODIS are used to extract the water areas of 12 main lakes in Xinjiang using a support vector machine method to investigate the temporal-spatial dynamics and driving factors of lake area variations between 2000 and 2017. The results indicate that (1) In general, the Xinjiang lakes exhibited large fluctuations between 2000 and 2017; the area of the lakes shrunk by 16.98 km2/year during 2007–2009 but expanded by 80.67 km2/year after 2010. (2) The changes in the Xinjiang lakes exhibited obvious spatial differences. There were strong fluctuations in the areas of the Tail-end lakes and the K value describing the degree of fluctuation in the lake area was 0.2%. The fluctuations in the areas of the Mountain lakes were more stable with a K value of 0.09% and the area of the Plateau lakes increased every year, with an annual increase of 19.90 km2. (3) The lakes with the larger fluctuations in the area were Ebinur Lake, Manasi Lake, and Barkol Lake, and the range of the areas was 370.85, 276.55, and 61.5 km2, respectively. Because of the regional diversity of Xinjiang, the driving forces that affect the area of the lakes differ in different areas. The main factors affecting the lake area change in the Tail-end lakes are the amount of inflowing water and the water use by agriculture and animal husbandry. The main reason for the stability of the Mountain lakes is the balance between water inflow and outflow. The main factor contributing to the expansion of the Plateau lakes area is the abundant supply of glacier/snow melt water. Overall, the main factor contributing to the expansion of Plateau lakes area is abundant glacier snow melt water supply. On the whole, the main factors affecting the temporal and spatial variation of the lake areas in Xinjiang are precipitation (r = .67, p = .003 < .01), temperature (r = .611, p = .007 < .01), and the increase in cultivated land area (r = −.021, p = .004 < .01).
1. Introduction
As an important component of the hydrosphere, lakes are the junction of the interaction between the various spheres, and are closely related to the biosphere, the atmosphere, the lithosphere and so on. It has a special function that regulates regional climate (Wong et al. Citation2017), records regional environmental changes (Meyers & Ishiwatari Citation1993), maintains regional ecosystem balance and biodiversity (Jeppesenetal. 2008; Wetzel Citation2001). However, the expansion and shrinking of lakes have undergone great changes on the global scale due to climate change and continuous development of human economic activities (Herlihy et al. Citation2013; George Citation2010). The area of China's lakes has changed greatly in the last 60 years and nearly 240 lakes have dried up. Studies on the dynamic changes of lakes and the driving forces of the changes have important significance for the protection, development, and utilization of lake resources.
Xinjiang is located in the central region of Eurasia and far away from the ocean; the area is representative of the landscape pattern of the arid region of Eurasia and is an important part of the “Pan-Third Pole Region” (Liu et al. Citation2016; Yao et al. Citation2017). In addition, the area has many inland lakes (Bai et al. 2011). There are 29 lakes that are larger than 10 km2 in the arid area of Northwest China, of which 26 are located in Xinjiang. These lakes are mainly distributed in the low-lying area of the basin or at the terminal points of the rivers. Affected by global climate change and the socio-economic development, the environment surrounding the lakes has been destroyed beginning in the 1950s (Cui et al. Citation2016); some lakes have dried up intermittently (Huang et al. Citation1987) and some of the lakes even dried up completely (Hao et al. Citation2012). Studies have shown that in the 1950s, Manasi Lake in northern Xinjiang had abundant water and the lake area was 577.8 km2. Due to continuous droughts and constant water diversion projects for irrigation, the lake area decreased to 7 km2 in 1972. Manasi Lake completely dried up in 1976 and was dry for the subsequent 20 years. During the same period, the area of Ebinur Lake decreased from 1070 km2 in 1950 to 342.33 km2 in 2014, narrowing by 68% (Wu et al. Citation2017). The area of Barkol Lake in the south of Xinjiang was 97.47 km2 in 1991 and decreased to only 36.18 km2 in 2010 after continuous contraction and increases in salinity and the lake narrowed by 63% in just 30 years, In addition, Lop Nor located in southern Xinjiang was once the second largest saline lake in China. In 1931, the area of the lake was 2375 km2 but it decreased to 660 km2 by 1962; by 1972, Lop Nor had dried up completely (Dong et al. Citation2012). Thus it can be seen that the dynamic monitoring of lake water resources is very important for the scientific use of scarce water resources in arid areas.
Traditional methods for determining lake areas (differential global positioning system and real-time kinematic surveys of the lake boundary) are too time-and labor-consuming and are ineffective. As a result of the rapid development of space-based information technology, remote sensing data with rapid repeat coverage and high spatial resolution are favored for assessing lakes and have become the main tool for monitoring the dynamic changes of lakes. The application of remote sensing monitoring can overcome the limitations of traditional measurement methods (Baban Citation1999) so that continuous monitoring of lakes in arid areas can be achieved to detect rapid changes and instability. Multispectral remote sensing data is mostly used to monitor changes in water areas because the spectral reflectance of water in the visible and near-infrared bands differs from that of vegetation, urban buildings, and soil (Nguyen Citation2012). The methods of lake extraction mainly include the single band threshold method (Zhang and Liu Citation2011), spectral correlation method (Liu et al. Citation2006), spectral ratio method (Lu et al. Citation2013), and classification method (Du et al. Citation2002). Among them, the most commonly used method is the use of water indices. Researchers initially tried to use Advanced Very High Resolution Radiometer (AVHRR) images to measure lake areas and the results indicated that channel 2 was effective for monitoring the changes in the lake area but the spatial resolution of AVHRR is low (1.1 km) and mixed pixels of water and land areas were obtained at a ratio of 1:6 (Harris and Mason Citation1989; He Citation2003). Researchers also used Landsat Multispectral Scanner/Thematic Mapper/Operational Land Imager (MSS/TM/OLI) images to monitor changes that had occurred in lakes since 1970 and analyzed the possible driving forces (Wang 2007; Ma et al. 2010). The accuracy of the lake classification of these studies was higher than 90% (Guirguis et al. Citation1996; Xu Citation2005). However, the influences of cloud limited the determination of the specific changes within a year (Zhang et al. Citation2015). Some scholars used water indices (normalized difference water index (NDWI), modified NDWI (MNDWI), combined water index (CWI)) to extract water from Moderate Resolution Imaging Spectroradiometer (MODIS) surface reflectance products. The results showed that MODIS data can be used to detect large-scale water areas in inland areas and that the inter-annual change in the lakes can be captured (Moradi et al. Citation2014; Kang and Hong Citation2016); however, water pixels are often missed and misclassified in large areas when extracting lakes with different water qualities using the index method (Li et al. Citation2015). In addition, the determination of the threshold between water and land pixels is often subjective and represents a disadvantage of this method of water extraction. Recently, some scholars have used high-resolution Sentinel-1 data to monitor lake changes this approach greatly improves the accuracy of lake extraction but it cannot be used to monitor the temporal and spatial variation of lakes before 2014. In addition, data processing of active microwave data is complex and has large computational requirements (Zeng et al. Citation2017).
Although many scholars have used multiple data sources and different methods for lake extraction, the following problems still exist. First, in most studies, the lake area captured on a specific day is used to represent the area of the lake in 1 year or a specific period and this approach does not effectively characterize lakes with severe fluctuations. Second, studies focusing on long time series and large differences in the changes of the lake area and only using water indices cannot effectively extract lakes with regional differences. Third, a water extraction method based on thresholds and vectorization depends on human-computer interaction based on experience and the subjectiveness affects the accuracy of the results. If the thresholds are determined individually for each water index image for every 8 days during 2000–2017, a total of 3128 images would have to be assessed, which is not feasible. In addition, the changes in the physical status of the lake water in Xinjiang are intense throughout the year and the thresholds also fluctuate greatly.
As a result of the continuous development of support vector machine (SVM) theory, the use of this method has increased in the field of hydrology in recent decades (Sujay and Deka Citation2014). By using the SVM method to extract water from imagery, it is possible to cover all types of water in the study area using training samples; this approach effectively avoids the misclassification of lakes because of differences in water quality, sediment content, and organic matter. In addition, the influences of shadows and other objects on the lake water can be reduced.
In this study, we (1) use the maximum value synthesis method to determine the image that best characterizes the lake areas in a given year, (2) extract lakes using SVM classification to detect rapidly changing lakes and provide an early understanding of basic information on ecological hazards, and (3) update the information on the current state of Bosten, Sayram, Ebinur, Manasi, Ulungur, JiLi, Barkol, Kanas, Aqqikkol, JingYu, Ayakkum, and Aksayqin lakes to enrich our understanding of lake changes in arid areas.
2. Research areas and data
2.1 Research areas
The Xinjiang Uygur Autonomous Region is located in the middle latitudes of the Northern Hemisphere (73°40′E–96°23′E, 34°22′N–49°10′N) near the center of Eurasia and covers an area of 1.66 million sq km. The area is situated inland and is marked by large elevation differences (−166–7920 m), a drought climate, scarce precipitation (average of 150 mm per year), limited surface runoff, and large evaporation. More than 100 lakes are distributed in the mountains, hills, plains, and deserts of Xinjiang. According to the Chinese lake diaries (Wang Citation1998), the number of lakes that are larger than 1 km2 in Xinjiang is 137. They cover an area of 5072 km2 and account for 7.1% of the total lake area of the country. There are 17 lakes that are larger than 100 km2. A lack of water resources and an uneven distribution of the lakes is a significant characteristic of Xinjiang lakes.
Under the influence of global climate change and human-induced development, the Xinjiang lakes have also changed. Some have dried up, some disappeared, whereas others expanded or contracted. For example, Lop Nor completely dried up in 1972. During the Holocene, Ulungur Lake and JiLi Lake comprised one water body and as Wulungu Lake became smaller in a later period, the river was gradually blocked by sand dunes and the lake subsequently changed into two separate lakes. Manasi Lake has now evolved into an intermittent lake that sometimes dries up and sometimes increases in size.
Lakes are important water resources in the Xinjiang regions but also affect the society, economy, and sustainable development of the environment. Therefore, it is of great significance to monitor the changes in the Xinjiang lakes over large areas and over long periods of time by remote sensing.
2.2. Data
In this study, we use the MOD09A1 surface reflectance product of MODIS for the period of 2000–2017 to extract the lake areas in Xinjiang. Landsat 8 data from 2017 are used for validation. All the data are in the WGS84/UTM projection.
2.2.1. MODIS data
MOD09A1 is a level-3 product of MODIS and is an 8-day synthesis of global surface reflectance; the spectral information is shown in . The spatial resolution is 500 m. The MOD09A1 products for the period of 2000–2017 were downloaded from the ladsweb.nascom.nasa.gov website (last visit time: 2017-12-14-21:56). The tiles covering Xinjiang included h23v04, h23v05, h24v04, h24v05, h25v04, and h25v05 (h represents horizontal numbers and v represents vertical numbers). MOD09A1 data has seven bands that are corrected for atmospheric and other conditions such as atmospheric scattering, ozone, aerosol, clouds, bi-directional reflection, and sun elevation. The data are provided in the sine curve projection, which was reprojected to WGS84/UTM in the MODIS reprojection tool (MRT) to allow for the comparison with Landsat 8 data and accuracy analysis. Subsequently, the data were processed into image mosaics using the MRT. In the ArcGIS software, the desired areas were extracted from the mosaics using batch masks based on vector data.
Table 1. MOD09A1/Landsat 8 data band information.
2.2.2. Landsat 8 data
The Landsat8 data were downloaded from https://landsatlook.usgs.gov/viewer.html (last visit time: 2017-12-14-21:56). The sites of the 12 lakes were covered by 153 freely available Landsat 8 data. The spectral information is detailed in and the dates of the images are detailed in . The cloud cover of the scenes is less than 5%. Each lake was covered by a single scene. Atmospheric correction, radiometric calibration, geometric correction, and SVM classification were performed on all the data.
Table 2. Landsat 8 data acquisitions in 2017.
2.2.3. Other data
The data of the Global Lakes and Wetlands Database (GLWD) was downloaded from https://www.worldwildlife.org/pages/global-lakes-and-wetlands-database (last access time: 2017-11-29-17:32:00). The spatial resolution of the data is 30° × 30°. The data were provided in a geographic projection in degrees longitude and latitude and were reprojected to WGS84/UTM projection in ArcGIS software.
The temperature and precipitation data of the meteorological stations in the Xinjiang Uygur Autonomous Region were downloaded from the China Meteorological Data Sharing Service System (last visit time: 2017-12-14-21:56). The data include average temperature, average precipitation, and latitude and longitude at 58 sites. In this study, the point data of the annual average precipitation and temperature were converted into a raster format using Kriging interpolation in ArcGIS.
The Shuttle Radar Topography Mission (SRMT) digital elevation model (DEM) data were obtained from https://dds.cr.usgs.gov/srtm/version2_1/SRTM3/ (last access time: 2018-1-4-12:11) and the resolution is 90 m. The MOD12Q1 global surface land cover data at 1-km resolution were downloaded from ftp://ladsweb.nascom.nasa.gov/ (last access time: 2018-1-4-12:11). The data of the Xinjiang Uygur Autonomous Region's population and cultivated land data for 2000–2015 were obtained from the local bureau of Statistics (http://www.xjtj.gov.cn/ last visit time: 2018-4-28-21:56).
3. Methods
3.1. Spatial join analysis
Spatial joining refers to a method in which the attribute data of one spatial layer are joined to the table of another layer so that the attributes of both layers can be assessed.
In this study, the spatial join analysis is used on the data for a comprehensive analysis of the terrain, annual precipitation, annual temperature, lake distribution, and climatic zones in the lake regions in Xinjiang (). The 12 lakes are divided into the three regional types of Tail-end-lakes, Mountain lakes, and Plateau lakes based on the conditions listed in .
Figure 1. Locations and distributions of lakes investigated in this study.
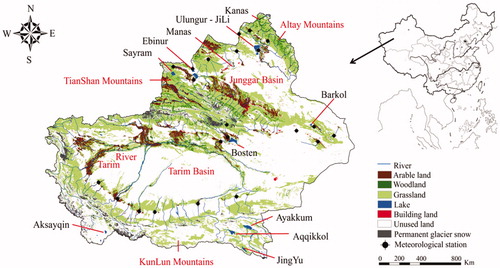
Figure 2. Elements of the spatial join analysis.
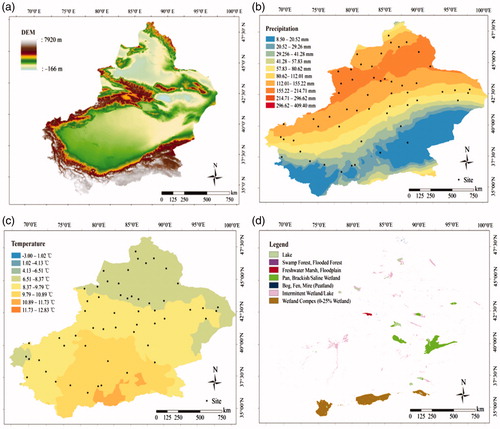
Table 3. Regional divisions of the lakes in Xinjiang.
The lakes in the categories are:
Tail-end lakes: Wulungu Lake, JiLi Lake, Ebinur Lake, Manasi Lake and Barkol Lake;
Mountain lakes: Bosten Lake, Sayram Lake and Kanas Lake;
Plateau lakes: Aksayqin Lake, Ayakekumu Lake, Jingyu Lake, and Aqikekur Lake.
3.2. Maximum value synthesis method (MVS)
In evaluating the MOD09A1 images, it was found that snow was present in most images. In the Tail-end lakes region, snow cover occurs from May to August. The first snow in the Mountain lake region occurs in September and the snow is melted completely by the end of May. In the Plateau lake area, the snowfall begins in March and continues until May, the second snowfalls occur in October and end in December. In previous studies, most researchers used NDWI images from March, April, July, and September to extract lakes and ignored the facts that the snowfall in Xinjiang is not regular, the change in the physical status and areas of the lake, and the large regional differences (Bai et al. Citation2012).
Based on these problems, we first used the “reflectance data quality” layer of the MOD09A1 dataset located and discarded the images with problematic pixels. Second, we screened the 820 images that were not affected by the snow and had clear lake water boundaries. Subsequently, the MVS method was implemented. We used the maximum value as the criterion for selecting the remote sensing data in a given time range. The pixel values of the image were evaluated and the best pixel value in the multi-scene data was selected. A synthetic image was created that best characterized the lake surface product in the same year. As a result, the problems common to single-date remote-sensing studies, such as cloud contamination, atmospheric attenuation, surface directional reflectance, differences in view and illumination geometry, and the influences of ice and snow on the water bodies are minimized. Small changes in illumination geometry occur in MVS data sets due to seasonal changes in the solar zenith and azimuth angles but are unimportant relative to the variations caused by viewing across many degrees of longitude.
3.3. SVM
SVM is a classification and regression technique based on statistical learning theory (Asefa et al. Citation2005); it is also known as a maximum edge classifier. The method is mature and stable and has been used for the classification of many remote sensing datasets, the accuracy of the classification depends largely on the selected kernel function (Zhao et al.Citation2012). Common kernel functions include the linear kernel function, polynomial kernel function, S-shaped kernel function and radial basis kernel function (Brereton and Lloyd Citation2010). In this study, the radial basis kernel function is used to divide the images into water body and non-water body classes, 30–50 water and non-water samples are selected in the image for each lake area. The types of lakes include brine, saline, and freshwater lakes. Prior to the training stage, all input parameters are adjusted to a zero mean and unit variance. Ten training sets are used and among these, 1 is used for testing and the other 9 are used for training. The SVM classification results in the delineation of the pixels belonging to the water class.
3.4. Dynamic degree of the lake area
In this study, the dynamic degree of the lake area (K) is used to represent the degree of fluctuation in the lake area (Zhao et al. Citation2013).
(1)
(1)
where K is the degree of fluctuation in the lake area, Ub is the area of the lake in 2017 and Ua is the area in 2000. In this study, the annual area of the lakes is calculated, therefore, T = 1.
4. Result
4.1. Difference in lake extraction methods
Previous studies have shown that the NDWI (McFeeters Citation1996) can effectively distinguish between lake water and mountain shadows (Liu et al. Citation2011) near the Tianshan Mountains. Therefore, the difference between the NDWI and SVM methods with regard to the extraction of water bodies is determined using the image of the Ebinur lake region as an example. shows the image of the Ebinur lake area in 2015, shows the true color image (RGB), is the classification of the water body based on the NDWI method, is the SVM-based classification result and is the classification of the water body extracted based on the SVM method. The water body extracted by the NDWI method includes saline-alkali land, cloud shadows projected on the ground and a small amount of mountain shadow, resulting in an overestimation of the lake area (); in , the water extracted using the SVM method effectively identifies the saline-alkali land, cloud shadow and mountain shadow and the result is closer to the image in . Therefore, it is more accurate to extract the lake area using the SVM method, which has advantages over the NDWI method requiring a threshold selection.
Figure 3. Comparison of classification methods for extracting lake areas.
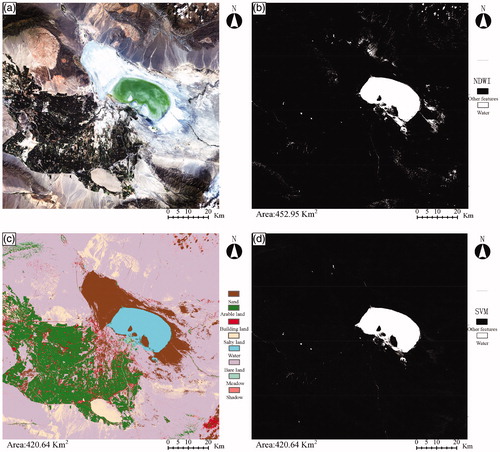
However, in general, the lake areas obtained from the MOD09A1 product are slightly smaller than the lake areas obtained from the Landsat 8 data. This is because the resolution of the MOD09A1 product is 500 m and the pixels are more heterogeneous. In the classification, the mixed pixels result in the underestimation of the lake area.
4.2. Extraction accuracy of Lakes in the Xinjiang region
Using the MOD09A1 data for the period of 2000–2017, the areas of the 12 lakes are extracted and the accuracy of the results is verified by the higher-resolution Landsat 8 data.
In , the bottom image is the Landsat 8 image in 2017 and the orange line in the lower right corner of the thumbnail is the lake boundary in 2017 obtained from the MOD09A1 data. The boundaries of the 12 target lakes are all in good agreement with the lake boundaries of the MODIS images. The accuracy results are shown in . In 2000, 2005, 2010, and 2015, the boundaries of Wulungu Lake, Ebinur Lake, Manasi Lake, JiLi Lake, and Barkol Lake exhibit no obvious regular pattern and there are some differences between the boundary lines. The boundaries of Bosten Lake, Sayram Lake, and Kanas Lake overlap; the boundaries of Ayakekumu Lake, Aqikekur Lake, Jingyu Lake, and Akesayqin Lake increased each year.
Figure 4. Dynamic changes in the lake areas in Xinjiang during 2000–2017.
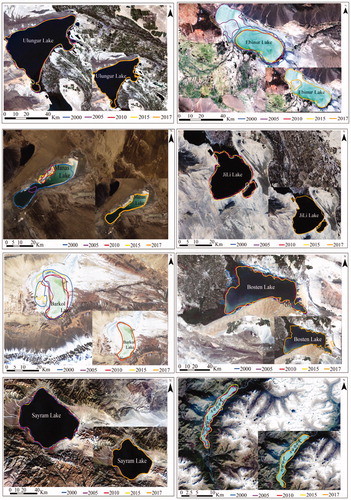
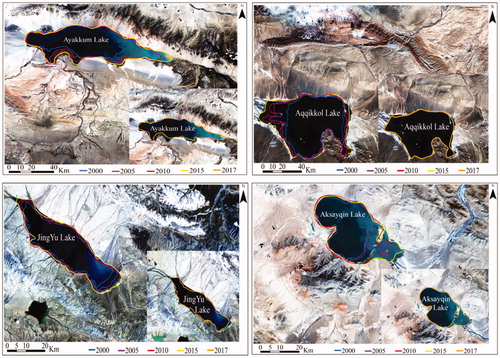
Table 4. Accuracy of the lake area classification.
4.3. Interannual changes in the lake areas
The interannual variability of the lakes is shown in . The total area of change in 18 years was in the range 5276.55–5769.03 km2, the average area was 5380.51 km2 and the minimum and maximum values occurred in 2009 and 2017, respectively. The overall increase in the lake area was 492.48 km2, the annual average increase was 27.36 km2, the maximum increase was 355.05 km2 and the maximum decrease was −140.02 km2, which occurred, respectively, in 2011 and 2009. The total growth rate was 9.33% and the average annual growth rate was 0.55%. The year with the smallest change in lake area was 2010 and the year with the largest change was 2011. The dynamic degree of the lake area () exhibited no obvious trend but the range of the change was very large. The total area growth rate and K value of the Xinjiang lakes varied greatly during 2000–2017 but the mean value was very small. It can be seen that the interannual variation of the lakes in Xinjiang is characterized by strong fluctuations.
Figure 5. Interannual changes in the lake areas in Xinjiang.
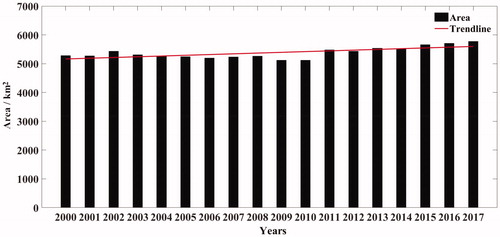
Figure 6. Dynamic degree of the lake area.
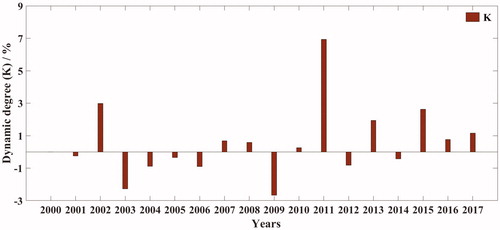
In summary, from 2000 to 2017, the lake area of Xinjiang has experienced expansion after the first attenuation changes, but overall, the total area of the lake has increased. The curve of the lake area change in Xinjiang is characterized by “two peaks” and by considerable fluctuations during 2000–2017.
4.4. Spatial differences in the lake area changes
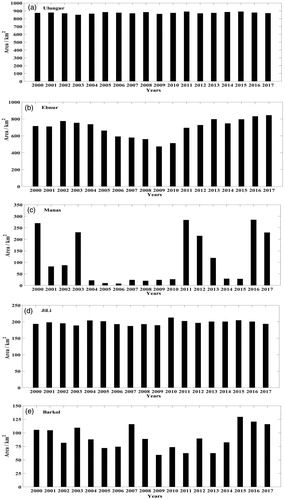
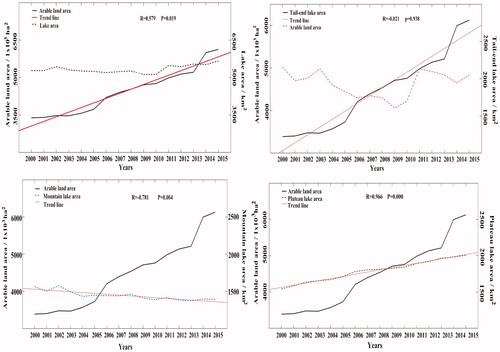
As shown in , the changes in the areas of the Tail-end-lakes are characterized by “fluctuations” during 2000–2017. The area fluctuation degree for the Tail-end lakes is: Ebinur Lake 1.09% > Manasi Lake 0.89% > Barkol Lake 0.59% > Wulungu Lake 0.25% > JiLi Lake 0.02% and the corresponding areas of change are: 370.85, 275.88, 70.28, 40.8, and 25.6 km2.
Figure 7. Changes in the areas of the Tail-end-lakes during 2000–2017.
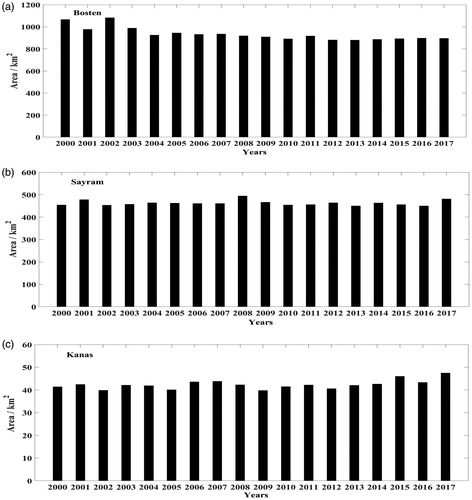
It can be seen from that there are no apparent fluctuations in the changes in the area of the mountain lakes; no increasing or decreasing trends are observed during 2000–2017; in general, the area is relatively stable in the mountain lakes. The average areas of Kanas Lake, Sayram Lake, and Bosten Lake are 43.19, 462.77, and 934.36 km2, respectively.
Figure 8. Changes in the areas of the Mountain lakes during 2000–2017.
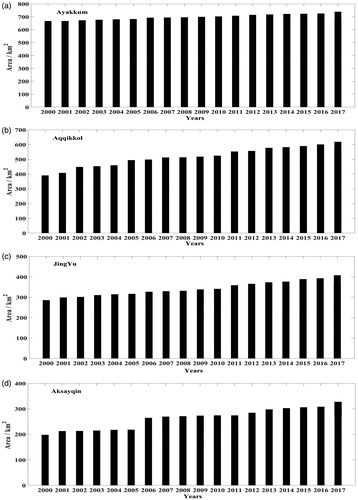
shows that the area of the Plateau lakes increased every year during 2000–2017. In 2000, the combined area of Aksayqin Lake, Ayakekumu Lake, Aqqikkol Lake, and Jingyu Lake was 1539.9 km2, reaching 2091.38 km2 by 2017. In the past 18 years, the area has increased by 551.48 km2. The largest increase was observed for Aqqikkol Lake, which expanded by 230.62 km2 with an average growth of 12.81 km2/a.
Figure 9. Changes in the areas of the Plateau lakes during 2000–2017.
5. Discussion
5.1. Interannual changes in the lake areas
The interannual changes in the lake area are the result of the interaction of various driving factors. In general, the factors that cause changes in the lake area include natural factors and social factors. The influence of the natural factors on lakes is more direct and comprehensive. Natural factors include precipitation and temperature. Social factors are mainly human activities.
1 ) Precipitation
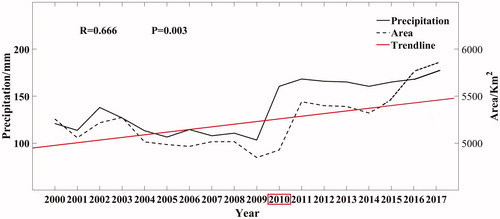
There are 58 national meteorological stations in the Xinjiang region. In this study, 22 meteorological stations are selected in each area of the lakes (the stations annotated in ) using the regional division of the lakes to analyze the relationship between the annual average precipitation and the lake areas. As shown in the lakes have undergone changes that include the initial expansion following by shrinking and then expansion during 2000–2017. The trends in the precipitation and changes in the lake area are almost identical and there is a significant correlation between the two parameters (r = 0.67, p = .003 < .01). This indicates that precipitation is the most direct, rapid and significant path of the replenishment of water in the lakes. In 2010, Northern Xinjiang experienced the strongest snowstorm in 60 years during the winter and heavy rain occurred in southern Xinjiang in July. The areas of the lakes also increased dramatically in 2010. This indicates that precipitation is the main factor affecting the changes in the lake areas.
Figure 10. Influence of precipitation on the lake area.
2 ) Temperature
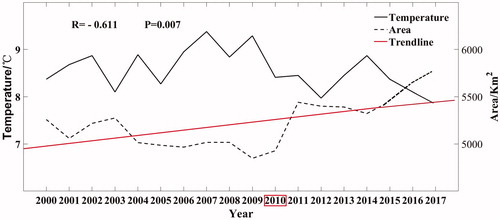
Changes in temperature directly affect the evaporation of lakes and the snow melt of glaciers. shows the relationship between the annual average temperature and the lake areas. There is a significant negative correlation between temperature and lake area (r = 0.611, p = .007 < .01). Xinjiang has abundant sunlight and heat resources and the daily temperature difference is large. These conditions result in strong evaporation of water from the lakes. The increase in temperature does not only increase the evaporation rate but also accelerates the melting of glaciers and snow (Chen et al. Citation2014) thus the lake areas increase. However, the results shown in indicate that the evaporation of the lake water caused by rising temperatures in Xinjiang is greater than the inflow of water from glacier snowmelt. Therefore, the evaporation of the lake water and the melting of the glaciers caused by temperature changes are natural factors that cause the change in the area of the lakes.
Figure 11. Influence of temperature on the lake areas.
3 ) Human activities
Human activities such as reclaiming farmland, transitional grazing, and unreasonable and uncontrolled use for irrigation can all affect the lake areas and affect the ecological conditions of the lake. The increase in agricultural land has the most significant impact on the lake area. The arable land area in Xinjiang experienced a slow increase followed by a slight decrease and continuous increase from 3388.76 × 103 ha2 in 2000 to 6126.06 × 103 ha2 in 2015. During 2000–2001, as the population increased the area of arable land has increased slowly. In 2002, due to the implementation of the “land responsibility system”some farmland with low fertility was abandoned and the area of cultivated land decreased slightly. In 2006, the state and local authorities encouraged individuals and collectives to reclaim land and the area of arable land increased rapidly. shows that there is a negative correlation (r = −.021, p = .004 < .01) between arable land area and Tail-end lakes area but there is no significant relationship between the arable area and the area of the Mountain and Plateau lakes. This is due to the uneven distribution of arable land in Xinjiang that occurs mainly in the plain areas. The increase in arable land increases the consumption of water and the large amount of water irrigated by the inflow into the lake will eventually affect the area of the lake.
Figure 12. Influence of the change in the arable land area on the lake area.
5.2. Spatial differences in the lake area changes
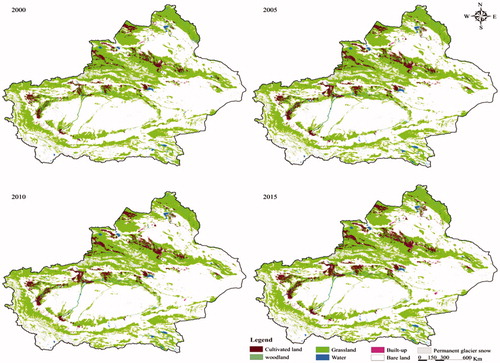
Land use/land cover change (LUCC) is an important aspect in global climate change and global environmental change research and the most direct form of interaction between humans and the natural environment (Mooney et al. Citation2013). In this study, the driving factor of the changes in the lake areas in Xinjiang is analyzed by assessing the LUCC changes during 2000–2015.
1 ) Reasons for the shrinking of the tail-end-Lakes
There is a close river-lake relationship for the Tail-end-lakes (Si et al. Citation2015). However, in Xinjiang, most of the water in the rivers is used which leaves little water to flow into the Tail-end lakes (Piao et al. Citation2010) and although there are a large number of rivers entering the lake, only one or two rivers flow continuously.
The area fluctuations of the Tail-end-lakes are not only related to the recharge of the river but are also largely influenced by human activities. The altitude of the Tail-end-lakes is suitable for agriculture and animal husbandry due to the abundant light and heat resource. shows that in the Tail-end-lakes area, much of the grasslands have been converted to arable land beginning in 2005. These areas are mainly distributed in the southeast of Wulungu Lake and JiLi Lake, northwest of Ebinur Lake, west of Barkol Lake and east of Manasi Lake. The expansion of the cultivated land has inevitably led to an increase in the water demand for irrigation. The river that enters Wulungu and JiLi Lake is the Wulungu River, which has dams in many places. The entering water of Wulungu- JiLi Lake has been closed in many places before flowing into the lake and the water is used for large-scale irrigation for agriculture. There are 23 rivers flowing into Ebinur Lake including Kuitun River, Four Trees River, Jinghe River, Alcain River, Dahe Yanzi River, Bortala River, the annual average flow rate of these rivers is 37.46 × 10⁸ m3, of which only 5.6 × 10⁸ m3 flows into Ebinur Lake and 85% is used for irrigation and the irrigated areas increase annually. Manasi Lake is affected by recharging rivers, human activities and floods. Manasi Lake is the terminal point of the Manasi River and the changes in the lake area depend on the change in the water volume of the Manasi River. In the 1950s, land reclamation and dam construction occurred in the upstream portion of the Manasi River resulting in lower water volumes and shrinking of the lake. By the beginning of the 1970s, Manasi Lake had completely dried up. In 1999, heavy rainstorms and floods occurred in the Manasi river basin and the Manasi River had abundant water. In addition, most of the farmland began to use drip irrigation, which greatly reduced the water consumption. As a result, Manasi Lake was partly restored but its area still fluctuated. At the beginning of the twenty-first century, floods occurred occasionally in the Manasi River basin and the water supply of Manasi Lake was abundant in 2011 and 2016. Manasi Lake had plenty of water for 2 or 3 years after the flood due to the large water supply. With the increase in the area of the oasis and arable land in the Manasi River basin, the consumption of water for agriculture and animal husbandry is also increasing. The lake area decreases every year and is less than 10 km2 at the lowest level. Today, Manasi Lake has evolved into an intermittent lake. The river supplying Barkol Lake originates from the northern slope of the Tianshan Mountains and flows into Barkol Lake through the Barkol grassland. The major land use/land cover types around Barkol Lake are grasslands, arable land and permanent glacial snow. The cultivated lands, which are increasing in area every year are mainly distributed along the Barkol Lake and Unity reservoir, which is 34 km southwest of Barkol Lake. The area of the permanent glacier snow has hardly changed and there is no change to the water supply of Barkol Lake. But at the same time, the water use for the cultivated land increases every year resulting in the unbalanced water state of Barkol Lake.
Figure 13. Xinjiang LUCC changes during 2000–2015.
2 ) Reasons for the stability of the Mountain Lakes
One of the significant features of Mountain lakes is the balanced water state. Kanas Lake is a glacial moraine lake with good water retention. The south end of the lake is close to the moraine hill and the ice water platform. The lake is narrow and glaciers and mountains occur along the lake, there are five glacier melting channels entering the lake and in addition to the melting water of the glaciers. Kanas Lake also receives inflow from precipitation and groundwater. The outflow from the South lake is through the Buerjin River and then through the Ertix River and Ob River and the water flows into the Arctic Ocean. Most of the land types around the lake are woodland, grassland, and permanent glacial snow. In addition, a small number of woodlands at the northwest of Kanas Lake were transformed into grassland in 2015. The lake is not much affected by the outside world and is located in a National Nature Reserve, therefore the lake area is relatively stable. There are 39 rivers flowing into Sayram Lake and many gutters around the lake and there is a constant flow of water in these gutters. The source of the lake recharge includes lake runoff, subsurface flows, spring water supply and lake surface precipitation. shows that Sayram Lake is located in an area of two major cultivated regions but because Sayram Lake has no surface outlet, the total amount of water entering the lake is 2.524 × 10⁸ m3 per year and the annual evaporation of the lake surface is 2.492 × 10⁸ m3 which results in a balanced water state. Bosten Lake is the largest inland freshwater lake in China and perennial rivers flow into the lake such as the Kaidu River, the total recharge of Bosten Lake by the Kaidu River is as high as 84% (Zhang et al. Citation2014). In addition, there is also groundwater inflow from the Uradai River, Yellow river ditch, Qingshui River and the Quhui ditch. The outlet is the Peacock River. Bosten Lake is also the main water source for industry, agriculture and humans living in the Yanqi basin and the recharge to Bosten Lake from precipitation and the Kaidu River (annual average of 14.34 × 10⁸ m3), the evaporation of the lake surface and the human control of the lake flow of Bosten Lake west stand pump into Peacock river (annual average of 13.96 × 10⁸ m3) balance the large amount of evaporation of the lake surface and the water used for human activities.
In addition, these three lakes are key national scenic spots. Through the efforts of the relevant departments over the years, the lakes’ water sources are guaranteed and the lakes’ water outlets and the human activities are also controlled. Overall, the lakes have maintained a balanced water state for years, although the area of the lakes fluctuates slightly, the overall fluctuation range is small and the lake areas are stable.
3 ) Reasons for the expansion of the Plateau Lakes
Most of the Plateau lakes are inland lakes and they are mainly distributed in the Altun Mountain, the west Kunlun Mountains, and the east Kunlun Mountains. These lakes are distributed in the transitional region of the alpine grassland and desert area where the snowline altitude is in the range 5500–5800 m and the changes in lakes are mainly influenced by the natural environment (Shi and Ren Citation1990). shows that the major land types in the Plateau lake regions are grassland, permanent glacier snow and unused land. The grassland area in the western Kunlun mountains area has increased every year during 2000–2015, whereas the permanent glacial snow land in the east Kunlun Mountains and the Altun mountain area has decreased every year. The recharge due to natural precipitation in the region is very limited in the Plateau lakes and the lakes are mainly recharged by rivers that are replenished by abundant glacial melting water (Wang et al. Citation2016). There is only one water source – the Aksayqin River, which flows into Aksayqin Lake. For additional water, Aksayqin Lake mainly depends on arched glaciers, multi-tower glaciers and spring glaciers west of the Kunlun glacier. Ayakekumu Lake mainly depends on glacier melt for the water supply and the rivers supplying the lake are the Yixieke Pati River and the Shaisikeya River. Jingyu Lake is mainly recharged by ice and snow and is fed by the Yu Lang River and the Spring River, the river supplying Aqqikkol Lake is the Aqqikkol River.
The Plateau lakes are steep and is relatively inaccessible. The harsh climate limits human activities. In addition, the lakes have stable and abundant river recharge and glacier snowmelt inflow. Therefore, the lake water has an abundant water supply. In addition, Aqqikkol Lake, Ayakekumu Lake, and Jingyu Lake are located in the National Nature Protection of Altun Mountain, the management regulates all activities around the lake area and the lakes are well-protected. Therefore, the lake area is increasing every year.
6. Conclusion
The environment is the weakest link when considering the population, the resources, and the environment in the Xinjiang area. The shrinking and even drying up of lakes results in a series of serious environmental problems, including droughts, increase in dust storms, soil salinization, salt-alkalization, vegetation degradation, land desertification, effects on the lake ecological functions, and loss in biodiversity. Environmental problems affect all aspects of socio-economic development in the form of negative feedback, forcing humans to spend large amounts of money to solve the problems caused by the shrinking of the lakes; these cycles hinder the development of Xinjiang in many areas. Under the background of this particular situation, in this study, we analyzed the trend and spatial-temporal characteristics of the changes in the lake areas of 12 lakes in Xinjiang over the past 18 years. The results of this study are of great significance to the rational utilization of water resources in Xinjiang.
In this study, MOD09A1 data were used for the period of 2000–2017 to study the interannual and regional characteristics of the lake areas. Based on the analysis of a long time series, it is found that:
The inter-annual change in the Xinjiang lakes is apparent. Overall, the lake area has shrunk every year during 2000–2009 but since 2010, the lake area has gradually expanded. The shrinking and expansion of the lakes are closely related to precipitation, temperature, terrain, and human activities.
The distribution of the lakes in Xinjiang is uneven and the expansion and shrinking reflect these regional differences. The Tail-end lakes area fluctuates greatly and the lakes are mostly shrinking. The Mountain lake area is stable and the lakes appear to be stable. The Plateau lake area is increasing every year and the causes of the changes in the lake area in the different regions are not the same. The Tail-end-lakes are affected the most by human activities (increasing area of cultivated land, deforestation in water conservation areas, badly planned water conservancy projects and oasis water use) and the conflict between the supply and demand of water resources and the decrease in vegetation cover has resulted in a large amount of water being removed from the lakes that cannot be replenished. This has led to strong fluctuations in the lake areas and the shrinkage of lakes. In the Mountain lake regions, natural factors completely offset the negative effects of human activities on lakes and the lakes have a balanced water state. The Plateau lakes receive a large amount of glacial recharge and are almost undisturbed by human activities; therefore the lake area expands every year. The main reasons for the changes in the lake areas are different in different regions but in general, the dynamic changes in the lake area are affected by both natural and human impacts and their interactions.
Acknowledgments
The case studies were financially supported by the National Natural Science Foundation of China (U1603241, 41661079, 41771470). The authors are grateful to the professionals of the collaborating institutions and the independent experts who all provided significant contributions during various parts of the studies.
Disclosure statement
No potential conflict of interest was reported by the authors.
Additional information
Funding
Related Research Data
References
- Asefa T, Kemblowski M, Lall U, et al. 2005. Support vector machines for nonlinear state space reconstruction: application to the Great Salt lake time series. Water Resour Res. 41(41):W12422.
- Baban SMJ. 1999. Use of remote sensing and geographical information systems in developing lake management strategies. Hydrobiologia. 395–396(7):211–226.
- Bai RD, Long-Hua HE, Jing-Lu WU. 2012. Analysis on recent change of water area of the main lakes in Xinjiang based on MODIS data. Arid Zone Res. 29(4):561–566.
- Brereton RG, Lloyd GR. 2010. Support vector machines for classification and regression. Analyst. 135(2):230.
- Chen Y, Zhi LI, Fan Y, et al. 2014. Research progress on the impact of climate change on water resources in the arid region of Northwest China. Acta Geogr Sin. 69(9):1295–1304.
- Cui H, Zhou X, Guo M, Wei W. 2016. Land use change and its effects on water quality in typical inland lake of arid area in China. J Environ Biol. 37(4):603–609.
- Dong Z, Lv P, Qian G, Xia X, Zhao Y, Mu G. 2012. Research progress in China's Lop Nur. Earth-Sci Rev. 111(1–2):142–153.
- Du J-K, Feng X-Z, Wang Z-L, Huang Y-S, Ramadan E. 2002. The methods of extracting water information from spot image. Chin Geograph Sci. 12(1):68–72.
- Gao H. 2011. The impact of human activities on the water-level changes of Bosten Lake. Int Conf Comput Distrib Control Intell Environ Monit. IEEE. 1879–1882.
- George G. 2010. The impact of climate change on European lakes. The Netherlands: Springer.
- Guirguis SK, Hassan HM, EL-Raey ME, Hussain MMA. 1996. Technical note multi-temporal change of lake Brullus, Egypt, from 1983 to 1991. Int J Remote Sens. 17(15):2915–2921.
- Hao H, Ferguson DK, Chang H, Li C-S. 2012. Vegetation and climate of the Lop Nur area, China, during the past 7 million years. Clim Change. 113(2):323–338.
- Harris AR, Mason IM. 1989. Lake area measurement using AVHRR: A case study. Int J Remote Sens. 10(4–5):885–895.
- He Q. 2003. Analysis on the change of the water area of Ebinur, Bosten, and Aydingkol lakes in Xinjiang, China, by remote sensing climatology. Proc SPIE. 276–284.
- Herlihy AT, Sobota JB, Mcdonnell TC, Sullivan TJ, Lehmann S, Tarquinio E. 2013. An a priori process for selecting candidate reference lakes for a national survey. Freshw Sci. 32(2):385–396.
- Huang P, Gu C, Huang P. 1987. Preliminary study about the impact of dry up of Manasi Lake on Vegetation. Arid Land Geogr. 10(4):30–36.
- Jeppesen E, Peder Jensen J, Søndergaard M, Lauridsen T, Landkildehus F. 2000. Trophic structure, species richness and biodiversity in Danish lakes: changes along a phosphorus gradient. Freshw Biol. 45(2):201–218.
- Jie B, Xi C, Li J, Liao Y. 2011. Changes of inland Lake Aroa in arid Central Asia during 1975–2007: a remote-sensing analysis. J. Lake Sci. 23(1):80–88.
- Kang S, Hong SY. 2016. Assessing seasonal and inter-annual variations of lake surface areas in Mongolia during 2000–2011 using minimum composite MODIS NDVI. Plos One. 11(3):e0151395.
- Li Q, Lu L, Wang C, Li Y, Sui Y, Guo H. 2015. MODIS-derived spatiotemporal changes of major lake surface areas in arid Xinjiang, China, 2000–2014. Water. 7(10):5731–5751.
- Liu Y, Li CZ, Liu ZH, Deng XY. 2016. Assessment of spatio-temporal variations in vegetation cover in Xinjiang from 1982 to 2013 based on GIMMS-NDVI. Acta Ecol Sin. 36(19):6198–6208.
- Liu R, Liu Y, Zheng Z, Huang Y. 2006. Quantitative detection of Bosten lake area using NOAA/AVHRR Data. J Appl Meteorol Sci. 17:100–106.
- Liu Z, Zhao J, Shi YF, et al. 2011. Analysis of the change of area and climate response of the main lakes in Xinjiang from 2000 to 2009 using MODIS data, .resources and environment. Arid Regions. 25(10):155–160.
- Lu S, Ouyang N, Wu B, Wei Y, Tesemma Z. 2013. Lake water volume calculation with time series remote-sensing Images. Int J Remote Sens. 34(22):7962–7973.
- Ma R, Duan H, Yang G, Jiang J. 2011. China's lakes at present: Number, area and spatial distribution. Sci China Earth Sci. 54(2):283–289.
- Ma M, Wang X, Veroustraete F, Dong L. 2007. Change in area of Ebinur lake during the 1998–2005 period. Int J Remote Sens. 28(24):5523–5533.
- Mcfeeters SK. 1996. The use of the Normalized Difference Water Index (NDWI) in the delineation of open water features. Int J Remote Sens. 17(7):1425–1432.
- Meyers PA, Ishiwatari R. 1993. Lacustrine organic geochemistry—an overview of indicators of organic matter sources and diagenesis in lake sediments. Org Geochem. 20(7):867–900.
- Mooney HA, Duraiappah A, Larigauderie A. 2013. Evolution of natural and social science interactions in global change research programs. Proc Natl Acad Sci U S A. 110(Supplement_1):3665.
- Moradi A, Metivier L, de Viron O, Calmant S, Mering C. 2014. Evaluation of MODIS data for improved monitoring of the Caspian Sea. Int J Remote Sens. 35(16):6060–6075.
- Nguyen DD. 2012. Water body extraction from multi spectral image by spectral pattern analysis. Int Arch Photogramm Remote Sens Spatial Inf Sci. XXXIX-B8:181–186.
- Piao S, Ciais P, Huang Y, Shen Z, Peng S, Li J, Zhou L, Liu H, Ma Y, Ding Y, et al. 2010. The impacts of climate change on water resources and agriculture in China. Nature. 467(7311):43.
- Shi Y, Ren J. 1990. Glacier recession and lake shrinkage indicating a climatic warming and drying trend in Central Asia. Acta Geogr Sin. 14:261–265.
- Si J, Feng Q, Yu T, Zhao C. 2015. Inland river terminal lake preservation: determining basin scale and the ecological water requirement. Environ Earth Sci. 73(7):3327–3334.
- Sujay RN, Deka PC. 2014. Support vector machine applications in the field of hydrology: A review. Appl Soft Comput J. 19(6):372–386.
- Wang SM. 1998. China lake Chi. Science Press. 129–143.
- Wang X, Liu Q, Liu S, et al. 2016. Heterogeneity of glacial lake expansion and its contrasting signals with climate change in Tarim Basin, Central Asia. Environ Earth Sci. 75(8):696.
- Wetzel RG. 2001. Lake and river ecosystems. Nature. 21(4):1–9.
- Wong CP, Jiang B, Bohn TJ, Lee KN, Lettenmaier DP, Ma D, et al. 2017. Lake and wetland ecosystem services measuring water storage and local climate regulation. Water Resour Res. 53(4):3197–3223.
- Wu S, Zhou B, Pan Y, et al. 2017. Change detection of lakes in Arid Central Asia base on Landsat images in recent 25 years. J Hangzhou Normal Univ. 2:237–332.
- Xu H.-Q. 2005. A study on information extraction of water body with the modified normalized difference water index (MNDWI). J Remote Sens. 9(5):589–595.
- Yao T, Chen F, Cui P, Ma Y, Xu B, Zhu L, Zhang F, Wang W, Ai L, Yang X. 2017. From Tibetan plateau to third pole and pan-third pole. Bull Chin Acad Sci. 32(09):924–931.
- Zeng L, Schmitt M, Li L, Zhu XX. 2017. Analysing changes of the Poyang lake water area using Sentinel-1 synthetic aperture radar imagery. Int J Remote Sens. 38(23):7041–7069.
- Zhang F, Tiyip T, Johnson VC. 2015. The influence of natural and human factors in the shrinking of the Ebinur Lake, Xinjiang, China, during the 1972–2013 period. Environ Monit Assess. 187(1):4128.
- Zhang Z, Hu H, Tian F, Yao X, Sivapalan M. 2014. Groundwater dynamics under water saving irrigation and implications for sustainable water management in an Tarim River Basin of Western China. Hydrol Earth Syst Sci. 18(10):3951–3967.
- Zhang Z, Liu Y-H. 2011. Study on extraction of water bodies based on TM imagery. Ground Water. 2:360–372.
- Zhao M, Ren J, Ji L, Fu C, Li J, Zhou M. 2012. Parameter selection of support vector machines and genetic algorithm based on change area search. Neural Comput Appl. 21(1):1–8.
- Zhao R, Chen Y, Shi P, Zhang L, Pan J, Zhao H. 2013. Land use and land cover change and driving mechanism in the arid inland river basin: a case study of Tarim River, Xinjiang, China. Environ Earth Sci. 68(2):591–604.