
 ?Mathematical formulae have been encoded as MathML and are displayed in this HTML version using MathJax in order to improve their display. Uncheck the box to turn MathJax off. This feature requires Javascript. Click on a formula to zoom.
Abstract
The continuous increase in damages to flood disasters globally has informed the need to assess vulnerability of built-up exposures for future flood risk reduction. The aim of this paper is to understand the contributions of some important variables in flood damage processes and develop loss functions for global building types, for the estimation of flood economic damages in Chao Phraya river basin, Thailand. We obtained empirical damage data (118 samples) through questionnaire survey in the study area for analysis. Using multiple linear regressions analysis, we generated loss functions for the aggregated residential building incorporating multiple damage factors. Further, disaggregated vulnerability curves (as a function of water depth) were established using logarithm function for three global building types in the study area. Results showed that, under flood condition in the study area, water depths and building age are very important damage factors, other variables are also emphasized. The loss models show maximum predicted vulnerability indices of 0.36, 0.30 and 0.10 for wooden, concrete frame and unreinforced masonry, and reinforced concrete moment frame, respectively. These functions can be used for modeling flood damage, for future disaster risk reduction and for risk comparison across countries.
1. Introduction
Despite the reduction in the global mortality risk as the efforts to reduce risk to natural hazards continues, economic risk in all the regions of the world is increasing due to the urban and infrastructural developments (Godfrey et al. Citation2015; Murao and Nakazato Citation2010). Among all the natural occurring hazards in the world, flood hazards are one of the most devastating with the highest economic damages, which has been on the increase in the last three decades. Although it is a common phenomenon to all the regions of the world, the South East Asia does have one of the highest shares of floods because of their geographical location within the flood plains of large rivers. The increasing urbanization and economic growths of many of the cities in this region have resulted in their increased exposure and vulnerability to the impact of flood hazards (Dutta and Kamrujjaman Serker Citation2005). One of such cities is Bangkok, Thailand that is situated in the downstream of the Chao Phraya River basin. This basin has been previously affected by floods, which resulted in huge damages with great impact on the country (Chia et al. Citation2015) (). 2011 flood event in Thailand was the worst ever in many years (Aon Citation2012; Gale and Saunders Citation2013; Guy Carpenter Citation2012; Haraguchi and Lall Citation2015). The floods that started on the 5th August, 2011 lasted till 9th January, 2012 (Gale and Saunders Citation2013). Four major causes of the unprecedented flood event according to Haraguchi and Lall (Citation2015) are: (1) heavy rainfall resulting from ‘La Nina’ event which caused most reservoirs in the upstream to exceed their storage capacity (Gale and Saunders Citation2013); (2) topology or geomorphological characteristics of the region; and (3) the landuse, mostly located in the floodplains where natural water-ways are replaced with urban structures. The fourth factor was the lack of adequate water management in the region. Haraguchi and Lall (Citation2015) analyzed the flood impacts of this event on industries and supply chain using empirical approach. Apart from the effect on industries, most significant impact of the floods was losses to residential contents (Chia et al. Citation2015). According to the Thailand Ministry of Finance (Citation2012) cited by Chia et al. (Citation2015), the recent 2011 flood resulted into a sum total damage of about USD 46.5 billion; a significant flood damage when compared with the country’s Gross Domestic Product (GDP). Report by Aon (Citation2012) confirmed that about 1.5 million homes and other structures were affected throughout the duration of the floods. Nearly four million total structures estimated to have sustained effects. In Bangkok metropolitan alone, 300,000 homes were also damaged. The incurred damages are mostly attributed to the residential contents and to some extent the buildings and infrastructures. Hence, the importance of the analysis of urban structural vulnerability to flood hazards in the study area, for future flood risk management plans and policies.
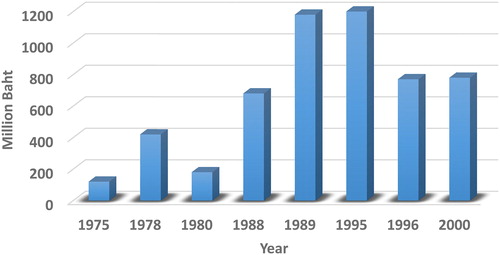
Figure 1. Total direct tangible flood damage in Thailand during 1975–2000 (Dutta et al. Citation2005).
The possibilities of future flood damages and the influence of climate change on most river systems have necessitated the need for proactive flood disaster risk reduction measures. One of the most recent non-structural measures in addressing the impacts of flood is the flood risk management, with emphasis on the flood economic risk assessment. This is important because most of the decisions and policies to reduce future impacts now are based on cost-benefit analysis. Estimation of flood economic impacts however requires adequate understanding of the vulnerability of the elements at risk (the exposures). Vulnerability, which is also defined as the degree of loss sustained by a particular elements, is exposed to risk due to natural phenomenon (flood hazard) of certain intensity (Su et al. Citation2005). Most flood economic impacts make use of vulnerability function (also known as loss or stage-damage function) to express the degree of susceptibility of exposures to flood characteristics.
Methodologies for flood damage estimation for different flood damage categories vary from country to country. Flood damages are classified as: the tangible and intangible damages. The tangible damages are further divided into two: direct and indirect damages. The direct damages are flood damages caused by direct or physical contact with the floodwater (e.g. physical damages and loss of life) while the indirect damages are not directly connected to the floodwater (e.g. trauma and loss of production and income) (Jongman et al. Citation2012). Damage and loss functions have been developed for various categories of tangible properties such as residential, commercial, and agricultural crops (Dutta and Herath Citation2001; Dutta et al. Citation2003; Herath et al. Citation1999; Kreibich et al. Citation2005). Two basic approaches are very common in the estimation of flood damages: (1) the use of a detailed questionnaire survey of the affected people and properties and (2) the use of stage-damage or loss functions. The former is mostly done after a particular flood event to assess the incurred losses; this often makes use of flood survey, which sometime can be extremely difficult task, laborious and time consuming. The latter however makes use of the established loss functions for rapid estimation of incurred and potential losses to flood (Herath et al. Citation1999).
Loss function forms a focal point in flood damage modelling. It explains the relationship between flood damage states of the exposed objects and flood inundation characteristics (Dutta et al. Citation2003; Herath et al. Citation1999; Herath and Wang Citation2009; Su et al. Citation2005; Tapia-Silva et al. Citation2011). The function explains how susceptible the element at risk (exposure) is to the flood hazards. Generally, loss functions are developed based on the influence of the inundation depths. Other rarely used flood characteristics are flow velocity, sediments load, warning time and awareness, winds and duration of inundation (Dutta and Herath Citation2001; Herath et al. Citation1999; Herath and Wang Citation2009). These factors are often neglected in damage modelling due to their heterogeinities both in space and time and as such, difficult to predict, hence the frequent use of floodwater depths (Komolafe et al. Citation2018; Merz et al. Citation2010).
Generally, most researches make use of floodwater depth as a major factor responsible for losses, but in reality, it is well known that flood losses are dependent on many other variables such as flow velocity, flood duration, sediment concentration, lead-time, warning systems, flood experience, building structures and quality, etc. (Chinh et al. Citation2015). In the study area, however, detailed multi-variate analysis of structural flood loss data has not been carried out. In view of this, this study intend to understand contributions of some flood damage factors other than the usual water depths using multiple regression analysis. Most important however is the analyses and development of detailed loss functions for global residential buildings types in Chao Phraya River basin, Thailand. Most of the existing loss models globally and in the study area are aggregated and does not reflect the detailed components of different structural response to floodwater, and cannot be readily transfered to other countries for cross country risk comparison. In order to do this, a more detailed loss functions would be required. Existing models developed by the United Nations International Strategies for Disaster Risk Reduction (UNISDR) are based on synthetic (experts’ knowledge) approach due to the lack of empirical data from country to country (Masqsood et al. Citation2013). Although both approaches have their advantages and disadvantages, a greater accuracy can be achieved using empirical approach (Merz et al. Citation2010); hence, the use of empirical approach is adopted in this study through questionnaire survey. Detailed vulnerability functions are necessary to differentiate potential economic risk to different building types and assess susceptibility of building structures to floodwater for building code design, policies and flood disaster risk reduction plans. Also, in order to compare risk regionally and for regional risk assessment, such detailed vulnerability would be very essential.
2. Study area
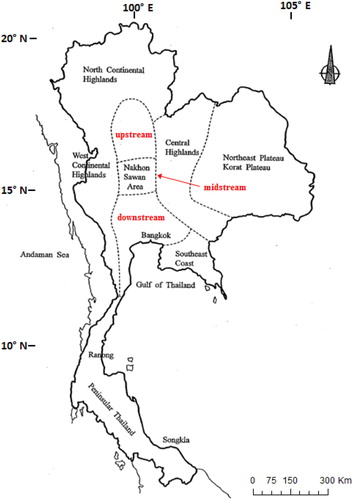
The study area is in downstream part of Chao Phraya river basin. The basin covers approximately 160,000 km2 about 30% of Thailand land, home to 40% of the country's population, employs 78% of its work force, and generates 66% of its Gross Domestic Product (GDP) (Office of the National Water Resources Committee (ONWRC) Citation2006) (). The upper and the middle of the basin consist of agricultural land, forest and bare soil, while the lower basin is mostly urban and agricultural areas. The climate is tropical monsoon; it runs from May to October, within which about 90% of the annual rainfall occurs (Chia et al. Citation2015). Average annual precipitation ranges from 1000 mm in the western part to 2000 mm in the eastern part. The average runoff varies from 250 mm in the sub-basin (above Bhumiboi) to 450 mm above Sirikit reservoir. Chao Pharaya basin is prone to annual flooding, which is attributed to the decline of flood retention areas and the confinement of flood plains due to development, urbanization and intense agriculture (Office of the National Water Resources Committee (ONWRC) Citation2006).
Figure 2. Chao Phraya River Basin, Thailand (CTI, Citation1999).
Major field activities were done in Pathum Thani and Phra Nakhon Si Ayutthaya, the central provinces of Thailand within the Basin. Pathum Thani is situated in north of Bangkok and forms part of the Bangkok metropolitan area in the fertile Chao Phraya River basin with many canals and tangerine orchards, which was originally named Sam Khok (Tourism Authority of Thailand, Citation2010). It lies on the low alluvial flats of the Chao Phraya River. Similarly, Phra Nakhon Si Ayutthaya, which is also one the central provinces with area coverage of 2,556 square kilometers on the flat river plain of the Chao Phraya river valley. Due to their location within floodplain of the basin, they are often prone to flooding.
3. Methodology
3.1. Questionnaire survey
In order to establish vulnerability functions for rapid estimation of flood damages in the river basin, a detailed questionnaire survey was designed to gather data on recent impacts of flood on urban residential buildings in the study area. Flood damage survey was carried out on the 15th of October, 2015 in Pathum Thani and Phra Nakhon Si Ayutthaya, the central provinces of Thailand within Chao Phraya River Basin (). Damage survey was done with the aim of establishing relationships between flood damages and the potential damages parameters, and the construction of stage-damage curves (loss functions) for global residential building types. The questionnaire captured the economic impact of floods, flood parameters (water depths and duration), exposure characteristics (floor area, plinth heights and building heights) and external flood disaster prevention factors (flood experiences). shows the structures of the questionnaire as required for the field survey. The questionnaires were divided into three (3) sections: (1) the Interviewee Information, (2) the exposure (building) characteristics, and (3) the memories of past flood events, with information on incurred damages and losses to building structures.
Figure 3. Survey Locations.
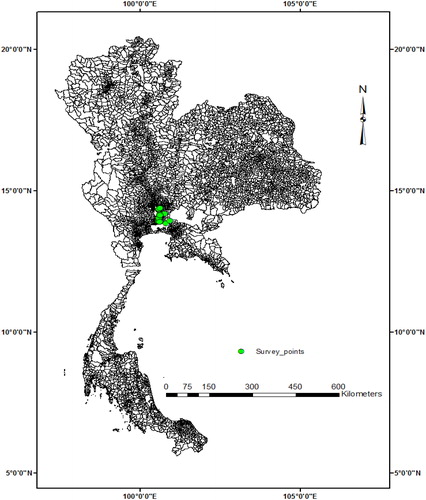
Table 1. Sample questionnaires used for the flood damage survey.
Prior to the field survey, building classification was based on the global building structural classification by the World Agency of Planetary Monitoring and Earthquake Risk Reduction (WAPMERR), adopted by the United Nations Office of Disaster risk Reduction (UNISDR) (Masqsood et al., Citation2013) ().
3.2. Data processing and loss functions development
A total of 120 residential houses were surveyed with three global building structural types identified. Identified building structures and their corresponding numbers surveyed are: (1) Concrete frame with unreinforced masonry infill (77), (2) Reinforced concrete moment frame (39), and (2) Wood (4) (). The economic losses to the structures with their corresponding water depths were measured and recorded.
Figure 4. No of surveys according to the global building types.
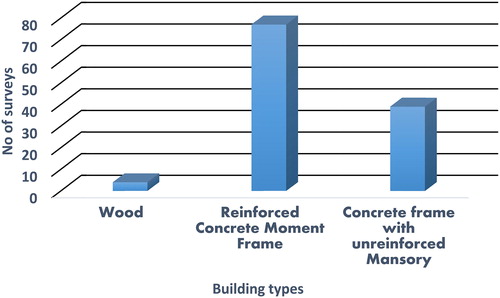
Figure 5. Scatter plots and best fitted linear multi-regression line for residential structural damages (case 1).
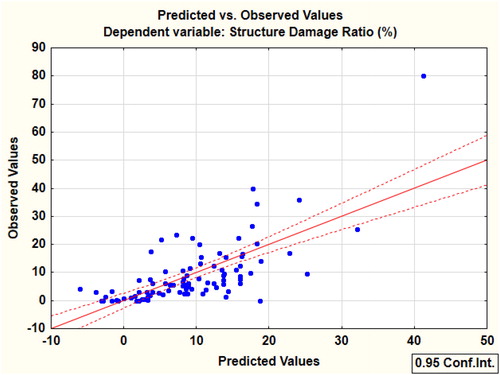
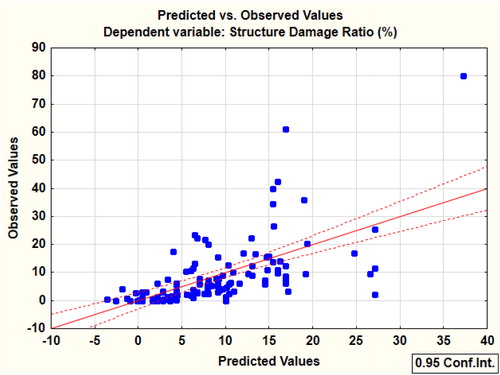
Figure 6. Scatter plots and best fitted linear multi-regression line for residential structural damages (case 2).
3.2.1. Statistical analysis
In this study, loss functions were generated in two ways: (1) the use of Multiple Linear Regression analysis to incorporate all the sampled flood damage parameters. In this case, aggregated residential building was used, (2) establishment of stage-damage (Loss) curves using floodwater depth as a major damage factor for disaggregated global residential building types. Loss functions for the aggregated residential building structure were obtained from empirical data gathered from field survey, with the incorporation of various flood damage factors. In addition to the water depths, flood duration, building age, flood experiences, building floor area and building heights are included in the loss function development using multiple linear regression analysis.
In order to create the loss functions, the replacement values of the building types would be needed. Damage to the structures were calculated based on damage ratio, which is the ratio of the repair cost of the structure after the flood event to the replacement (actual) cost of the structure, as expressed in the.
(1)
(1)
The repair and replacement costs of the structures were obtained from the response of the people. Repair cost is a measure that was used to quantify the total amount of the damages experienced during the flood. The replacement cost is the amount of the erecting the building structures. The cost obtained from the field survey was complemented with building cost and their depreciation values from the Thai Appraisal foundation.
The initial loss function created in this study is basically for the aggregated residential structure using all possible damage factors, depending on their significant contribution to flood damages using multiple linear regressions. Multiple regressions help to predict the unknown value of a variable from the known values of one or more variables (predictors). In this case, a set of independent variables is used to explain a proportion of variance in a dependent or predicted variable. Multiple regression equation of on
,
….
is defined in EquationEquation 2
(2)
(2) as:
(2)
(2)
Where o is the intercepts and
are the regression coefficients, also known as the slopes.
The damage stage or ratio of the building structures served as the dependent variable while other flood damage factors such as: the water depths, floor area, water duration, flood experience, building age, number of stories are independent (predictors) variables. Before the regression analysis, correlation analysis was done to understand the relationship between the structural damage ratio and all the damage factors.
3.2.2. Loss curves development for global building types
Loss curves define a relationship between the damage states (damage ratio) of a structure and flood characteristics. Loss curves were developed for the 3 identified global building types in the study area using water depths as the major damage factor. The total data were sub-divided into three corresponding to the global building types (i.e. concrete frame with unreinforced masonry infill, reinforced concrete moment frame and wood) and analyzed separately by plotting the structural damage ratio against the floodwater depths. The relationship was predicted with logarithm function as in EquationEquation 3(3)
(3) .
(3)
(3)
Where Df is the damage function, is the floodwater depth (m) and C and C1 are the damage coefficients at any given landuse type.
4. Results and discussion
4.1. Descriptive statistics
shows the descriptive statistics of the acquired variables. The flood depths as obtained from the people’s experience of previous flood in the study area ranges from 0.1 to 4 m. The maximum water depths of 4 m are closed to the height of the first floor, an indication of severity of the 2011 flood event in the study area. The building age ranges between 1 and 70 years, with an average of 23.5 years. The average age shows that most of the structures are relatively old. Some people in the study area according to the survey had flood experiences up to 5 times; an indication that the study area in prone to flooding. Flood duration as experienced by the respondents is between 1 and 3 months. According to Guy Carpenter (Citation2012) and Gale and Saunders (Citation2013), 2011 flood lasted for about 158 days August and January, 2011. The average damages incurred during the flood events was about 62,372.7 Baht.
Table 2. Descriptive Statistics of the variables.
4.2. Correlation analyses of the variables
As stated earlier, the general loss function is generated for aggregated residential building incorporating all the selected damage factors. Correlation analysis was carried out using Pearson product-moment to determine (based on the acquired data) which of the damage factors can be incorporated into the multiple regression analysis for the establishment of loss functions. shows the correlation matrix for all the selected variables. The relationship shows that flood duration, floodwater height, flood duration, age of the building and floor area are significantly correlated (at p < 0.05) with structure damage ratio, whereas the building heights show no significance (at p > 0.05). The building height was not included for further analysis. From the correlation analysis, building age, flood experiences, floodwater depths and duration shows positive correlation whereas, building floor area is negatively correlated. Water depths showed high positive correlation with structural damage ratio (0.54), followed by building age (0.37), flood experience (0.32) and water duration (0.26), while the building floor area showed significantly negative correlation at −0.18. Unexpectedly, flood experience showed positive correlation with the damage ratio, which by implication means that past flood experience in the study area does not prevent damages to structures, but rather increases it. In support of this result however, it should be noted that the damage category in consideration is building structures, which remains unmovable during flooding unlike the building contents; meaning that knowledge about the past floods may not reduce the impacts of flood on the residential structures, but would definitely reduce the content damage. Five significantly correlated variables (floodwater depths, flood duration, floor area, and building age and flood experiences) were incorporated for multiple regression analysis.
Table 3. Correlation matrix for the selected damage factors.
4.3. Multiple regression analysis
In , multiple regressions show the regression coefficients for possible prediction for flood damages for residential structure in the study area and their level of contributions. The significance level of each predictor is defined by their t and p values in the regression table. Contributions of age of the building and water depths are the most significant factors in the line regression with p values <0.05 and higher t values. The prediction has a multiple R of 0.64 and adjusted R2 of 0.37 (). The model can be predicted as follows:
(4)
(4)
Where:
Table 4. Multiple regression analysis of the significantly correlated variables (Case 1).
= the regression standard predicted damage (structural damage ratio (%))
Flood duration shows low contribution to the structural damage process in this model. Effect of flood duration likely depend on the types of building structures and may not be much compared to residential contents and agricultural products. Flood experience is closed to being significant at p value of 0.05. Further prediction was done by eliminating the non-significant predictors (e.g. building floor area, experiences of flood and flood duration). Here, only water depths and age of the building were considered (). In , loss function for structural damage can be predicted as follows:
(5)
(5)
Table 5. Multiple regression analysis of the significantly correlated variables (Case 2).
Where,
= The regression standard predicted structural damage ratio (%))
Age of building (years)
Floodwater heights (m2)
The prediction is achieved at multiple R of 0.60 and adjusted R2 of 0.35 ().
Loss functions derived in EquationEquations 4(4)
(4) and Equation5
(5)
(5) can be utilized for estimating the structural building structural damage ratio given the predictors stated in the regression. But, considering the level of the significance of some of the predictors in EquationEquation 4
(4)
(4) , EquationEquation 5
(5)
(5) , which defines the residential structural damage as a function of building age and floodwater heights will be more appropriate. By estimating the damage ratio and knowing the replacement cost, the expected damage to residential building can be obtained. This can be of a very important tool in reconstruction as well as disaster risk reduction planning, reinsurance after and before flood disaster.
4.4. Loss curves for global exposures
shows the three loss curves for the identified global building types in the study area. As explained earlier, the scatter point data were predicted with logarithm function, which can be utilized for damage prediction for each damage categories under different flood hazards conditions. As expected, wooden structure shows a higher maximum predicted damage ratio (36%) followed by concrete frame and unreinforced masonry (CFURM) (30%), and reinforced concrete moment frame (10%). The flood damage coefficients for each category as predicted by the logarithm function (Equation 3) are listed in . The adjusted R2 for each structural damage model is 0.56, 0.25 0.18 for wood, concrete frame and unreinforced masonry (CFURM) and reinforced concrete moment frame respectively.
Figure 7. Derived loss curves for global building types from the field survey.
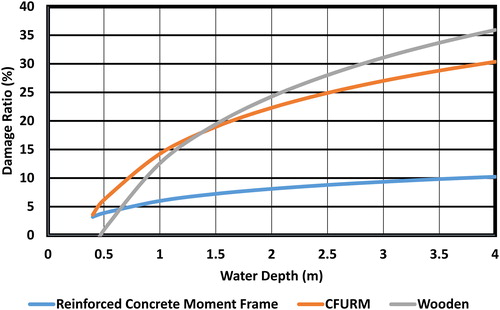
Table 6. Flood damage (vulnerability) model coefficients for the three global building types.
From the analyses, it is clear that all the factors except the building heights are well correlated with the structural damage ratio, and hence were initially used for predicting the residential structural damages (EquationEquation 4(4)
(4) ). However, due to the insignificance of some factors in the multiple regressions, further analysis was done by eliminating the non-consequential factors. The most significant damage factors as analyzed in this study are the floodwater depths and the building age (EquationEquation 5
(5)
(5) ); both factors showed positive correlation with the structural damage ratio. The implication of this is that the higher the two factors the more the structural damages, which means that the older the building structures the more vulnerable they are to flood, and as such would result into more damages; also, the higher the floodwater depths, the higher the expected flood damages. The older buildings must have been constructed without considering some flood resistant structural elements, which can withstand the various forces and actions during flood situations, especially those within the flood plains. Other neglected factors such as floor areas, water duration and flood experience are very important, they can either increase or reduce flood damages at any given flood event. Their significance, which is revealed in the initial correlation analysis in , could not contribute significantly to damages when incorporated in to multiple regression analysis. The reason for this could be the lack of enough sample data (only 118 samples used) for the analysis. This study has confirmed the important contribution of various factors other than the usual flood characteristics (e.g. water depths and duration) frequently used in the literatures in estimation of flood damage to building fabrics. It is clear from the study that factors such as the building characteristics (floor area and building age) and flood experiences can determine the damage extents of any building structures at any given flood scenarios. Due to the insignificant influence of some factors on flood damage in this study, it will be appropriate to make use of the EquationEquation 5
(5)
(5) , which expresses flood damages as a function of age and floodwater depths.
Loss curves developed for the global residential structure types in the study area was done for analysis of flood damage to detailed element at risk, easy transfer to other countries for risk comparison and possibility of regional risk modeling. Three vulnerability models (stage-damage curves) for global building types based on the relationship between degree of loss and the floodwater depths (). Maximum vulnerability indices predicted for wooden, concrete frame and unreinforced masonry, and reinforced concrete moment frame are 0.36, 0.30 and 0. 10 respectively. The wooden structure showed higher vulnerability as expected, but might be higher if representative samples were gathered in that category. Out of the 118 samples obtained in the field, only four points were used for the vulnerability prediction. The models can be improved and updated in the future by acquiring more empirical field data and re-calculating the vulnerability index. However, these detailed building vulnerability indices are very essential in planning and policy making for reduction in future flood risk, and can assist in landuse planning, especially in the building code design and regulations. Also, loss models will be very useful as tools to improve insurance systems in the each country as it helps to differentiate degree of risk to various structures.
5. Conclusion
This study has developed detailed flood loss models for global building types in Chao Phraya river basin, Thailand. Also, loss models generated a function of flood, building and human factors, based on past experiences of flood in the study area. The study emphasizes the importance and the contributions of other flood damage factors such as the building floor area, past experiences of flood, water duration and building age in flood damage processes. It shows, in agreement with existing facts, that using floodwater depths as the only damage factor in flood damage modelling will not be appropriate, but incorporating other important factors such as the flood characteristics (duration, velocity, contamination wind etc.), building characteristic, flood experiences, emergency and precaution measures in flood damage modelling would enhance understanding of their contributions to the flood damages, which can assist all stakeholders both at national and regional level in holistic solution to mitigating and adapting to the potential extreme events.
Limitations of this study are the limited field data, lack of observed damage data for validation and spatial data for hydrological simulation and flood damage modeling. Apart from these, inadequate information from the respondents during interviews is a great challenging factor. Sometimes, the difference between the recent floods and the interview dates might be large and the people may not be able to remember exactly how much damages they incurred during the flood and the floodwater depths. Some respondents, due to their inability to repair damages to their walls after the flood assumed there was no damages recorded. However, these functions can serve as measures for future flood disaster risk reduction planning in the study area. The disaggregated loss functions for global building exposures can serve as metrics for comparing risk across countries and inputs to regional risk models. Transferability of the functions to another country or region can be made possible by applying to similar global building structural types and normalized by the floor area and the prevailing country cost price. With the help of Geographic Information System (GIS), the established loss models can be dynamically linked spatially to estimated present and potential future flood damages for large floodplains. This can be done by estimating the potential spatially distributed flood depths under different flood frequency scenarios through hydrological simulation, mapping the spatial distribution of the exposure and densities within the floodplain using field-based GIS mapping or remote sensing data analysis, and estimating the cost of the exposures and their floor areas.
The main idea of this study is to simplify vulnerability functions to detailed elements at risk considering the degrees of loss of building structures to river floodwater. The use of global building types was informed by the need to compare risk and the regional risk modeling. These functions would enable detailed assessment of buildings’ degree of loss in the study area and can be used as tools for making decision for disaster risk reduction and management.
Acknowledgements
This work is part of Asian Pacific Network (APN) for Global Change Research projects on pre–flood disaster loss estimation. The Authors appreciate the concerted efforts of the Asia Institute of Technology, for their active involvement in damage data acquisition. Thanks to the Japan Foundation for United Nations University (JFUNU) for awarding scholarship for this research.
Disclosure statement
No potential conflict of interest was reported by the authors.
Related Research Data
References
- Aon B. 2012. 2011 Thailand Floods Event Recap Report: Impact Forecasting. http://thoughtleadership.aonbenfield.com/Documents/20120314_impact_forecasting_thailand_flood_event_recap.pdf
- Chia CT, Yasuhiro M, Hiroaki I. 2015. Simulation of modeling approach for flood condition and proposed flood protection at midstream of Chao Phraya River Basin, Thailand. ENV. 3(3):84–94.
- Chinh D, Gain A, Dung N, Haase D, Kreibich H. 2015. Multi-variate analyses of flood loss in can Tho City, Mekong Delta. Water. 8(1):6.
- CTI Engineering International CO., LTD, INA Corporation. 1999. The Study on Integrated Plan for Flood Mitigation in Chao Phraya River Basin, 2.1–2.2, 2.7–2.11.
- Dutta D, Chaleeraktrakoon C, Budhakoocharoen S. 2005. Research initiatives in Thailand on predictions in ungauged basins, In Proceedings Predictions in Ungauged Basins: Promise and Progress: Symposium S7 of IAHS Scientific Assembly, Brazil, 2006. Volume 303, IAHS.
- Dutta D, Herath S. 2001. GIS Based Flood Loss Estimation Modeling in Japan. In Proceedings Proceedings of the US-Japan 1st Workshop on Comparative Study on Urban Disaster Management, Port Island, Kobe, Japan, February 2001.
- Dutta D, Herath S, Musiake K. 2003. A mathematical model for flood loss estimation. J Hydrol. 277(1–2):24–49.
- Dutta D, Kamrujjaman Serker NHM. 2005. Urban building inventory development using very high resolution remote sensing data for urban risk analysis. Int J Geoinform. 1(1):109–116.
- Gale EL, Saunders MA. 2013. The 2011 Thailand flood: Climate causes and return periods. Weather. 68(9):233–237.
- Godfrey A, Ciurean RL, van Westen CJ, Kingma NC, Glade T. 2015. Assessing vulnerability of buildings to hydro-meteorological hazards using an expert based approach – An application in Nehoiu Valley, Romania. Int J Disaster Risk Reduction. 13:229–241.
- Guy Carpenter. 2012. Thailand Flood 2011: One Year Retrospective, Thailand. http://www.guycarp.com/content/dam/guycarp/en/documents/dynamic-content/Thailand%20Floodj%202011_One%20Year%20Retrospective.pdf
- Haraguchi M, Lall U. 2015. Flood risks and impacts: A case study of Thailand’s floods in 2011 and research questions for supply chain decision making. Int J Disaster Risk Reduct. 14:256–272.
- Herath S, Dutta D, Musiake K. 1999. Flood damage estimation of an urban catchment using remote sensing and GIS. Proceedings International Conference on Urban Storm Drainage. 4:2177–2185.
- Herath S, Wang Y. 2009. Incorporating wind damage in potential flood loss estimation: Global environmental research. p. 151–159.
- Jongman B, Kreibich H, Apel H, Barredo JI, Bates PD, Feyen L, Gericke A, Neal J, Aerts JCJH, Ward PJ. 2012. Comparative flood damage model assessment: Towards a European approach. Nat. Hazards Earth Syst. Sci. 12:3733–3752.
- Komolafe AA, Herath S, Avtar R. 2018. Sensitivity of flood damage estimation to spatial resolution. J Flood Risk Manage. 11:S370–S381. doi: 10.1111/jfr3.12224
- Kreibich H, Thieken AH, Petrow T, Muller M, Merz B. 2005. Flood loss reduction of private households due to building precautionary measures – lessons learned from the Elbe flood in August 2002. Nat Hazards Earth Syst Sci. 5(1):117–126.
- Masqsood T, Wehner MHR, Edwards M, Dale K, Miller V. 2013. GAR 15 Regional Vulnerability Functions: Reporting on the UNISDR/GA SE Asian Regional Workhop on Structural Vulnerability Models for GAR Global Risk Assessment, 11–14 November: Canberra, Australia: Geoscience Australia.
- Merz B, Kreibich H, Schwarze R, Thieken AH. 2010. Assessment of economic flood damage. Nat Hazards Earth Syst Sci. 10(8):1697–1724.
- Murao O, Nakazato H. Vulnerability functions for buildings based on damage survey data in Sri Lanka after the 2004 Indian Ocean Tsunami. Proceedings International Conference on Sustainable Built Enviroment (ICSBE), Kandy, 2010.
- Office of the National Water Resources Committee (ONWRC). 2006. Chao Phraya River Basin, Thailand: World Water Development Report (WWDR). http://www.un.org/esa/sustdev/publications/WWDR_english_129556e.pdf
- Su MD, Kang J-L, Chang L-F, Chen AS. 2005. A Grid-Based GIS approach to regional flood damage assessment. J Marine Science Technol. 13(3):184–192.
- Tapia-Silva F-O, Itzerott S, Foerster S, Kuhlmann B, Kreibich H. 2011. Estimation of flood losses to agricultural crops using remote sensing. Phys Chem Earth, Parts A/B/C. 36(7–8):253–265.
- Thailand Ministry of Finance. 2012. Thai Flood 2011: Rapid assessment for resilent recovery and reconstruction planning, The Thai Government and The World Bank.
- Tourism Authority of Thailand. 2010. Amazing Thailand: Ayutthaya, In Thailand, T. A. o., ed.: Thailand, Promotional Material Production Division. https://www.tourismthailand.org/About-Thailand/About-TAT/TAT-Informative