
Abstract
Superficial and sub-superficial soils affected by salinization were studied on a pilot site on an Ionian coastal plain in Basilicata, Southern Italy. Grain-size, mineralogical, and geochemical features favouring soil degradation were analyzed. This study identifies the main mechanisms for triggering soil salinization, including electrical conductivity which provide a physical marker by measuring the level of salinization and silty grain component size and halite and/or chlorite percentages provided compositional markers. A critical depth of about 20 cm was identified, impacting the downward diffusion mechanism of the superficial salt and a possible chloritization of smectite from/by soluble magnesium relating to saline water-soil interaction from weathering processes.
1. Introduction
Land degradation due to soil salinization represents an important issue in arid coastal areas including the transition zones between saline and freshwater environments and are often characterized by a strong anthropic pressure and consequently an intense exploitation of soil and water resources.
Marine ingression represents one of the main causes of soil degradation on a coastal environment, however marine aerosol and the frequency of storm and floods and prolonged stagnation of seawater can also play an important role in soil salinization. Salt accumulation is generally more accentuated at the soil surface, when salt deposition from marine spray or water evaporation from brackish pool and ponds occur. The excessive exploitation of groundwater at ground level or close by and the indiscriminate use of fertilizers and/or land irrigation using brackish or saline waters can also contribute and exacerbate the salinization processes with very serious consequences on crops and plants (Barbarella et al. Citation2015; Gkiougkis et al. Citation2015; Argamasilla et al. Citation2017; Imbrenda et al. Citation2018). Crop salinity tolerance depends on the crop species, however, the growth of most agronomic crops is inhibited or greatly hindered when effective electrical conductivity is greater than 4 dS/m (Soil Salinity Staff Citation1954; Andrews et al. Citation2004; Karlen et al. Citation2008; Aldabaa et al. Citation2015).
Ionian coastal areas in southern Italy represent an important pilot case for soil salinization processes (Spilotro et al. Citation2002; Polemio et al. Citation2003a, Citation2003b; Satriani et al. Citation2012).
Basso et al. (Citation2012) indicated that climate is the main factor contributing to the environmental sensitivity to land degradation/desertification processes in this area. The succession of increasingly hot and dry periods with decreasing rains and increasing evaporation rates have played an important role in the environmental modification of areas studied throughout the twentieth century. However, further anthropic contribution must be considered, such as the reclamation of wetlands, the construction of dams, and weirs along the rivers of the upstream watersheds, an increase in tourism and the strengthening of livestock and valuable agricultural practices in already strongly anthropized zones.
A pilot site close to the Basento river mouth was chosen for this study, based on physical, mineralogical, and geochemical soil characterization to (1) confirm the usefulness of electrical conductivity in the representation of the level of soil salinity, (2) identify any correlations between compositional soil properties and soil salinity, (3) hypothesize possible mineralogical and geochemical hazard factors in relation to soil salinization and (4) identify the main causes of soil salinization and related weathering processes.
2. Pilot site
The pilot site is located in Torre Mare, Metaponto, along the Basilicata Ionian coast, close to the mouth of the river Basento ().
Figure 1. Map of the studied area. ![]()
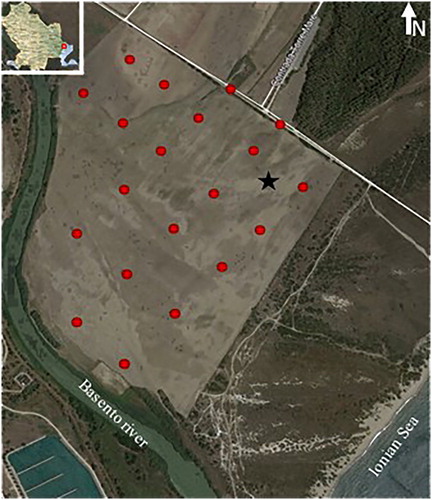
The geological bedrock is represented by the sedimentary succession of the Apennine foredeep (Ciaranfi et al. Citation1979; Tropeano et al. 2002; Polemio et al. Citation2002, Citation2003a, Citation2003b, Citation2006), from top to bottom consisting of: (1) marine terrace deposits (Middle–Upper Pleistocene), (2) Monte Marano Sands and Irsina Conglomerate Formations (Lower–Middle Pleistocene sands and conglomerates), (3) Subappennine Formation (Upper Pliocene–Middle Pleistocene clays) area. These terrains are covered by recent alluvial, transition, and marine deposits, hosting multi-aquifer groundwater with a permeability limit able to go below sea level, allowing for marine intrusion (Polemio et al. Citation2002, Citation2003a, Citation2003b, Citation2006). The soils on the lower terraces of the Metaponto area are weakly developed having grayish- or yellowish-brown colours and can be classified as Brunic Arenosol (Calcaric).
The area lies in a typical Mediterranean climate region, classified as Csa by the Köppen-Geiger system. The warmest month is July (average monthly temperature ∼25 °C) whereas the coolest is January (average monthly temperature ∼9 °C) and a mean annual temperature of ∼16.5 °C. The temperatures reached during summers are occasionally similar to cold semi-arid regions. The total annual precipitation averages ∼456 mm. The driest and wettest months are July and November with less than 20 mm and ∼66 mm of average rainfall, respectively (Satriani et al. Citation2012).
The pilot site is characterized by the presence of pervasive whitish crusts of saline precipitates ().
Figure 2. (A) Salinitation process of the studied area. (B) Profile of geognostic well dug.
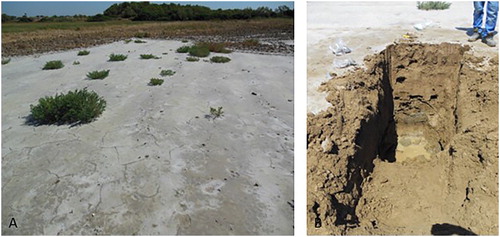
The crust formation could be due to simultaneous processes occurring in the area such as groundwater rising periodically to ground level and storm surges and flooding from the river Basento with subsequent water evaporation from ponds and pools, marine spray deposition and scarcity of rainfall able to leach saline accumulations. The vegetation cover is mainly represented by halophilic species such as Triglochin bulbosum, Sarcocornia fruticosa, Arthrocnemum glaucum, and the saline crusts tend to be thicker where vegetation is absent or stunted.
3. Materials and methods
A total of 20 superficial soil samples were collected at nodes of a grid entirely covering the area studied and were analyzed for electrical conductivity measurements, pH determination, grain-size, and mineralogical analyses, soluble and extractable cation determination with the calculation of some geochemical parameters such as SAR (Sodium Absorption Ratio) and CEC (Cation Exchange Capability). Identical and analytical determinations were also performed on 12 samples collected from a geognostic well-excavated to a depth of about 1.5 m below ground level () chosen as the superficial manifestations of soil salinization were most evident ().
Electrical conductivity and pH were determined by measurements on suspensions of 1 part of soil to 2.5 part water.
Grain-size analyses of soil samples were carried out using wet sieving and fractional sedimentation following Stokes’ Law.
Mineralogical analyses were carried out using X-ray diffraction (XRD), with Cu Kα radiation, secondary monochromator, and a sample spinner. A Rigaku Miniflex powder diffractometer was used. The quantitative mineralogical bulk rock data was obtained following the Barahona Fernandez procedure (Barahona Fernandez 1974) based on integrated intensity measurements for all the crystalline phases. The less than 2 μm fraction was separated using sedimentation in distilled water following Stokes’ Law and analyzed using oriented aggregates, in natural conditions, heating to 375 °C and solvating with ethylene glycol overnight at 60 °C, following Biscaye (Citation1965), with slight modifications. The characterization of mixed-layer clays was accomplished following Moore and Reynolds (Citation1989). Peak area, peak position, and width were measured using WinFit decomposition software (Krumm 1994).
Sodium Adsorption Ratio (SAR) is a geochemical parameter useful for evaluating soil sodicity and texture features and is generally determined from the concentrations of the alkaline and earth alkaline cations in saturated extracts, as indicated, for example, by Rowell (Citation1994), Summa et al. (Citation2007), Chi and Wang (Citation2010), Chi et al. (Citation2011), Summa et al. (Citation2015). A clay-water suspension was used by mixing 4 g of sediment and 40 ml of distilled water, followed by 12 hours of shaking, centrifugation, and filtering. The supernatant was analyzed using Inductively Coupled Plasma-Optical Emission Spectrometers (ICP-OES) to determine Na amounts. Residual sediments were used to determine the exchangeable cations, by adding 40 mL of 1 M ammonium acetate solution. The suspension was shaken for 2 hours, centrifuged and filtered through a 0.45 μm membrane. The supernatant was analyzed to determine Mg, Ca, Na, and K amounts; the sum of cations was used to calculate the cation exchange capability (CEC) and the exchangeable sodium (ESP), magnesium (EMP), calcium (ECP), and potassium (EPP) percentages.
4. Results
4.1. Physical characters
The electrical conductivity identified many samples with potentially serious or moderate salinity conditions. A subdivision of the samples studied in two salinity classes was proposed, with a threshold value of 4 mS/cm which could be considered as the value above which all crops are suffering and only the halophilic species survive (Giandon and Bortolami 2008). Eight superficial samples fell into the >4 mS/cm class (following class A), all exceeding 10 mS/cm, the remaining 12 samples had electrical conductivity ranging between 0.5 and 4 mS/cm (following class B), values able to partially depress the crops, from those more sensitive to the more tolerant ones ().
TABLE 1. Chemical–physical composition of the studied samples: CE (Electrical Conductivity), SAR (sodium adsorption ratio), ΣSC (total soluble cation), CEC (cation exchange capacity), ESP (exchangeable sodium percentage), ECP (exchangeable calcium percentage), EPP (exchangeable potassium percentage) and EMP (exchangeable magnesium percentage). n.d. (not determinated).
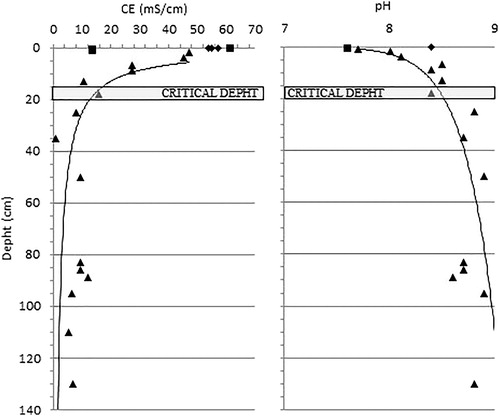
All well samples fell into class A, constantly exceeding 10 mS/cm up to about 20 cm depth, with the exception of one sample (M7) which showed a significantly lower value. The values gradually decreased with depth, remaining at >4 mS/cm. ().
Figure 3. CE (Electrical Conductivity) and pH vs depth diagrams. ♦ Crust samples ▪ Sub-superficial samples ▴ Deep samples.
4.2. Geochemical characters
All soils studied can be classified from moderate to very alkaline, with pH values ranging between 7.6 and almost 9.0 (). No significant differences were detected between the two salinity classes identified. pH trend increased with depth ().
SAR of superficial samples, ranged between 1 and 20, and higher values, consistently >10, were detected for class A samples. A clear distinction was made between the quantities of total soluble cations for class A (ΣSC > 10 meq/100g) and class B (1 meq/100g < ΣSC < 5 meq/100g) with the exception of one sample (M7) which showed a significantly higher value. Sodium was the most abundant soluble cation with the exception of two samples (G16 and G19) where calcium prevailed and potassium also showed higher values than all other samples. Soluble magnesium was also detected in non-negligible amounts ().
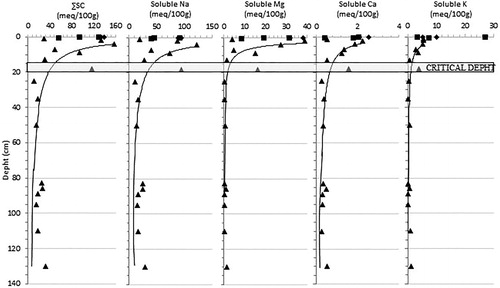
The total soluble cations from the well samples decreased with depth, maintaining significantly high values up to a depth of about 20 cm; with values abruptly dropping below that depth, and staying at >10 meq/100g. All soluble cations showed this depth trend, with sodium ≫ magnesium ≫ calcium > potassium ().
Figure 4. Total Soluble Cation (∑SC), Soluble Na (Sodium), Soluble Mg (Magnesium), Soluble Ca (Calcium) and Soluble K (Potassium) vs depth diagrams. ♦ Crust samples ▪ Sub-superficial samples ▴ Deep samples.
Superficial sample CEC values ranged between 25 and 41 meq/100g, with the exception of one sample (G20) which showed a significantly lower value. No significant differences in CEC values were observed between the two salinity classes indentified. Calcium was always the most abundant exchangeable cation, Magnesium, sodium, and potassium followed in this order of abundance. Highest exchangeable sodium values were observed in the samples in salinity class A. No significant depth trends were observed in the well samples ().
4.3. Grain-size
According to the Shepard diagram (1954), the superficial soils studied can be classified as silts, sandy silts and clayey silts, with only two outlier samples falling in the sand field and Loam field of the diagram ().
Figure 5. Granulometrical classification of superficial samples (Shepard, Citation1954). • Class A samples ▴ Class B samples.
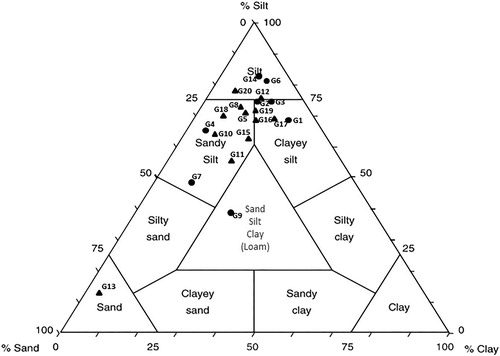
The silty fraction was always predominant, with the exception of the prevalently sandy sample, and ranged between 14% and 86%, showing a high variability. The most represented silty fraction always ranged between 16 and 32 µm. The clayey fraction was often the most poorly represented grain-size component and only exceeded the sandy fraction in a few samples and was almost absent in one prevalently silty sample ().
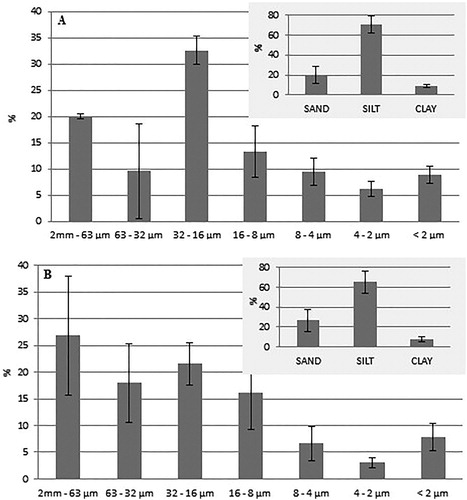
Figure 6. Avarage granulometrical composition of superficial samples (A) and of well samples (B).
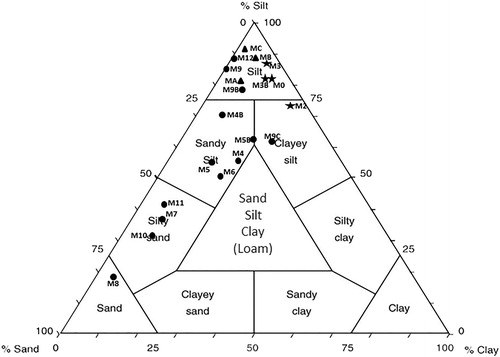
The well samples showed analogous granulometrical characters and an increased variability was detected. These samples can be classified as silts, sandy silts, and silty sands, with one sample falling into the sand field and two samples falling into the clayey silt field. All crust samples and sub-superficial samples (collection depth ≤4 cm) fell into the silt field, with very low sand and clay amounts, with the exception of one sample which fell into the clayey silt field ().
Figure 7. Granulometrical classification of well samples (Shepard, Citation1954). ♦ Crust samples ▪ Sub-superficial samples (depth ≤ 4cm) • Deep samples (depth > 4cm).
On average, the most represented silty fraction ranged between 16 and 32 µm, less evident than those detected for the superficial samples, the 63 – 32 µm and 8–16 µm fractions were also well represented (). The clayey fraction was almost always the most poorly represented grain-size component, with the exception of the sub-superficial samples whichexceeded the sandy component.
4.4. Mineralogy
Sheet silicates and quartz were the most abundant phases in the superficial soils studied (about 36% and 27% on average, respectively). Carbonates, feldspars, and then plagioclases occurred in minor quantities and in the following decreasing order of abundance (). Sheet silicates were always the prevalent phases, with the exception of a few samples where quartz was predominant. One sample showed only sheet silicates in traces, consistent with the almost total absence of the <2 µm fraction. Calcite was more abundant than dolomite. Halite was also detected in all samples, with concentrations up to 5%. The phyllosilicatic components were characterized by a predominance of expandable phases (about 48% on average). Illite and muscovite occurred on an average at approximately 25%. Kaolinite and chlorite were present in similar quantities, with a weak prevalence of chlorite, and their amount almost always exceeded 10% ().
TABLE 2. Mineralogical composition of the studied samples: Qtz (Quartz), Cal (Calcite), Dol (Dolomite), K-feld (Feldspar), Plg (Plagioclase), Phy (Phyllosilicate), Ha (Halite), Gy (Gypsum), Ill/M (Illite/muscovite), Ill/Sme (Illite/Smectite), K + Ch (Kaolinite + Chlorite), χ (average) and σ (standard deviation).
Well samples showed analogous mineralogical characters. Bulk rock was characterized by a predominance of sheet silicates and, secondly, quartz (about 40% and 23% on average, respectively). Total carbonate amounts were comparable to the quartz amounts (about 23%), with calcite ≫ dolomite. Feldspars and plagioclases occur in less abundance (5%). Halite was also detected in all samples, with concentrations up to 5% and one value exceeding 10% (). The phyllosilicatic component was characterized by a predominance of expandable phases (about 39% on average). Illite and muscovite occurred on an average at approximately 31%. In almost all shallower samples the illite/muscovite was the prevalent phase, whereas expandable phases (Illite/Smectite) became clearly prevalent in deeper samples. Kaolinite and chlorite were present in similar quantities, with a weak prevalence of chlorite almost always exceeding 10% ().
5. Discussion and Conclusion
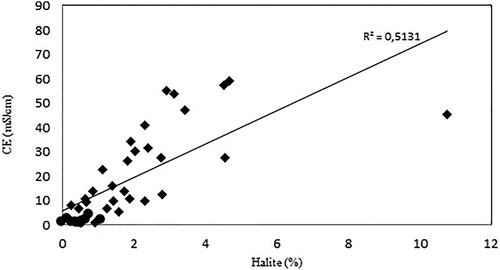
The statistically significant positive correlation detected in the percentage of halite and electrical conductivity confirms that it can be considered as a good indicator for the degree of soil salinization, particularly evident in large concentrations of halite and higher values of electrical conductivity (Class A), while for lower values (Class B) this linear relationship is less clear ().
Figure 8. Correlation between CE (Electrical Conductivity) and Halite. ▴ Class A • Class B.
The electrical conductivity for class B, however, shows a positive correlation between the percentages of chlorite with a corresponding negative correlation with illite/smectite (). This correlation is less evident for the samples belonging to Class A.
Figure 9. Correlation between mineralogy composition and CE (Electrical Conductivity).
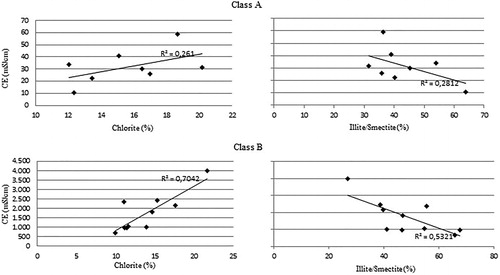
A possible explanation for correlations between salinity, chlorite, and smectite could be linked to Mg fixation in the mineral structures resulting in the transformation of smectitic minerals into chlorite, as already indicated for saline and alkali soil conditions by Raychaudhuri (Citation1968) and Simakova (Citation2008). Furthermore, Raychaudhuri (Citation1968) also highlighted that this type of transformation is able to significantly affect soil structure, due to the difference between crumb structures typical in montmorillonites and platy structures characterizing chlorites. The minor amounts of halite in the samples belonging to Class B could justify a higher quantity of soluble magnesium in the weathering and degradation processes compared with the more halite-enriched samples.
The decreasing depth trend of electrical conductivity () and the percentage of halite () confirm a significant correlation between these two parameters. Furthermore, a critical depth of between 15 and 20 cm was identified, above that the halite concentrations and the electrical conductivity were significantly higher and were characterized by a strong variability. This critical depth was confirmed by the trend of soluble cations and chlorite, providing further evidence that salinization of the site studied is mainly related to surface processes (marine sprays and water evaporation from residual salty ponds) and a possible threshold in relation to the effectiveness of diffusion processes from ground level. However, halite values and electrical conductivity in the well samples have higher values compared with superficial samples indicating a good albeit lower effectiveness of the downward saline solution diffusion also at higher depths.
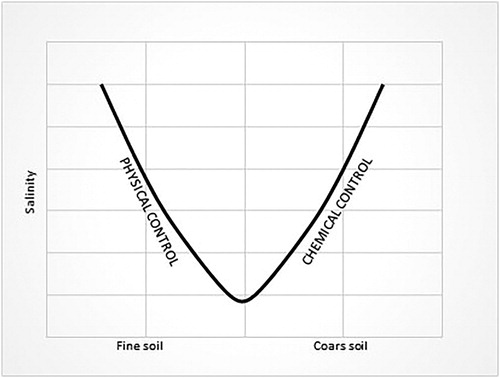
Superficial samples with the highest silty component belong to Class A (), hence this granulometrical character seems to play a non-negligible role in the salinization process in the area studied. This is probably due to some typical silty soil characteristics such as poor mobility of nutrient elements and low permeability compared with coarser soils, making it very susceptible to land salinization, such as the formation of a dry superficial crust and superficial sea water stagnation (Giandon and Bortolami Citation2008).
In the coarser samples, the almost total absence of the clayey fraction and the slightly larger amount of sandy fraction could justify the less intensive degradation. However, the salinization seems to also be favoured by a high sandy fraction. In this case, the prevalent typology of the degradation process could be chemical rather than physical and involve rapid mineralization of organic matter with the consequent rapid release of nutrients (). For deep samples (), the salinization process was also influenced by physical aspects (low permeability and poor mobility of the nutrient elements), as shown in the previous diagram for superficial samples ().
Figure 10. Grain size influence on soil salinity.
The results of this study show that the salinization process involves morphological and hydrogeological factors, geographic exposure and climatic elements as well as grain size, mineralogy, and geochemistry composition of soils.
Acknowledgements
The authors would like to thank the Administrative Basilicata Region for having financed these activities and the referees for their important suggestions to improve the quality of this study.
Disclosure statement
No potential conflict of interests was reported by the authors.
Additional information
Funding
References
- Aldabaa AAA, Weindorf DC, Chakraborty S, Sharma A, Li B. 2015. Combination of proximal and remote sensing methods for rapid soil salinity quantification. Geoderma. 239–240:34–46.
- Andrews SS, Karlen DL, Cambardella CA. 2004. The soil management assessment framework. SSSAJ. 68(6):1945–1962.
- Argamasilla M, Barberá JA, Andreo B. 2017. Factors controlling groundwater salinization and hydrogeochemical processes in coastal aquifers from southern Spain. Sci Total Environ. 580:50–68.
- Barahona Fernandez E. 1974. Arcillas de ladrilleria de la privincia de Granada: Evaluacion de algunos ensayos de materias primas [Clay of brickwork from the province of Granada: evaluation of some raw material tests]. Granada: University of Granada.
- Barbarella M, De Giglio M, Greggio N. 2015. Effects of saltwater intrusion on pinewood vegetation using satellite ASTER data: the case study of Ravenna (Italy). Environ Monit Assess. 187(4):166
- Basso BD, Simone L, Cammarano D, Martin EC, Margiotta S, Grace PR, Yeh ML, Chou TY. 2012. Evaluating responses to land degradation mitigation measures in Southern Italy. Int J Env Res. 6(2):367–380.
- Biscaye PE. 1965. Mineralogy and sedimentation of recent deep-sea clay in the Atlantic Ocean and adjacent seas and oceans. GSA Bulletin. 76:803–832.
- Chi CM, Wang ZC. 2010. Characterizing salt-affected soils of Songnen Plain using saturated paste and 1:5 soil-to-water extraction methods. Arid Land Res Manag. 24(1):1–11.
- Chi C-M, Zhao C-W, Sun X-J, Wang Z-C. 2011. Estimating exchangeable sodium percentage from sodium adsorption ratio of salt-affected soil in the Songnen Plain of Northeast China. Pedosphere. 21(2):271–276.
- Ciaranfi N, Maggiore M, Pieri P, Rapisardi L, Ricchetti G, Walsh N. 1979. Considerazioni sulla neotettonica della Fossa bradanica. [Considerations on the neotectonic of the bradanica Fossa. Progetto Finalizzato Geodinamica Del CNR. 251:73–95.
- Giandon P, Bortolami P. 2008. L’interpretazione delle analisi del terreno. Strumento per la sostenibilità ambientale [The interpretation of the soil analysis. Tool for Environmental Sustainability]. Regional Agency for the Environment of the Veneto Region, Collana Verdenauta. 70.
- Gkiougkis I, Kallioras A, Pliakas F, Pechtelidis A, Diamantis V, Diamantis I, Ziogas A, Dafnis I. 2015. Assessment of soil salinization at the eastern Nestos River Delta, NE Greece. Catena. 128:238–251.
- Imbrenda V, Coluzzi R, Lanfredi M, Loperte A, Satriani A, Simoniello T. 2018. Analysis of landscape evolution in a vulnerable coastal area under natural and human pressure. Geomat Nat Hazards Risk, 9(1):1249–1279.
- Karlen DL, Tomer MD, Neppel J, Cambardella CA. 2008. A preliminary watershed scale soil quality assessment in north central Iowa, USA. Soil Tillage Res. 99(2):291–299.
- Krumm S. 1994. WINFIT1.0 - A public domain program for interactive profile-analysis under WINDOWS. XIII Conference on Clay Mineralogy and Petrology, Praha. Acta Universitatis Carolinae Geologica 38: 253–261.
- Moore DM, Reynolds RC. 1989. X-ray diffraction and the identification and analysis of clay minerals. New York (NY): Oxford University Press; p. 332–337.
- Polemio M, Limoni PP, Mitolo D, Santaloia F. 2002. Characterisation of ionian-lucanian coastal plain aquifer. XXXII IAH & ALHSUD Congress; 21–25 October 2002; Mar della Plata, Argentina.
- Polemio M, Dragone V, Limoni PP, Mitolo D, Santaloia F. 2003a. Caratterizzazione idrogeologica della piana di Metaponto, qualità e rischi di degrado delle acque sotterranee [Hydrogeological characterization of the Metaponto plain, quality and risks of groundwater degradation. AS/IT JGW. 83:35–49.
- Polemio M, Limoni PP, Mitolo D, Santaloia F. 2003b. Characterisation of the ionian-lucanian coastal plain aquifer (Italy). BGM. 114(2):225–236.
- Polemio M, Dragone V, Limoni PP, Mitolo D, Santaloia F. 2006. The degradation hazard of groundwater resources of the Metaponto coastal plain (Southern Italy) IGEA 21: 37–46.
- Raychaudhuri SP. 1968. Transformation of clay minerals under saline and alkali soil conditions. J Indian Soc Agric Chem. 1:1–6.
- Rowell DL. 1994. Soil Science: Methods and applications. United Kingdom: Routledge.
- Satriani A, Loperte A, Imbrenda V, Lapenna V. 2012. Geoelectrical surveys for characterization of the coastal saltwater intrusion in Metapontum forest reserve (Southern Italy). Int J Geophys. 2012: 1.
- Shepard FP. 1954. Nomenclature based on sand-silt-clay ratios. JSR. 24(3):151–158.
- Simakova YS. 2008. The influence of anthropogenic salinization on the clay mineralogy of Seriogovo soils. GCA Supplement. 72A:869.
- Soil Salinity Staff. 1954. Diagnosis and improvement of saline and alkali soils. [place unknown]: USDA Agricultural Handbook, 60.
- Spilotro G, Canora F, Caporale F, Leandro G, Vignola N. 2002. Hydrogeology and groundwater salinization in the ionian coastal plane of the Basilicata Region. Proceedings of the 17th Salt Water Intrusion Meeting. The Netherlands; p. 422–434.
- Summa V, Margiotta S, Colaiacovo R, Giannossi ML. 2015. The influence of the grain-size, mineralogical and geochemical composition on the Verdesca landslide. Nat Hazards Earth Syst. Sci. 15:135–146.
- Summa V, Tateo F, Medici L, Giannossi ML. 2007. The role of mineralogy, geochemistry and grain size in badland development in Pisticci (Basilicata, Southern Italy). Earth Surf Process Landforms. 32(7):980–997.
- Tropeano M, Sabato L, Pieri P. 2002. Filling and cannibalization of a foredeep: the Bradanic Trough, Southern Italy. In: Jones SJ, Frostick LE, editors. Sediment Flux to Basins: Causes, Controls and Consequences. London, UK: Geological Society Special Publications; vol. 191(1); pp. 55–79.