
Abstract
The development characteristics of land subsidence of Xi'an by an advanced InSAR technique are investigated based on Envisat, Radarsat-2 and Sentinel-1 satellites, and it can be found that there still have been five typical land subsidence bowls with maximum subsidence rates beyond 40 mm/year in Xi'an. In 2012, the land subsidence took on slightly slowing down with a ground rebound area of up to 6.3 km2. But in 2003–2010, 2016 and 2017, there was more serious land subsidence and especially in 2017 the maximum velocity reached up to −137 mm/year. Yuhuazhai-Nanyaotou subsidence bowl as the greatest subsidence bowl, its area that rate was below 50 mm/year in 2017 was up to 10.64 km2. Moreover, these land subsidence bowls mainly concentrate upon tectonic depression area due to huge thickness clay soil and are spatially and temporally coincident with confined aquifer depression cones, suggesting that over-exploitation groundwater plays a decisive role for land subsidence. Ground fissure belts are generally controlled by normal faults in Xi'an, but asymmetry settlement of land surface can also give rise to the abnormal activities of ground fissure belts, which have caused serious threat or damage to building structures. In addition, it could also be found that surface uplift area in 2012 involves in both the tectonic depression area and loess ridge in terms of their same thickness sand layer.
1. Introduction
Many plains worldwide are affected by land subsidence, which often involve different geodynamic, hydrogeology, climatic and social contexts. Xi'an, as the capital of Shaanxi Province, located in Fenwen Basin (representing a typical inland basin) in the centre of China (Qu et al. Citation2014), and it is also characterized by land subsidence. Meanwhile ground fissure disaster is also the most typical and devastating in Xi'an. Since the end of the 20th century, land subsidence and ground fissure have caused dominant destruction on the urban Xi'an due to over-exploitation groundwater (Wang Citation2000). Land subsidence has made a great deal of construction or ground pipes height loss and has increased the risk of flooding (Peng et al. Citation2016). In some areas of large subsidence gradient, enormous damage to housing and urban infrastructure occur frequently and they frequently need to be repaired (Wang 2000; Cabral-Cano et al. Citation2008; Heleno et al. Citation2011).
Land subsidence in Xi'an is caused by a combination of geological causes and anthropogenic activities, and is mainly observed by levelling, GPS and borehole extensometer (Zhang et al. Citation2009; Li Citation2014; Qu et al. Citation2014). Levelling data usually requires several months, and its acquisition time is variable (Suo et al. Citation2005; Zhang et al. Citation2009). The vertical deformation precision of GPS is relatively low, and borehole extensometer observations have high precision, but low observing point density (Zhang et al. Citation2009). Using these traditional methods, it is difficult to comprehensively grasp the evolution characteristics of land subsidence and ground fissure.
Conventional Differential Interferometric Synthetic Aperture Radar (D-InSAR) and advanced InSAR have been proven to be a powerful tool for monitoring surface deformation (Tesauro et al. Citation2000; Wegmuller et al. Citation2010; Lu and Wicks 2010; Sara et al. Citation2015; Lee et al. Citation2017). It involves differential interferometric phase of SAR images collected at different times and allows large-scope measuring or monitoring surface deformation with millimetre accuracy (Ferretti et al. Citation2001; Ge et al. Citation2007, Citation2008; Heleno et al. Citation2011; Sara et al. Citation2015). These InSAR techniques are especially effective in urban area because of high-coherence points in SAR images, and hence their usage significantly improved earth observation technique system (Ferretti et al. Citation2001; Zhao et al. Citation2009; Sara et al. Citation2015). In Xi'an, land subsidence and ground fissure monitored by InSAR technique have been presented and the distribution and magnitude of land subsidence bowls was also been identified in 2009 and 2014 (Zhao et al. Citation2009; Zhang et al. Citation2009; Qu et al. Citation2014). Although the amount of self-provided wells has gradually reduced due to orderly groundwater management (Dai Citation2009) and Xi'an water-supplying engineering from Black River has begun to supply water for Xi'an since 2002 (The Memorabilia about Xi'an Water-Supplying Engineering from Black River Citation2001; Dai Citation2009), there still has been much larger subsidence rate and land subsidence bowls are extremely prominent in the suburbs of Xi'an (Wang Citation2000, Citation2008; Peng et al. Citation2016).
In this article, a multi-temporal differential SAR Interferometry technique integrating permanent scatterer InSAR (PSInSAR) and Small Baseline Subset (SBAS) approach is applied to monitor large-coverage land subsidence and subsidence gradient on both sides of ground fissure belts in Xi'an, covering an area of ∼800 km2 (Ferretti et al. Citation2001; Ge et al. Citation2007, Citation2008). Time-series land subsidence respectively in 2003–2010, 2012, 2016 and 2017 are generated based on Envisat, Radarsat-2 and Sentinel-1 SAR datasets and spatial-temporal variations of land subsidence bowls can be achieved. By comparing land subsidence with its geological condition, it is possibly to gain the correlation between the spatial distribution characteristics of land subsidence and tectonic depression area, which is a kind of tectonic geomorphology of Xi'an. Meanwhile, the temporal development characteristics of land subsidence and damage condition of ground fissure belts and their correlation with ground water exploitation are also analyzed.
2. InSAR method and data acquisition
2.1. InSAR method
Our goal is to monitor the spatial-temporal variations of land subsidence bowls in Xi'an and to acquire their subsidence rates with the resolution of 3–5 mm/year in the case of limited datasets. Hence the multi-temporal differential SAR Interferometry technique integrating PSInSAR and SBAS was conducted to introduce differential interferograms as much as possible based on certain spatial and temporal baselines, and SRTM DEM with 90 m resolution is used for the subtraction of topography phase. After then the InSAR approach allows to detect surface deformation jointing large groups of SAR images at such locations that are characterized by stability of radar backscattering. These locations with stable radar backscattering are referred to as “Persistent Scatterers” (PS) and correspond to stable natural or man-made reflectors (like a rock, some corners of building or bridge) (Ferretti et al. Citation2001; Berardino et al. Citation2002; Heleno et al. Citation2011; Giuseppe et al. Citation2015). Therefore, decorrelation in SAR images is greatly reduced. The InSAR technique assumes a time-linear dependence for the phase caused by line-of-sight deformation (Mora et al. Citation2003), evolves towards the estimation and removal of atmospheric phase contribution (Zebker et al. Citation1997; Emardson et al. Citation2002) and uses an iterative regression analysis algorithm to filter the atmospheric delay phase out and to separate the line-of-sight displacement phase from the elevation error phase in the case of no noise phase. Finally, the mean vertical deformation velocity in certain period covered by datasets is calculated.
2.2. Data acquisition and processing
In order to monitor spatial-temporal evolution characteristics of land subsidence in Xi'an, the advanced InSAR technique integrating PSInSAR with SBAS method is conducted to process four SAR image datasets based on Gamma software, the first dataset acquired from the European Space Agency (ESA) Envisat sensor, the second and third datasets from MacDonald Dettwiler and Associates Ltd (MDA) Radarsat-2 satellite and the last dataset acquired from ESA Sentinel-1 satellite ().
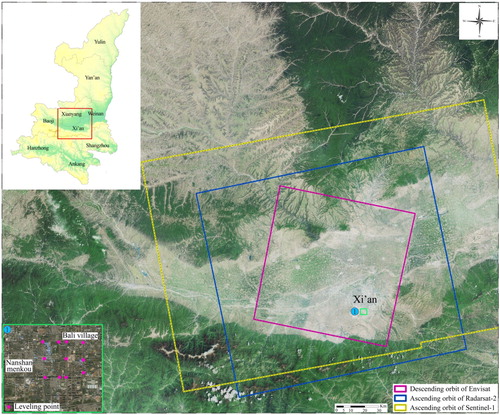
Figure 1. The study area are covered with four groups SAR images from Envisat, Radarsat-2 and Sentinel-1 satellite respectively in the period between December 2003 and May 2010, between February 2012 and March 2013, between January 2016 and October 2016 and between October 2016 and October 2017. Envisat, Radarsat-2 and Sentinel-1 satellite are respectively characterized by a swath of 100 × 100 km2, 150 × 150 km2 and 160 × 250 km2. Inset on the left top shows the location of study area highlighted in red relative to Shaanxi Province in China. The inset at the bottom left is the position of 11 levelling stations, which are used to estimate the monitoring accuracy of InSAR results by extracting these InSAR results at same location with levelling.
In the first stage, Envisat satellite was used in the period between December 2003 and May 2010, with a revisiting period of 35 days (). Thirty Envisat images with 20 m spatial resolution (ASAR Product Handbook of Envisat 2007) were acquired from descending orbit (track 161) setting 340 m for the maximum spatial baseline and 600 days for the maximum temporal one and considering 79 pairs (). Meanwhile, 383,762 PSs were identified in the Envisat images based on mean coherence estimation and low intensity temporal diversity. For each PS, the (mean) annual vertical velocity was computed (relative to a reference point in Xingping with no deformation).
Table 1. Used satellite datasets. Their main parameters, temporal span and Number of used images are listed below.
In the second and third stage, the Radarsat-2 satellite with 25 m spatial resolution was chosen to acquire wide SAR images because of Envisat expiring in 2012, characterized by a revisiting period of 24 days and also operated in C-Band (Radarsat-2 Satellite Characteristics 2015). The datasets were composed of 10 SAR images from ascending orbit imposing 330 m as the maximum spatial baseline and 400 days for the maximum temporal one resulting in 41 differential interferograms, spanning the period from February 2012 to March 2013 and 8 SAR images in the interval from January 2016 to October 2016 considering 400 days for the maximum temporal baseline and 350 m for the maximum spatial one resulting in 35 differential interferograms (). The both groups were processed separately and their PS points were extracted separately based on mean coherence estimation and low intensity temporal diversity method. The first group from February 2012 to March 2013 extracted 484,480 PSs and the second group from January 2016 to October 2016 had 444,615 PSs.
Sentinel-1 consists of two C-band radar satellites (S1A and S1B). The S1A and S1B satellites flight in some unified space orbit with 180 degree intervals. Thus satellite dataset from Sentinel-1 could have 12-day revisiting period under single satellite work and 6-day revisiting under two satellites work (Sentinel-1 User Handbook 2013). The fourth dataset covering Xi'an was all acquired from Sentinel-1A with a revisiting period of 12 days and their main parameters are listed in . Similarly, 2,866,532 PSs were identified to be computed.
At last, each differential interferogram group applied the iterative regression analysis algorithm to compute the (mean) annual vertical velocity for each PS in relation to a reference point in Xingping respectively in 2003–2010, 2012, 2016 and 2017.
2.3. Processing analysis
Theoretically there are many factors affecting the monitoring accuracy of InSAR technique, such as number of received radar images, distance between reference point and coherent point, approaching degree between deformation characteristics of coherent point and linear model, atmospheric influence, reliability of unwrapping phase, orbit error and so on. When the number of radar image is beyond 25–30, the accuracy may be among 0.1–0.5 mm/year. However, the monitoring accuracy of InSAR processing algorithm is mainly subject to those technical expertise in practice, which make it difficult completely achieve theoretical accuracy (Ferretti et al. Citation2001; Ge et al. Citation2007).
In this article, external measurement data, like levelling, is introduced to estimate the monitoring accuracy of InSAR technique simply. Eleven levelling points, located at the area between Nanshanmenkou and Bali Village (), and their annual vertical velocity in 2009–2010 are obtained from Wang et al. (Citation2016). In order to acquire InSAR results that are kept at same location and period with levelling, 13 Envisat images during the period between January 2009 and May 2010 were used to result in 31 differential interferograms, and these interferograms were processed to acquired the annual vertical velocity based on the same InSAR technique. Then by Kriging interpolation, the annual vertical velocity by InSAR technique around levelling could be converted into raster data. Finally, the InSAR results at same location with levelling were extracted and the standard deviation between both data could be computed, about 4.98 mm/year. Because these subsequent radar satellites, Radarsat-2 and Sentinel-1, have much more accurate orbit data and could bring about much more pairs of differential interferograms, seen in , the computed standard deviation should theoretically be much smaller. Therefore, that standard deviation derived from four radar datasets should be less than 5 mm/year based on the advanced InSAR technique.
3. Geological setting
Xi'an is located within the middle part of Guanzhong Plain, with the Weihe to the north and Qinling Mountains to the south. The Guanzhong Plain represents a fault-bounded fragment with the basement depth beyond 7 km, where huge amounts of Cenozoic material have accumulated (Wang Citation2000; Peng et al. Citation2016). As a result of being under a north-south stress extension environment since the Cenozoic, coupled with being surrounded by a distinguished order of normal faults, Guanzhong Plain has accumulated Cenozoic sediments, gradually thickening from south to north as the Plain continues to sink (Shi Citation2009). Moreover, this tectonic framework still has not changed so far. The Weihe Fault and Lintong-Chang'an Fault, having much larger extensions, depths and activity, are respectively the north and south boundaries of Xi'an – they play an important role in tectonic stability. A series of secondary fault sustained activity of the Lintong-Chang'an Fault causes corresponding tectonic topography to be formed: the narrow ENE oriented loess ridge and a tectonic depression area are parallel, interchangeably distributed (). They possess significantly different sediment thicknesses (Zhang Citation1986), and the clay layer (or compression layer) of the tectonic depression area is relatively thicker than that of loess ridge.
Figure 2. This map depicts geology and geomorphology characteristics of Xi'an, which is marked with the red square in the lower right image. Xi'an is surrounded by a series of normal fault, among which the ENE oriented loess ridge and those tectonic depression area are interchangeably distributed and ground fissure belts are basically located at the south of loess ridge (Shi Citation2009).
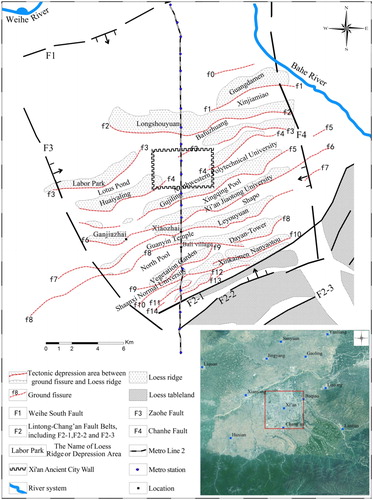
Ground fissure is a kind of special and natural type of tectonic crustal movement in Xi'an, which is controlled by a series of secondary faults of the Lintong-Chang'an Fault (Zhang Citation1986; Shi Citation2009; Peng et al. Citation2016). At present, there are 14 ground fissure belts found in urban and suburban areas, and they all appear in the transition from loess ridge to the tectonic depression area (see ). Except for a few segments of ground fissure belts f9 and f10, the fissures are located at the south of loess ridge (Shi Citation2009).
4. Result
4.1. Land subsidence
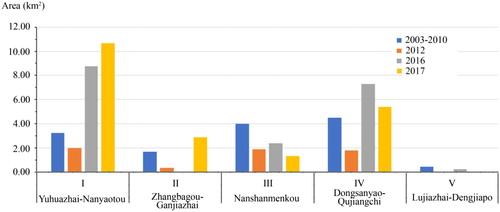
Based on these InSAR results, it is found that there have been five typical land subsidence bowls locating at the southern and southwest part of Xi'an (), named as Yuhuazhai-Nanyaotou subsidence bowl (I), Zhangbagou-Ganjiazhai subsidence bowl (II), Nanshanmenkou subsidence bowl (III), Dongsanyao-Qujiangchi subsidence bowl (IV) and Lujiazhai-Dengjiapo subsidence bowl (V). In 2012, the subsidence rates in five subsidence bowls were all much smaller, and there was a wide-range ground rebound area around the bell tower, covering up to 6.3 km2. However, in 2003–2010, 2016 and 2017, these subsidence bowls were larger and the maximum subsidence rates were above 85 mm/year. In 2016 and 2017, the maximum subsidence rates even exceeded 135 mm/year (), belonging to Yuhuazhai-Nanyaotou subsidence bowl (I). As Yuhuazhai-Nanyaotou subsidence bowl (I) is the greatest subsidence bowl in Xi’an, it showed an increasing trend, the area with subsidence rate beyond 50 mm/year from 3.24 km2 in 2003–2010 to 10.64 km2 in 2017 (). Compared to Yuhuazhai-Nanyaotou subsidence bowl (I), the subsidence area of Dongsanyao-Qujiangchi subsidence bowl (II) was correspondingly smaller. The maximum subsidence rates respectively had a reduction of 25 mm/year and 46 mm/year in 2016 and 2017, and the areas (<−50 mm/year) were decreased to 7.27 km2 and 5.38 km2. Conversely, Nanshanmenkou and Lujiazhai-Dengjiapo subsidence bowl took on a decreasing trend, the area with subsidence rate of above 50 mm/year was only 1.32 km2 in Nanshanmenkou subsidence bowl but the subsidence rate was all below 50 mm/year in Lujiazhai-Dengjiapo subsidence bowl in 2017 ().
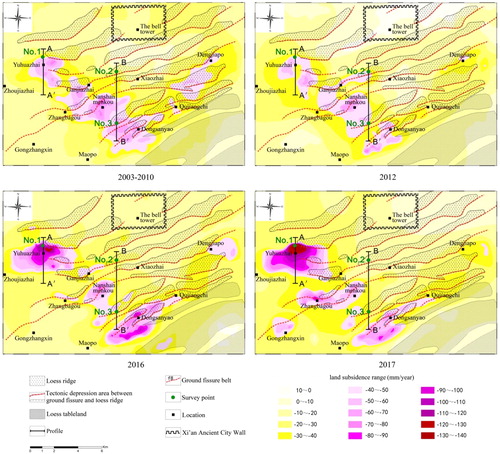
Figure 3. The average annual land subsidence velocities (in mm/year) of Xi'an in 2003–2010 (A), 2012 (B), 2016 (C) and 2017 (D), from the time-series observation based on Envisat, Radarsat-2 and Sentinel-1. These results are colour-coded from dark blue (representing the shortening distance between the land and satellite, or land uplift) to dark rose red (representing land maximum subsidence). I, II, III, IV and V are respectively on behalf of Yuhuazhai-Nanyaotou subsidence bowl, Zhangbagou-Ganjiazhai subsidence bowl, Nanshanmenkou subsidence bowl, Dongsanyao-Qujiangchi subsidence bowl and Lujiazhai-Dengjiapo subsidence bowl.
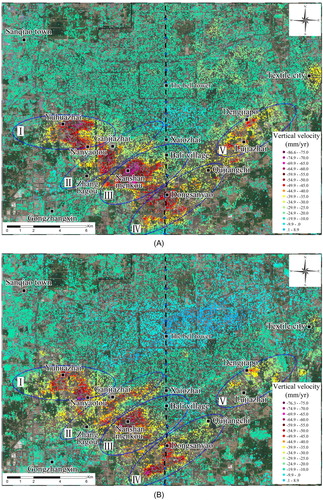
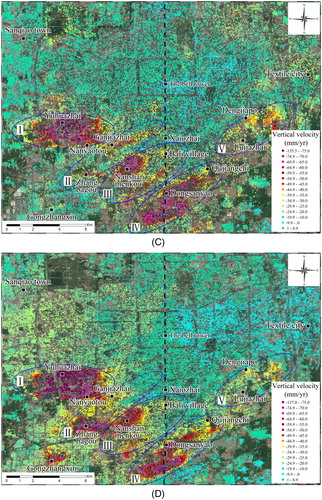
Figure 4. The figure shows the area with subsidence rate beyond 50 mm/year of these five subsidence bowls, changed in 2003–2010, 2012, 2016 and 2017.
showed that Yuhuazhai-Nanyaotou (I), Zhangbagou-Ganjiazhai (II), Nanshanmenkou (III) and Dongsanyao-Qujiangchi (IV) subsidence bowls roughly match with the Northwestern Polytechnical University, Xingqing Pool, Shapo, Guanyin Temple, North Pool, Shaanxi Normal University, Xinkaimen tectonic depression area and the tectonic depression area between f10 and F2-2 (Shi Citation2009) (). However, the land subsidence within loess ridge, is also relatively outstanding, such as Xi'an Jiaotong University, Leyouyuan and Vegetation Garden loess ridge. In 2012 and 2016, the maximum subsidence rates were only 40–50 mm/year and the area of above 40 mm/year was small in the loess ridge at the west of Ganjiazhai, belonging to Xi'an Jiaotong University. But in 2017, the maximum subsidence rate was about 65 mm/year and the area with subsidence rate of 40–70 mm/year was nearly half of small loess ridge at the west of Ganjiazhai (). Lujiazhai-Dengjiapo (V) subsidence bowl was also not completely consistent with the depression area during the period between 2003 and 2010, the maximum subsidence rate in Dayan Tower loess ridge also reached up 50–60 mm/year, but in 2012, 2016 and 2017 the subsidence bowl moved to the northeast part, spreading consistently with the Guanyin Temple and North Pool tectonic depression area (). In addition, it could be found that there was a large-scale land uplifting area in 2012 and it also had a certain relationship with geomorphology. The ENE uplifting area in Xi'an, lying in the south of ground fissure belt f3 and the north of Gujiling loess ridge, was primarily concentrated in the Bafuzhuang, Lotus Pond and Northwestern Polytechnical University tectonic depression area and Huaiyaling loess ridge ( and ).
Figure 5. The subsidence contour maps are depicted in based on InSAR results. The land subsidence was further aggravated in 2016 and 2017, especially in the Yuhuazhai-Nanyaotou subsidence bowl and Dongsanyao-Qujiangchi subsidence bowl, whose maximum subsidence rates were all above 60 mm/year. Meanwhile, these land subsidence bowls were mainly correlated with tectonic depression area, which are consisted of loess, interbedded clays, silts and sands. Ground fissure belts are the boundary between loess ridge and tectonic depression area, and also are usually the boundary of subsidence zone. The survey points No. 1, No. 2 and No. 3 plotted in green locate at ground fissure belts f4, f6 and f9. They have different activity and cause to different damage to building or roads.
4.2. Ground fissure
Ground fissure belts in Xi'an appear on the junction area between loess ridge and tectonic depression area and spread along the south edge of loess ridge. These ground fissure belts are generally controlled by normal faults. However, asymmetry settlement of land surface can also give rise to the abnormal activities of ground fissure belts. In Xi'an ground fissure belts have caused enormous damage to buildings, roads and walls especially in the area where subsidence gradient of land surface changes greatly.
According to field investigation in recent years, the destruction of ground fissure belts is extremely obvious at Xi'an International University, Chongye Road and the northeast part of Ducheng village. As an extension of ground fissure belt f4, the survey point No. 1 in is located in Xi'an International University, and spread along the north edge of Yuhuazhai-Nanyaotou subsidence bowl (I), where subsidence gradient kept great changes, between 0.010% and 0.012% (). The great differential subsidence rate around ground fissure belt f4 cause a school building to be divided into two that its south side is about 0.5 m lower than the north side () and flowerbeds and roads to be badly damaged (). illustrates the damage of survey point No. 2 in . Although the region near No. 2 has large subsidence gradient, about 0.0037–0.0074% respectively in 2003–2010, 2012 and 2016 (), the No. 2, as a part of ground fissure belt f6, is away from the ground fissure belt f6 and Shapo tectonic depression area, locates within Xi'an Jiaotong University loess ridge, and the less damage to the Chongye Road at No. 2 has been mended now, surrounded by two red lines (). The third survey point No. 3 locates at the northeast of Ducheng village and belongs to the main fissure of ground fissure belt f9. It has the smallest subsidence gradient, about 0.0014–0.0028% (), but great asymmetry settlement of foundation have also made roads and walls near No. 3 be damaged ()
Figure 6. The different kinds of damages caused by ground fissure belt. (a) and (b) are pictures photographed at the survey point No. 1 plotted by green in . The ground fissure belt f4 causes to two building having height difference of about 0.5 m (a) and flowerbeds and ground surface broken (b) at Xi'an International University. (c) The photo at the survey point No. 2 across Chongye Road and (d) the survey point No. 3 located at the northeast of Ducheng village.
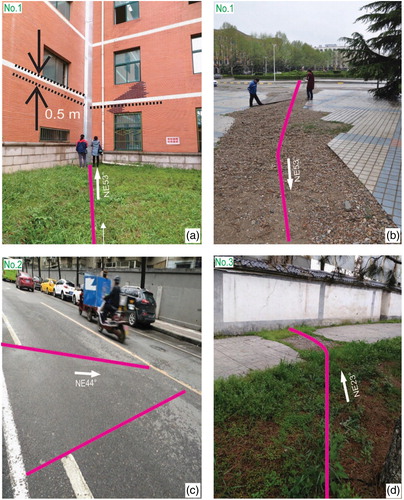
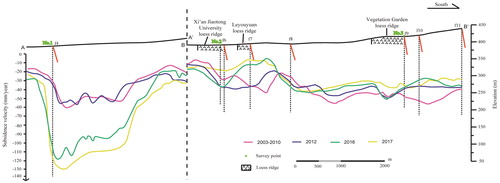
Figure 7. The land subsidence profile of AA′ and BB′ in .
5. Discussion
The land subsidence bowls in Xi'an are spatially identical to the tectonic depression area. Ground fissure belts, as the boundary between loess ridge and tectonic depression area, basically locate at the edge of land subsidence bowls and take on extraordinary activities in some segment where the subsidence gradient is large. Both of them are brought about by a combination of causes such as neotectonic activity and over-exploitation groundwater, but groundwater exploitation variations play a decisive role in land subsidence and extraordinary active fissures.
5.1. Land subsidence, ground fissure and geology characteristics
The land subsidence bowls are generally concentrated in the tectonic depression area and ground fissure belts are usually the boundary of these land subsidence bowls, as showed in , but the subsidence zones do not absolutely correspond to the tectonic depression area and there were also high rates within loess ridge at some times. The possible cause was investigated focussing on the lithological features, stratigraphic architecture, and thickness of the Cenozoic deposits (Giuseppe et al. Citation2015; Kim et al. Citation2016; Peng et al. Citation2016).
To thoroughly investigate the above topic, large amounts of data from the literature were analyzed to compare vertical-lateral thickness variations of the Holocene deposits in both tectonic depression area and loess ridge (Dai Citation2009; Shi Citation2009; Li Citation2014). A series of secondary normal faults of Lintong-Chang'an Fault result in loess ridge formed by footwall and tectonic depression area by hanging wall, which are alternately arranged. Besides, because of upper mantle uplift and normal extension of Lin-tong fault in Xi'an (Wang Citation2008). During slow sedimentary processes, sandstone layers deposit for a short time, and their thickness within tectonic depression area is nearly equivalent to that within loess ridge. However, clay deposits last for a longer time and have distinguished sedimentary rate in loess ridge and the tectonic depression area, which lead to a huge difference in the thickness of clay soil between loess ridge and the tectonic depression area. Moreover, within the depth of 100–300 m according to the seismic data, the deposit age within the tectonic depression area is much newer relative to that in loess ridge, which means that loessial clay layer within the tectonic depression area has a larger void ratio, larger compressibility and lower bearing capacity than that clay layer in loess ridge (). Therefore, within the depth of 100–300 m, the land subsidence rate in the tectonic depression area is bigger than that in loess ridge when the confined water level drops the same height (Wang Citation2008; Giuseppe et al. Citation2015; Peng et al. Citation2016). On the contrary, when the groundwater level rises, the compression deformation of clay soil is mostly irreversible, but sandy soil could undergo elastic deformation and may recover. In terms of the same sand layer thickness within the tectonic depression area and loess ridge, their ground uplift rates are also the same as the groundwater table rises at the same height. Therefore, the analysis reveals that the vertical-lateral thickness variations of the Holocene deposits provide basic geological condition for the development of land subsidence or surface uplifting in Xi'an (Amelung et al. Citation1999).
Figure 8. The mechanism map of land subsidence and ground fissure activities in Xi'an. Loess ridge and tectonic depression area are divided by fault, yet the fault does not cut off the ground surface. The fault is characterized by broken soil with low bearing capacity and controls the development of ground fissure. On the basis of the InSAR monitoring, the land subsidence rate in the tectonic depression area is bigger than that in loess ridge, which could further take shape ground fissure belt due to much larger additional stress field arising in tectonic depression area.
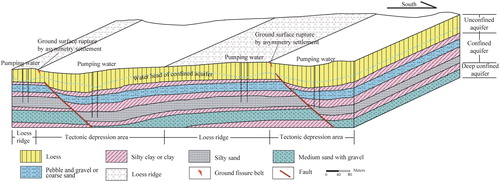
Ground fissure belts are controlled by normal faults and also are the boundary of footwall (loess ridge) and hanging wall (tectonic depression area). Because of hanging wall declining, the soil in hanging wall is much looser than that in footwall, which also prompts ground fissure belts to be much unsteady (Zhang Citation1986; Dai Citation2009; Li Citation2014). However, their abnormal activities are mainly brought about by over-exploitation of groundwater giving rise to asymmetry subsidence. demonstrates that there is much thicker loess soil mixed with sand in the tectonic depression area, and thence a much larger compression in tectonic depression area could happen when the groundwater table is going down, which could cause much larger additional stress field arising in tectonic depression area. By overlaying the original stress field created by the fault, the additional stress field could make ground fissure belts extremely active, manifesting as ground surface rupture () (Jiang et al. Citation2010).
5.2. Land subsidence, ground fissure and groundwater
The land subsidence bowls in Xi'an were spatially identical with but temporally later than the confined aquifer falling cone, and most land subsidence could be ascribed to the falling confined water table.
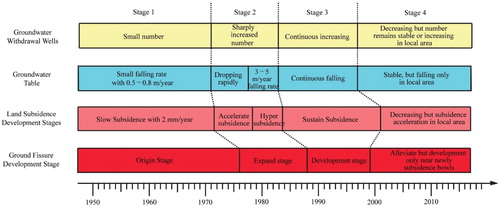
Many literatures (Dai Citation2009; Shi Citation2009; Li Citation2014; Peng et al. Citation2016) introduced that Xi'an land subsidence, ground fissure and groundwater exploitation all began in the 1950s and had a close relationship (). Groundwater exploitation experienced a small amount of exploitation, a wide range of excessive exploitation, continuous exploitation and restricted exploitation. At the beginning of the groundwater exploitation, few water wells and lower exploitation volume had made confined water table fall slowly. After the 1970s the number of self-provided wells drastically increased, which led to the groundwater exploitation rising sharply. Four cone-shaped groundwater tables were formed with the maximum falling rate of >5 m/year in the northeast, southwest and south suburbs. The Xi’an government begun to strengthen groundwater exploitation management and the number of newly digging wells was decreasing after 1985, but the number of groundwater-exploiting wells was still increasing. And this caused the confined water level to decline continuously. Since 1997 due to Xi'an water-supplying engineering from Black River carried out (The Memorabilia about Xi'an Water-Supplying Engineering from Black River Citation2001), some self-provided wells have begun to be shut down year by year, so the confined water table is stable in most areas and even has experienced a significant uplift in some other areas. However, in some urban villages, like Yuhuazhai, Zhangbagou and Nanshanmenkou, groundwater exploitation intensity has been relatively large (). Accordingly, the land subsidence and ground fissure also went through four stages that are origin stage, expand stage, sustain stage and decreasing but local acceleration stage () (Wang Citation2008; Dai Citation2009).
Figure 9. The history of groundwater withdrawal wells and groundwater table, leading to accordingly land subsidence and ground fissure development stages in Xi’an.
Since 2002, land subsidence in urban area has basically disappeared but there has still been serious land subsidence and ground fissure in the south and southwest of Xi'an. Because Yuhuazhai-Nanyaotou, Zhangbagou-Ganjiazhai, Nanshanmenkou, Dongsanyao-Qujiangchi and Lujiazhai-Dengjiapo subsidence bowls comprise multiple urban villages and these urban villages are characterized with dense populations, relatively backward conditions and most living water from self-provided wells, the groundwater table has been still falling at a rate of 5 m/year (Dai Citation2009). On the other hand, large-scale urban construction is another main reason for land subsidence. Qujiang New District, locating at the southeast of Xi'an, has built a series of large projects since 2002, such as the North Square of Wild Goose Pagoda, the Tang Paradise and so on. The increasing project load over cohesive loess with low bearing capacity has led to aggravate the land subsidence within Nanshanmenkou, Maopo, Dongsanyao and Qujiangchi (Wang Citation2008).
6. Conclusions
By the multi-temporal differential SAR Interferometry technique, it can be found that there still have been five larger-scale land subsidence bowls in the southern and southwestern suburbs of Xi'an. Yuhuazhai-Nanyaotou subsidence bowl as the greatest subsidence bowl in Xi'an, the area that subsidence rate was above 50 mm/year in 2017 was up to 10.64 km2. Because there is much thicker clay soil in tectonic depression area, these subsidence bowls have closely correlation with tectonic depression area. The decisive triggering mechanism of land subsidence is yet the over-exploitation groundwater.
Ground fissure belts in Xi'an are controlled by tectonic faults and are generally the boundary between loess ridge and tectonic depression area. But their abnormal activities are also brought about by great asymmetry settlement due to large-scale groundwater exploitation. At the north edge of Yuhuazhai-Nanyaotou Subsidence Bowl, the subsidence gradient of ground fissure belt f4 reached the maximum, up to 0.012% in 2017.
The results of this study scientifically and comprehensively summarize the spatial-temporal variations of five land subsidence bowls and the correlations between land subsidence, surface uplifting, ground fissure belts and geology structure of Xi'an under certain circumstances of anthropic activities. The InSAR results could roughly deduce the groundwater table variation and timely adjust the groundwater exploitation program. In addition, the functional relationship between surface deformation and groundwater table variation can be established based on physical mechanics parameters of corresponding soil, and this needs to further research in the future.
Acknowledgments
Envisat, Radarsat-2 and Sentinel-1 SAR data are respectively provided by ESA and MDA. They were processed based on Gamma software of Switzerland Gamma Remote Sensing coupled with SRTM DEM (http://srtm.csi.cgiar.org/SELECTION/inputCoord.asp) in order to retrieve those time-series subsidence rates. We also thank Tao Hong from Shanxi Institute of Geo-Environment Monitoring for field investigation and useful suggestions.
Additional information
Funding
Related Research Data
References
- Amelung F, Galloway DL, Bell JW, Zebker HA, Laczniak RJ. 1999. Sensing the ups and downs of Las Vegas: InSAR reveals structural control of land subsidence and aquifer-system deformation. Geology. 27(6):483–486.
- ASAR Product Handbook of Envisat. 2007. Available online: https://earth.esa.int/pub/ESA_DOC/Envisat/ASAR/asar.ProductHandbook.2_2.pdf.
- Berardino P, Fornaro G, Lanari R, Sansosti E. 2002. A new algorithm for surface deformation monitoring based on small baseline differential SAR interferograms. IEEE Trans Geosci Remote Sens. 40(11):2375–2383.
- Cabral-Cano E, Dixon TH, Miralles-Wilhelm F, Diaz-Molina O, Sanchez-Zamora O, Carande RE. 2008. Space geodetic imaging of rapid land subsidence in Mexico City. Geol Soc Am Bull. 120(11–12):1556–1566.
- Dai HT. 2009. Physical model test on Xi'an land subsidence study [dissertation]. Chang'an University; p. 1–31.
- Emardson TR, Simons M, Webb FH. 2002. Neutral atmospheric delay in interferometric synthetic aperture radar applications: statistical description and mitigation. Geophys Res Lett. 108(B5):2231–2239.
- Ferretti A, Prati C, Rocca F. 2001. Permanent scatterers in SAR interferometry. Proceedings of the 2001 IEEE International Conference on Geoscience and Remote Sensing Symposium; Sydney, Australia.
- Ge DQ, Wang Y, Guo XF, Fan JH, Liu SW. 2008. Surface deformation field monitoring by use of small-baseline differential interferograms stack. J Geod Geodyn. 28:61–66.
- Ge DQ, Wang Y, Guo XF, Liu SW, Fan JH. 2007. Surface deformation monitoring with multi-baseline D-InSAR based on coherent point target. J Remote Sens. 11:574–580.
- Giuseppe C, Cristiano T, Carlo AB, Rocco D. 2015. InSAR time series analysis of natural and anthropogenic coastal plain subsidence: the case of Sibari (Southern Italy). Remote Sens. 7:16004–16023.
- Heleno SIN, Oliveira LGS, Henriques MJ, Falcão AP, Lima JNP, Cooksley G, Ferretti A, Fonseca AM, Lobo-Ferreira JP, Fonseca JFBD. 2011. Persistent scatterers interferometry detects and measures land subsidence in Lisbon. Remote Sens Environ. 115(8):2152–2167.
- Jiang ZW, Peng JB, Wang QY. 2010. Influence of pre-existing fault on ground fissures during pumping action. J Eng Geol. 18:651–656.
- Kim JW, Lu Z, Degrandpre K. 2016. Ongoing deformation of sinkholes in Wink, Texas, observed by time-series sentinel-1A SAR interferometry (preliminary results). Remote Sens. 8:1–11.
- Lee WJ, Lu Z, Jung HS, Ji LY. 2017. Measurement of small co-seismic deformation field from multi-temporal SAR interferometry: application to the 19 September 2004 Huntoon Valley earthquake. Geomat Nat Hazards Risk. 8(2):1241–1257.
- Li YP. 2014. Research on the groundwater dynamic and groundwater supply security of Xi'an area [dissertation]. Chang'an University; p. 15–66.
- Lu Z, Wicks C. 2010. Characterizing 6 August 2007 Crandall Canyon mine collapse from ALOS PALSAR InSAR. Geomat Nat Hazards Risk. 1(1):85–93.
- Mora O, Mallorqui J, Broquetas A. 2003. Linear and nonlinear terrain deformation maps from a reduced set of interferometric SAR images. IEEE Trans Geosci Remote Sens. 41(10):2243–2253.
- Peng JB, Sun XH, Wang W, Sun GC. 2016. Characteristics of land subsidence, earth fissures and related disaster chain effects with respect to urban hazards in Xi'an, China. Environ Earth Sci. 75:1189–1205.
- Qu FF, Zhang Q, Lu Z, Zhao CY, Yang CS, Zhang J. 2014. Land subsidence and ground fissures in Xi'an, China 2005–2012 revealed by multi-band InSAR time-series analysis. Remote Sens Environ. 155:366–376.
- Radarsat-2 Satellite Characteristics. 2015. Available online: http://www.asc-csa.gc.ca/eng/satellites/radarsat/radarsat-tableau.asp.
- Sara F, Silvia B, Sandro M. 2015. Landslide inventory updating by means of Persistent Scatterer Interferometry (PSI): the Setta basin (Italy) case study. Geomat Nat Hazards Risk. 6(5–7):419–438.
- Sentinel-1 User Handbook. 2013. Available online: http://docplayer.net/35429244-Sentinel-1-user-handbook.html.
- Shi M. 2009. The development condition and section structure characteristic of Xi'an ground fissures [dissertation]. Chang'an University; p. 10–26.
- Suo CM, Wang DQ, Liu ZZ. 2005. Land fracture and subsidence prevention in Xi'an. Quat Res. 25:23–28.
- Tesauro M, Berardino P, Lanari R, Sansosti E, Fornaro G, Franceschetti G. 2000. Urban subsidence inside the city of Napoli (Italy) observed by satellite radar interferometry. Geophys Res Lett. 27(13):1961–1964.
- The Memorabilia about Xi'an Water-Supplying Engineering from Black River. 2001. Available online: http://news.sohu.com/79/06/news147550679.shtml.
- Wang JM. 2000. Theory of ground fissures hazards and its application. Vol. 1. Xi’an: Shaanxi Science and Technology Press; p. 389–408.
- Wang J. 2008. Analysis of the genetic mechanism of ground fractures along Xi'an subway line 2 [dissertation]. Chang'an University; p. 19–49.
- Wang XY, Zhang JQ, Zhang Q, Zhao CY. 2016. Inferring multi-dimensional deformation filed in Xi'an by combing InSAR of ascending and descending orbits with GPS data. Acta Geod Cartogr Sin. 45:810–817.
- Wegmuller U, Walter D, Spreckels V, Werner C. 2010. Nonuniform ground motion monitoring with TerraSAR-X persistent scatterer interferometry. IEEE Trans Geosci Remote Sens. 48(2):895–904.
- Zebker HA, Rosen P, Hensley S. 1997. Atmospheric effects in interferometric synthetic aperture radar surface deformation and topographic maps. J Geophys Res. 102(B4):7547–7564.
- Zhang JM. 1986. The structural features and the genetic mechanism of the surface crack belt in Xi'an, Shanxi Province. Geol Shaanxi. 4:11–20.
- Zhang Q, Zhao CY, Ding XL, Chen YQ, Wang L, Huang GW, Yang CS, Ding XG, Ma J. 2009. Research on recent characteristics of spatio-temporal evolution and mechanism of Xi'an land subsidence and ground fissure by using GPS and InSAR techniques. Chin J Geophys. 52:1214–1222.
- Zhao CY, Zhang Q, Ding XL, Qu W. 2009. Positioning of Xi'an active ground fissures with SAR interferometry. Geomat Inf Sci Wuhan Univ. 34:809–813.