
 ?Mathematical formulae have been encoded as MathML and are displayed in this HTML version using MathJax in order to improve their display. Uncheck the box to turn MathJax off. This feature requires Javascript. Click on a formula to zoom.
Abstract
To assess which data type is more effective for spatial modeling in the Republic of Korea, we conducted geostatistical analysis based on frequency, intensity, and spatial autocorrelation using two types of forest fire occurrence data: that collected through field survey of the Korea Forest Service (KFS) and satellite active fire data of Moderate Resolution Imaging Spectroradiometer (MODIS). The maximum entropy (MaxEnt) model was used with environmental factors in the spatial modeling of fire probability to compare the accuracy of the two data types based on 10 years of historical data. The results showed a clear difference in fire frequency and similar fire intensity patterns. The spatial autocorrelation between the fire frequency and intensity of the two data types was analyzed using a semi-variogram. Fire intensity was significantly correlated, with the MODIS data having a higher correlation than the KFS data. Examination of the spatial autocorrelation and related factors by fire source also indicated that MODIS data had higher spatial autocorrelation, with remarkable distinction found in climate factors. In spatial the modeling, MODIS data showed a similar outcome to that of hotspot analysis, with higher accuracy and better model performance attributable to high spatial autocorrelation. Even though the KFS data were collected from post-fire surveys, they resulted in low spatial autocorrelation and reduced model accuracy owing to the wide distribution of data. MODIS had many detection errors. With spatial filtering, however, the model accuracy can be improved with relatively high spatial autocorrelation.
1. Introduction
Forest fires pose a serious threat to the environment. As well as having adverse effects on soil, water resources, and the atmosphere to cause rapid changes in the overall functions and processes of forest ecosystems, forest fires also threaten public health and human life (Reid et al. Citation2016; Ambrey et al. Citation2017). Climate change makes our environment increasingly vulnerable to devastating forest fires; this tendency is expected to increase substantially in the future (Goldammer et al. Citation2013).
Climate change-induced forest fire is an active research topic worldwide (Sung et al. Citation2010; Jolly et al. Citation2015). Multiple studies have indicated that climate change-induced environmental changes such as increases in temperature and precipitation variability are highly likely to alter the frequency and intensity of forest fires (Piñol et al. Citation1998; Flannigan et al. Citation2000; McCoy and Burn Citation2005). Furthermore, increases in the amounts of greenhouse gases and other aerosols from forest fire emissions and changes in the surface reflectance induced by fires contribute to ongoing climate change (Clark et al. Citation1996; Randerson et al. Citation2006). Data collection on the actual location of fires is a prerequisite for strategic identification of climate change effects on forest fires and forest fire risk zones (Wotton et al. Citation2010; Barbero et al. Citation2015).
Thus far, this geographic information has been collected largely by post-fire field survey, most of which aims to examine the causes and effects of forest fires and are usually recorded in the form of a postal address, thus lacking precise ignition point information (Lee et al. Citation2006; Kwak et al. Citation2012). Moreover, countries with poor infrastructure are often unable to conduct their own field surveys (Kharuk et al. Citation2016; Tien Bui et al. Citation2016), which makes it difficult to obtain basic historical data on previous fire sources, thus restricting their accurate prediction.
To overcome such limitations, complementary approaches are introduced to identify fire locations and to detect burned areas by utilizing a variety of satellite images and remote sensing methods. Fire data products are currently accessible online, enabling access to timely information worldwide (Sunar and Özkan Citation2001; Roy et al. Citation2008). Moderate Resolution Imaging Spectroradiometer (MODIS) and active fire data from Visible Infrared Imaging Radiometer Suite (VIIRS) are the two most widely used satellite-based wildfire monitoring systems, with data archived since November 2000 and January 2012, respectively (Schroeder et al. Citation2014; Giglio et al. Citation2016). Although it is possible to extract specific data directly from satellite images at middle or high resolution, this task is difficult and time-consuming at a wide regional levels.
Prediction of fire probability requires spatial autocorrelation of fire sources, identification of accurate fire locations, and selection of appropriate environmental factors (Chou et al. Citation1990; Kwak et al. Citation2012; Oliveira et al. Citation2012). Spatial autocorrelation is a critical factor in raising the accuracy of spatial models because it facilitates prediction of certain emerging species and outbreaks of certain natural disaster types (Austin Citation2002; Boria et al. Citation2014). In the Republic of Korea, hereafter referred to as South Korea, Kim et al. (Citation2011) identified the spatial autocorrelation of a large city based on fire occurrence frequency, and Kwak et al. (Citation2012) contributed to increased accuracy in predicting fire occurrence probability.
South Korea’s fire archival information system offers post-fire field research, enabling easier access to data than that using satellite-based fire information systems. Thus, the former system has been used more often in research such as spatial statistical analysis and spatial modeling; few studies have incorporated data from the latter (Lee et al. Citation2006; Kim et al. Citation2011; Kwak et al. Citation2012). Considering that most forest fires in South Korea have unnatural causes and that these fires have increasingly grown into mega-fires in recent times (KFS 2016), increased fire risk is evident. Many researchers have attributed this to climate change and socio-environmental factors and have concluded that more accurate information is needed for timely response (Wotton et al. Citation2003; Chuvieco et al. Citation2014). The spatial correlation of ground data must be identified before fire occurrence probability is modeled and predicted (Boria et al. Citation2014). As such, South Korea is a good example for a case study, with databases of both field research data and readily available satellite-based information as well as precedent research.
In this study, geostatistical analysis is conducted using the two types of fire occurrence data, field research and satellite observation, to assess which type is more effective for spatial modeling. To this end, the occurrence frequency and intensity patterns of forest fires in South Korea during the recent decade are identified, and the spatial autocorrelation of forest fire occurrences is evaluated. Moreover, the model adequacy is assessed by using both data types via additional spatial statistical analysis based on historical data of fire sources and major environmental factors affecting forest fires. The maximum entropy (MaxEnt) model and environmental factors are used for spatial modeling of fire occurrence probability to compare the prediction capacities of the two approaches. The findings from this study provide scientific and practical information for modeling forest fire occurrence probability, particularly in selecting and processing fire location information at a regional level, and enables such modeling by regions having little to no field data.
2. Data and methods
2.1. Study hierarchy
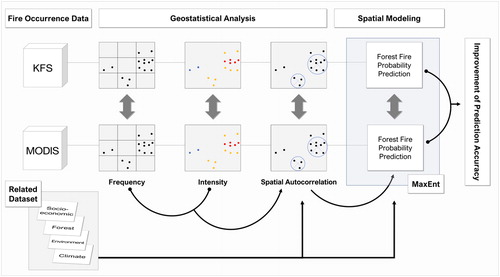
shows the research flow of this study. We selected two forest fire occurrence datasets of South Korean forest fires in addition to a related dataset for geostatistical analysis and spatial modeling of forest fire occurrence probability. In the research framework, four analysis steps are conducted and are compared with two approaches in each step to improve the spatial modeling method. A detailed explanation of each component is described in the figure.
Figure 1. Schematic diagram of the applied methodology.
2.2. Study area
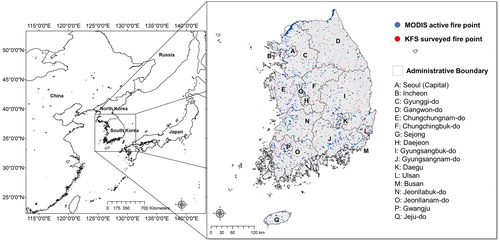
This study was performed throughout South Korea (). The study area, spanning approximately 100,000 km2 and located above the equator in the mid-latitude of Eastern Asia, is affected by a warm monsoon climate with large seasonal variations in precipitation. Humid summers with concentrated rainfall contrast with dry winters and springs that exacerbate frequent occurrences of small and large fires between February and May; this period has been designated by the Korea Forest Service (KFS) as the official forest fire danger alert season (Lim et al. Citation2017a). Large forests in South Korea were devastated by overexploitation prior to the 1960s. Through successful implementation of national restoration projects, more than 60% of the mostly mountainous country is now covered by thick forests (Kim et al. Citation2017). Areas with high population density and high urbanization rates are distributed mainly in the Seoul metropolitan area, which is the national capital, and in the southeastern provinces. The rest of the country’s land use consists mostly of forest and agricultural lands. On average, 200–500 forest fires of various sizes occur annually in South Korea, mostly during the official forest fire danger alert season.
Figure 2. Study area with administrative boundaries and forest fire point data from two sources.
2.3. Forest fire occurrence data
2.3.1. KFS surveyed forest fire data
The KFS fire location data used here encompass 10 years of forest fire statistics in South Korea recorded from 2007 to 2016 (KFS 2016). The KFS updates the database annually on its official website based on the findings of its regular post-fire field surveys. The database includes the geographical locations of ignition points, ignition timing, extinguish date, damaged area, property loss including monetary loss, fire cause, meteorological factors of the affected site, and other parameters. The fire occurrence spots were spatially extracted from the dataset in ArcGIS 10.3. Here, ‘spot’ refers to a virtual point of an outbreak location in terms of the national land lot number system.
2.3.2. MODIS active fire data
MODIS active fire data are generated on the basis of a contextual algorithm, where thresholds are applied to the observed mid-infrared and thermal infrared brightness temperature of fires detected by Terra and Aqua MODIS satellite channels (Giglio et al. Citation2016). An active fire product is identified from fire data remotely sensed by satellites at a spatial resolution of 1 km pixels that are reprocessed by a series of tests, masking, additional corrections, and rejection of false alarms to refine and improve the prediction accuracy (Fornacca et al. Citation2017).
Of the various MODIS active fire products, MCD14DL was selected in this study because it provides all fire information of Terra and Aqua satellites in a variety of formats including shapefile, KML, and CSV. MCD14DL contains geographic locations, dates, confidence levels, fire radiative power (FRP), and other information obtained by satellite sensors. For further reference, data, a user’s manual, and details of the algorithm can be downloaded as of 22 March 2017, from the official website of the Fire Information for Resource Management System (FIRMS) of the National Aeronautics and Space Administration (NASA) at https://firms.modaps.eosdis.nasa.gov/. It should be noted that some remote sensing products including MCD14DL have limitations such that cloud cover affects the detection rates and different temporal resolutions affect accurate fire detection. Therefore, this study also used the latest publically available version of MODIS active fire products, Collection 6, which covers all types of fires occurring in 2007–2016. This period is the same as that included in the KFS fire survey data.
2.4. Geostatistical analysis
2.4.1. Frequency and hotspot analysis
Two types of analyses were conducted in this study to analyze the spatial characteristics of fire occurrence and fire intensity by using MODIS active fire data and KFS fire survey data of the last decade. Following Kim et al. (Citation2011) and Kwak et al. (Citation2012), our study area was reorganized into a grid form of 5 km ×5 km boxes. The fire occurrence frequency was calculated by counting the number of fires within each box.
Next, fire intensity was analyzed using the optimized hotspot method. In this process, ‘damaged area’, which indicates the extent of area burned by forest fire in one event, was selected as an indicator for estimating fire intensity from the KFS data. FRP, which indicates the scale of a forest fire, was used to estimate the fire intensity from the MODIS data. The damaged area and FRP represent the fire intensity of each fire occurrence (Kwak et al. Citation2012; Giglio et al. Citation2016). All analyses were performed using the optimized hotspot analysis tool included ArcGIS 10.3. The results identified statistically significant spatial clusters of high and low values referred to as hotspots and coldspots, respectively (Ord and Getis Citation2010; Gao et al. Citation2016).
2.4.2. Spatial autocorrelation analysis using semi-variogram
We used the two data types to identify the spatial distribution characteristics of forest fire occurrence points through spatial autocorrelation analysis using a semi-variogram to identify the relationship strength of variables in two different spots. This representative geostatistical tool was used to find the spatial autocorrelation of fire frequency, intensity, and other environmental factors present at the fire ignition points (Kim et al. Citation2011; Kwak et al. Citation2012; Lim et al. Citation2015a).
Using h to represent the distance between datasets, n to represent the number of datasets, r to represent semi-variance, z to represent the data value at a random point specified as x, the semi-variogram is thus specified as
(1)
(1)
In a semi-variogram, semi-variance is an expected value of the squared deviations of two values separated by distance h. From this perspective, variables with small (large) distances are considered to have less (greater) variability and to be similar (different) with low (high) semi-variance (Lim et al. Citation2015b). In addition, the value at which the variance between the variables first flattens out is referred to as the sill, and the lag distance in which the model first flattens out is known as the range. Theoretically, the sill is equivalent to the dispersion variance, and the range is co-related to the distance between the data. The value at which the semi-variogram begins is the nugget, and the sill minus the nugget is referred to as the partial sill (Kim et al. Citation2011). Accordingly, when the range value is high, the data of the relevant area are widely related to each other. Therefore, a high range value could indicate high spatial variance and relatively low spatial autocorrelation. In addition, a high partial sill value could indicate high spatial variance; however, this depends on the unit, and it is difficult to compare items in different units.
In the semi-variogram graph, the X-axis and the h value indicate the distance between each data point, where (+) points are the averaged distance of each point, and (-) is the predicted line based on distance.
2.5. Related factors of forest fire
In this study, eight related factors were adopted for spatial modeling of fire occurrence probability including four meteorological factors and four socio-environmental factors ().
Table 1. Description of related factors used this study.
For this purpose, 10 years of historical meteorological data from 2007 to 2016 were obtained from the official website of the Korea Meteorological Administration (KMA), which offers data collected via approximately 90 nationwide stations of the Automated Surface Observing System (ASOS). Along with these data, each variable was used including mean temperature, accumulated precipitation, mean relative humidity, and maximum wind speed. Then, the value of effective humidity, which shows higher correlation with fire occurrence than relative humidity, was calculated by using the variable of relative humidity and the following equation:
(2)
(2)
where r = 0.7 and H0, H1, H2, H3, and H4 are the relative humidity on a particular day, the previous day, two days prior, three days prior, and four days prior, respectively.
Using the meteorological data, spatial data were interpolated with inverse distance weighting (IDW), which is a spatial analyst tool in ArcGIS 10.3.
The socio-environmental factors used in this study have been discussed in previous research such as Kwak et al. (Citation2012) and Vilar et al. (Citation2016), which demonstrated a high correlation with actual fire occurrence. Population density and the distance to roads were used as social factors. The population density layer was created spatially using data from the 2015 population and housing census conducted by the Korea National Statistical Office. The layer showing distances to each road was calculated by using the 2015 digital road map with nodes and links of national roads archived by the Ministry of Land, Infrastructure and Transport (http://nodelink.its.go.kr/). In addition, all digital data related to forest factors were obtained from the forest tree distribution data, which were derived from the forest type maps by KFS, and the national protected areas by the Ministry of Environment. The current tree species distributions were mapped as four forest types: coniferous, deciduous, mixed forest, and non-forest, whereas the national protected areas were mapped by protected areas including national and provincial parks and other area types. All related factors were represented as rasters with a spatial resolution of 1 km2 for use in the spatial modeling of fire occurrence probability.
2.6. Spatial modeling technique using MaxEnt
Of the many algorithm methods used for species distribution modeling, Maximum Entropy (MaxEnt) has proven statistical power, specifically in computing the probability distribution of a certain species with presence-only occurrence data (Phillips et al. Citation2006; Elith et al. Citation2011).
Similar to regression analysis, MaxEnt has higher accuracy than other common approaches in predicting occurrence. As the dependent variable, this method requires data of species occurrence, or geographic data, whereas environmental factors such as meteorology, altitude, and topography are used as independent variables. The discrimination capability of the models was evaluated considering the area under the curve (AUC), specifically the area under the receiver operating characteristic (ROC) curve. The explanatory power of a model is usually considered to be high when the AUC value exceeds 0.7 (Phillips and Dudík Citation2008). The resulting response curves enable prediction of the probability of species occurrence along with locations as well as correlation between the modeled species and certain environmental factors.
Although not intended for predicting forest fire occurrence, MaxEnt has been shown to have great potential for national-scale occurrence probability modeling when accurate location data are available (Elith et al. Citation2011; Vilar et al. Citation2016; Lim et al. Citation2018) and is a good option when considering climate change effects. An increasing number of studies worldwide have predicted the potential occurrences of forest disasters such as landslides and fires using species distribution modeling (SDM; Kim et al. Citation2015; Vilar et al. Citation2016). This study also applied MaxEnt to spatial modeling of fire occurrence probability, with fire occurrence data as the dependent variable and environmental factors as the independent variables.
For this study, the model operation options were set to create differentiated response curves by input factors and by fire occurrence variables. In addition, the maximum number of iterations was set at 5000 to reduce random variable uncertainty, with the number of replicates set at 15. Logistic was used as the output format.
3. Results and discussion
3.1. Frequency and intensity analysis of multiple forest fire occurrence data in South Korea
On the basis of the 5 km2 grid-based cumulative fire counts, forest fire occurrence frequency was analyzed for both datasets. For the MODIS data, most fires occurred around the border area with North Korea, hereafter referred to as Democratic People’s Republic of Korea (DPRK), followed by metropolitan areas and agricultural areas (). Such an outcome may have occurred because MODIS fire detection includes man-made ignitions in military zones, most of which are not reported, or heat power in agricultural and industrial areas. The KFS data showed even distribution of values throughout the peninsula, most of which were concentrated in the Seoul metropolitan area and its southeastern provinces and other major inland cities (). This indicates a fire concentration tendency in large cities along with a broad nationwide distribution of fire sources.
Figure 3. Forest fire occurrence frequency on a 5-km2 grid (a: MODIS active fire data and b: KFS fire survey data).
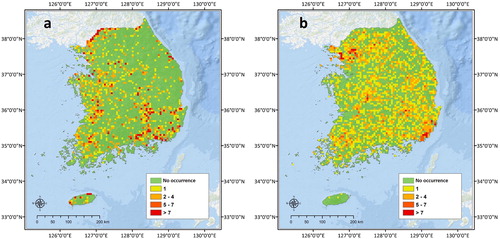
Although the two datasets have different patterns in fire occurrence, they share a similar tendency of fire concentration around large urban areas. This indicates that most fires in South Korea tend to occur in forest areas with easy accessibility.
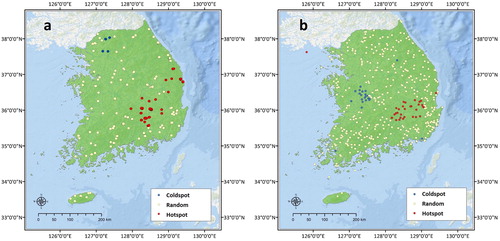
An optimized hotspot cluster analysis was conducted on both datasets to identify the spatial patterns of fire intensity. The hotspot analysis on the MODIS data using FRP revealed rather dense hotspots within and around the DPRK border area, which is similar to the patterns indicated in the fire frequency analysis. However, considering that the patterns were attributed mainly to military exercises and drills, hotspots in the border areas were not considered in this study. Excluding these border areas, the analysis revealed distinct hotspot patterns in the three regions: Daegu metropolitan city, Gyeongsangbuk-do Province, and parts of the eastern coast areas in South Korea. Moreover, obvious coldspots were detected in three other regions: the Seoul metropolitan area and the western and southern coastal areas (). This means that low-intensity fires have occurred repeatedly in these regions. According to the KFS data hotspot analysis using damaged areas as the indicator of fire intensity, fire sources were spread throughout South Korea; however, low rates of hotspots and coldspots were indicted. Similar to the MODIS analysis results, hotspots were identified in the Gyeongsangbuk-do Province and parts of the eastern coastal areas in South Korea. The regions of the Seoul metropolitan area and the southeastern metropolitan areas were identified as coldspots despite showing the highest fire frequency (). Overall, the hotspot analysis by damaged areas revealed a different pattern from that of the frequency analysis, revealing that the two databases share significant common ground with respect to the optimized hotspot analysis.
Figure 4. Forest fire hotspot analysis by fire intensity (a: MODIS active fire data and b: KFS fire survey data).
Owing to uncertainty in the detection by satellite and the data characteristics regarding all type of fires, the fire occurrence data had to be re-analyzed through correction with high accuracy and high intensity fire parameters; spatial filtering was used to remove nonforest areas. To this end, the MODIS data were adjusted to include only forest fire sources, such as fire occurring in forest land according to land cover maps, and higher confidence levels and FRPs of >70% and >10, respectively. As a result, only 217 points were extracted from a total of 6825. These correction procedures were also applied to the KFS data. These data were refined into forest fire sources with at least more than 1 ha of damaged area, resulting in 446 points out of 3854.
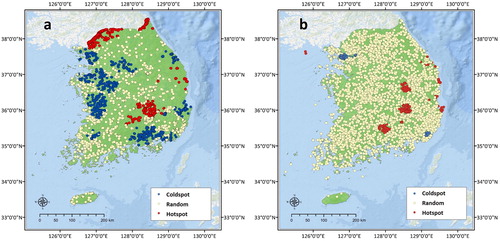
The results of hotspot re-analysis with modified data showed a significant decrease in redundant hotspots and coldspots when filtering the regions; the hotspots in Daegu metropolitan city, Gyeongsangbuk-do Provinces, and eastern coastal areas were more pronounced. A similar trend was observed in the re-analysis of KFS data. Significant hotspots were indicated, whereas other areas had random value distributions (). Among the spatial characteristics of forest fire occurrences, a clear difference was identified in fire frequency; no significant distinction was found in fire intensity. However, the results did show similar trends when comparing the analysis outcomes extracted by higher intensity values.
Figure 5. High-intensity forest fire hotspot analysis by fire intensity (a: MODIS active fire data and b: KFS fire survey data).
Similarity was observed in the hotspot analysis rather than the frequency analysis in the geostatistical analysis of both datasets, and the similarity was increased in the forest fire data extracted with high intensity. Essentially, the KFS data, which were collected from post-fire field surveys, had higher accuracy than other types of data. Thus, the KFS data are good reference sources for improving the accuracy of MODIS data because the limitations are compensated by the detection precision. This is expected because the hotspot analysis using MODIS data modified by such factors as land cover, confidence level, and FRP produced outcomes similar to those using KFS data.
3.2. Spatial autocorrelation of forest fire frequency and intensity
Next, the spatial autocorrelation between locations was examined in terms of fire intensity using the same fire data as those used in the previous analysis, in which the data obtained from a 5 km ×5 km grid were extracted by fire frequency and fire intensity. With respect to fire frequency, the shapes of the semi-variograms did not form a curve in either case, with considerable range values of 417 km for MODIS and 444 km for KFS. Therefore, both cases had very low correlation among the point values, which were randomly distributed throughout the area. The partial sill values for the MODIS data and the KFS data were 116.8 and 0.928, respectively. The partial sill value could not be compared with the spatial variance in both data types owing to unit differences ().
Figure 6. Spatial autocorrelation results by forest fire occurrence frequency (a: MODIS active fire data and b: KFS fire survey data). Note that the range and partial sill values are shown in m.
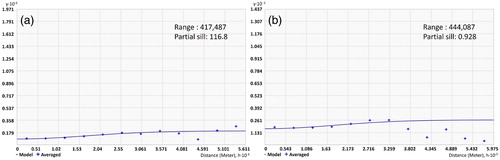
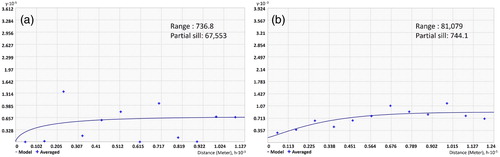
In the spatial autocorrelation analysis using forest fire intensity, a significantly high autocorrelation was identified. Both fire data had curved shapes in their semi-variograms and had a closer range value than that in the analysis of fire frequency. The MODIS range value was about 736 m, showing significantly high spatial autocorrelation. The KFS data also showed a higher level of correlation than that using fire frequency, with a range value of about 81 km. The estimated partial sill values were 67,553 and 744 for the MODIS and KFS data, respectively (). In the case of the partial sill value, it was difficult to directly compare the spatial variance in the different data units. However, the fire intensity data showed higher values than fire frequency in spatial autocorrelation, with MODIS data having values than KFS data. Such results indicate that predicting the occurrence probability using geographic information of forest fire intensity rather than that of fire frequency can improve the spatial accuracy. In terms of fire frequency, the occurrence was too widely distributed and excessively low spatial autocorrelation; however, spatial similarity was apparent for fire intensity. Moreover, when applying MODIS data to spatial modeling, the improvement in spatial accuracy can be attributed to higher spatial autocorrelation than that when applying KFS data.
Figure 7. Spatial autocorrelation result by high-intensity forest fire (a: MODIS active fire data and b: KFS fire survey data). Note that the range and partial sill values are shown in m.
3.3. Spatial autocorrelation by related factors in the two data types
The spatial autocorrelation among the eight related factors of forest fire occurrence was analyzed for both types of fire data. First, the semi-variogram was estimated by fire sources from the MODIS data. The range value for rainfall was 191 km, which indicates high relevancy. The other climate factors also showed spatial correlation in a significant range including 14 km for temperature, 21 km for effective humidity, and 63 km for maximum wind speed. However, the socio-environmental factors generally showed narrow range values. The forest type and national protected area, which are the categorical data factors, had very high spatial autocorrelation, with values of 850 m and 12 km, respectively. Similarly, population density and distance to roads, which are related to human accessibility, showed high levels of spatial autocorrelation, at 11 km and 22 km, respectively ().
Figure 8. Spatial autocorrelation results by related factors for the MODIS active fire point data (a: rainfall, b: temperature, c: effective humidity, d: maximum wind speed, e: forest type, f: national protected area, g: population density, and h: distance from road). Note that the range and partial sill values are shown in m.
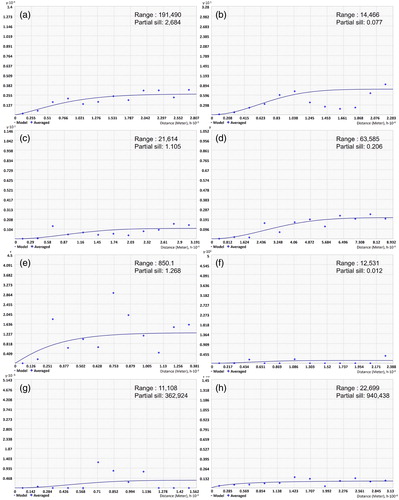
The results of semi-variogram estimation for the KFS data showed that the climate factors had considerably lower values of spatial autocorrelation. In such factors as rainfall, temperature, and effective humidity, the range values were formed at the farthest point at 649 km, which means that the spatial autocorrelation of all three factors was almost equivalent to zero. In the case of maximum wind speed, the range value was 203 km, which is very low but sufficient to be correlate with other variables. On the contrary, the socio-environmental variables all showed high spatial autocorrelation at levels similar to that of the MODIS data: 17 km, 41 km, and 5 km for forest type, national protected area, and population density, respectively. Only the range value for the distance to roads showed low autocorrelation, at 221 km ().
Figure 9. Spatial autocorrelation results by related factors for the KFS surveyed fire point (a: rainfall, b: temperature, c: effective humidity, d: maximum wind speed, e: forest type, f: national protected area, g: population density, and h: distance from road). Note that the range and partial sill values are shown in m.
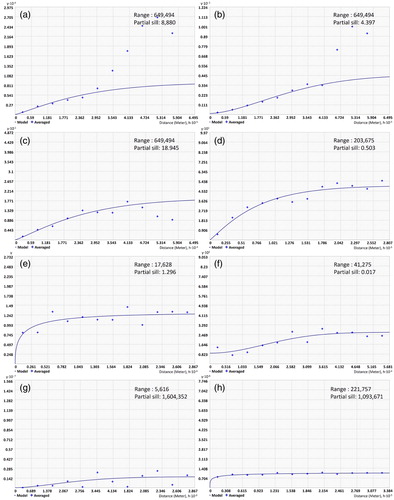
The spatial autocorrelation difference in the related factors for both types of data can influence the spatial modeling of fire occurrence probability (Chou et al. Citation1990; Dormann Citation2007). In particular, the spatial autocorrelation of climate factors, which showed the most significant levels of differences, can produce different results when modeling the effects of climate change on forest fires (Gedalof et al. Citation2005). That is, the KFS data may cause unfavorable results in estimating spatial distribution at a statistically significant level when climate factors are used in spatial modeling.
3.4. Comparison of the two approaches using estimated forest fire occurrence probability
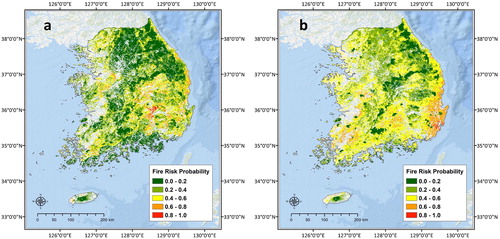
Comprehensive probability modeling of forest fire occurrence was conducted using both types of fire data, the aforementioned eight related factors, and the MaxEnt model. Spatial comparison of the two modeling results found that in the analysis of MODIS data, high probability areas were distributed mainly in the Daegu metropolitan city, Gyeongsangbuk-do, and the eastern coastal area. In other areas, high probability appeared in some parts adjacent to urban areas. In the case of the inland mountainous areas, where the forests are concentrated, the fire occurrence probability was found to be very low. The results of using KFS data showed high probability areas distributed mainly in the southeastern metropolitan area, with mid-level probability zones evenly spread nationwide (). This result is attributed to the even distribution of KFS data across South Korea. Compared with the hotspot analysis, the results from the MODIS data were closer to those of the hotspot analysis. That is, in the hotspot analysis, Daegu metropolitan city, Gyeongsangbuk-do, and the eastern coastal areas were classified as high risk areas by both data; these areas were predicted to be high probability area in the spatial modeling results of only MODIS data. This means that forest fire occurrence probability based on MODIS data is more effective in terms of fire intensity.
Figure 10. Spatial modeling results of forest fire occurrence probability (a: MODIS active fire data and b: KFS fire survey data).
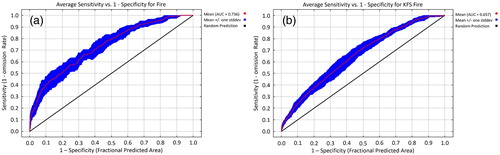
Comparison of the statistical accuracy of the two data types through AUC value and ROC curves revealed higher accuracy of the MODIS data, with AUC values of 0.738 and 0.657 for MODIS and KFS, respectively (). This might have occurred because the fire source data with high spatial correlation also showed high statistical significance when the related factors were applied. In SDM via MaxEnt, AUC values of 0.8–0.9 were easily obtained, although in natural disaster modeling, the AUC values decreased owing to the complexity of disaster occurrences (Vilar et al. Citation2016; Lim et al. Citation2018). In short, the MODIS data approach was shown to be effective in estimating forest fire occurrence probability considering the model’s capacity to accurately predict at the AUC >0.7 level (Phillips and Dudík Citation2008).
Figure 11. Evaluation of spatial modeling performance for forest fire occurrence probability using ROC and AUC (a: MODIS active fire data and b: KFS fire survey data).
The responses of the eight related factors differed according to the data type. For the MODIS data, values of contribution and significance were generally. Among the four climate factors, three were ranked high, with the climate factor showing the highest degree of contribution. On the contrary, the modeling using KFS data showed concentration trends in the national protected area and temperature. Furthermore, the population density and rainfall partly contributed to the results (). The differences in the high probability areas shown in were considered to be derived from the variable contributions shown in . The area in the range of 0.0–0.2 in is mostly national protected area, with the high probability area centered on the southern region in the high temperature zone. On the contrary, , which applies MODIS data, identified only the forest fire hotspots, and no spatial distribution by specific variables.
Table 2. Analysis of factor contributions for spatial modeling of fire occurrence probability (%).
The climate variable must be considered when estimating the occurrence probability because climate is critically important in the outbreaks of large-scale forest fires. The Daegu metropolitan city, Gyeongsangbuk-do, and the eastern coastal area are the representative areas affected by high temperature and low precipitation in the official forest fire danger alert season from February to May. These three regions were all classified as hotspot or high probability area in MODIS, which proved the ability of the analysis to precisely identify areas in which fires caused by climate factors are highly likely to occur.
Overall, from the perspective of statistics and qualitative aspects, fire occurrence probability prediction using MODIS data showed better utility than that using the KFS data. The KFS data clearly have the advantage of being based on actual information. In this study, however, the KFS data adversely affected fire occurrence probability estimation likely because small-scale forest fires are often not detected by satellite. To improve the data accuracy, both data types need extra modification and adjustment. Because most forest fires in South Korea have artificial or man-made origins, precise prediction with the cause fully reflected is limited. However, the application of MODIS data to spatial modeling facilitated good estimation of mega-fires and high probability areas and enabled verification of the satellite-based forest fire data.
3.5. Spatial autocorrelation and fire intensity to improve model performance
The importance of considering spatial autocorrelation has long been addressed by a many studies of species distribution and natural disasters (Austin Citation2002; Dormann Citation2007; Pereira et al. Citation2015; Moris et al. Citation2017). Several previous studies have shown that data with high spatial autocorrelation led to improvement of a model’s predictive performance (Fielding and Bell Citation1997; Dormann Citation2007; Kissling and Carl Citation2008; Kim et al. Citation2016). Our results also showed that high spatial autocorrelation is closely associated with increased model predictive accuracy. KFS data, for example, are usually recognized as definitive data because they are collected from actual post-fire field surveys. In the present study, however, this data hindered the model performance because the data were varied and widely distributed; thus, the spatial autocorrelation was reduced, requiring further data correction processes. Machine learning-based models such as MaxEnt, which was used in this study, have been suggested as useful tools for offsetting spatial autocorrelation issues (Cracknell and Reading Citation2014). However, the two estimated results of forest fire probability were not offset enough. It is suggested that the role of input data might be more significant than the model performance in the case of forest fire where the spatial autocorrelation between locations is primarily lower than other disasters.
A significant difference was noted between the spatial autocorrelation of fire frequency and fire intensity. The value of fire frequency was randomly distributed, whereas that of fire intensity was biased, with high values concentrated in a few specific areas. In the forest fire data for South Korea, in which most of the fires were man-made, the spatial relationship of fire frequency and socio-environmental factors was relatively low, whereas that of fire intensity was strongly dependent on climate and social factors. In fact, the results of spatial modeling of fire probability with respect to fire intensity strongly indicated highly significant correlations with environmental variables and high spatial correlations with the fire occurrence point. This indicates a comparative advantage over considering every fire location. Considering the strong influence of climate as a contributing factor to spatial correlation, we predict that climate change is highly likely to alter fire intensity rather than fire frequency. Our results provide implications for future studies on forest fire occurrence probability with respect to climate change and stresses the importance of considering all possible fire intensities.
3.6. Implications of using satellite-based forest fire occurrence data
South Korea is a good study case region for this research because of the widespread availability of fire data at various levels of detail via its well-established forest fire database systems. Prediction of high probability areas is a prerequisite even in countries with little or no accumulated data on forest fires because it is critical to the establishment, management, and improvement of related policies and response systems (Iliadis Citation2005; Stephens and Ruth Citation2005). In this regard, satellite-based forest fire location data are crucial for fire occurrence prediction and counter-measure establishment (Jolly et al. Citation2015; Davis et al. Citation2017). Such data are expected to have great utility, particularly when considering the effects of continued climate change including a longer dry season and increased frequency of extreme weather events.
For closed countries such as the DPRK and large areas with limited access such as Siberia and tropical rain forests, the remote sensing approach appears to be the only way to obtain forest fire information (Lim et al. Citation2017b). As shown in previous studies using remote sensing to assess fire occurrence (Ponomarev et al. Citation2016; Alves and Pérez-Cabello Citation2017), conventional approaches and methods have been replaced with the latest version of MODIS and VIIRS active data since the early 2000s (Schroeder et al. Citation2014; Giglio et al. Citation2016).
The low accuracy of satellite-based forest fire information is often cited as a critical weakness. To address this problem, we conducted additional data correction and spatial filtering to improve the accuracy. In fact, the spatial autocorrelation of satellite-based forest fire information was found to be higher than that of existing forest survey information. However, when field survey data are available, such data should be used for data verification. Even if the accuracy of the satellite-based information and the level of spatial autocorrelation all improved, error resulting from undetected forest fires or images is still possible. In the future, more precise satellite-based forest fire information such as that based on VIIRS data providing forest fire information at a higher resolution than that currently available through MODIS.
4. Conclusions
Prediction of fire occurrence probability is an important process for preventing and minimizing the damage caused by forest fires. Multiple forest fire occurrence data sources were used in this study to identify the geostatistical characteristics and to improve forest fire probability modeling in South Korea. Two types of forest fire data, MODIS active fire data and KFS fire survey data, were used for hotspot and spatial autocorrelation analysis, and the MaxEnt model was applied for spatial modeling of fire probability. Analysis based on 10 years of data revealed different patterns in terms of fire frequency and fire intensity. A clear difference was noted in fire frequency between the two types of fire data. In hotspot analysis, however, no significant differences were observed in terms of fire intensity. Spatial autocorrelation between fire frequency and fire intensity using a semi-variogram revealed a significant correlation with respect to fire intensity with the MODIS data showing higher correlation than the KFS data. The same result was noted after spatial autocorrelation among the related factors and fire sources. Considering these factors, a remarkable distinction was indicated in the climate factors. In spatial modeling using the data extracted from higher intensity values, the MODIS data showed a similar outcome with the hotspots analysis, with relatively high statistical accuracy. Further, the analysis of MODIS data proved that higher spatial autocorrelation of data is related to better performance of the resulting model. This study highlights that fire data showing high correlation with climate factors, such as satellite-based forest fire data, may be highly useful in climate change research, particularly in regions with little or no post-fire survey data.
Disclosure statement
No potential conflict of interest was reported by the authors.
Additional information
Funding
Related Research Data
References
- Alves DB, Pérez-Cabello F. 2017. Multiple remote sensing data sources to assess spatio-temporal patterns of fire incidence over Campos Amazônicos Savanna Vegetation Enclave (Brazilian Amazon). Sci Total Environ. 601–602:142–158.
- Ambrey CL, Fleming CM, Manning M. 2017. Forest fire danger, life satisfaction and feelings of safety: evidence from Australia. Int J Wildland Fire. 26(3):240–248.
- Austin MP. 2002. Spatial prediction of species distribution: an interface between ecological theory and statistical modelling. Ecol Model. 157(2-3):101–118.
- Barbero R, Abatzoglou JT, Larkin NK, Kolden CA, Stocks B. 2015. Climate change presents increased potential for very large fires in the contiguous United States. Int J Wildland Fire. 24(7):892–899.
- Boria RA, Olson LE, Goodman SM, Anderson RP. 2014. Spatial filtering to reduce sampling bias can improve the performance of ecological niche models. Ecol Model. 275:73–77.
- Chou YH, Minnich RA, Salazar LA, Power JD, Dezzani RJ. 1990. Spatial autocorrelation of wildfire distribution in the Idyllwild quadrangle, San Jacinto Mountain, California. Photogramm Eng Remote Sens. 56(1):1507–1513.
- Chuvieco E, Aguado I, Jurdao S, Pettinari ML, Yebra M, Salas J, Hantson S, de la Riva J, Ibarra P, Rodrigues M, et al. 2014. Integrating geospatial information into fire risk assessment. Int J Wildland Fire. 23(5):606–619.
- Clark JS, Royall PD, Chumbley C. 1996. The role of fire during climate change in an eastern deciduous forest at Devil’s Bathtub, New York. Ecology. 77(7):2148–2166.
- Cracknell MJ, Reading AM. 2014. Geological mapping using remote sensing data: a comparison of five machine learning algorithms, their response to variations in the spatial distribution of training data and the use of explicit spatial information. Comput Geosci. 63:22–33.
- Davis R, Yang Z, Yost A, Belongie C, Cohen W. 2017. The normal fire environment—modeling environmental suitability for large forest wildfires using past, present, and future climate normals. Forest Ecol Manage. 390:173–186.
- Dormann CF. 2007. Effects of incorporating spatial autocorrelation into the analysis of species distribution data. Global Ecol Biogeogr. 16(2):129–138.
- Elith J, Phillips SJ, Hastie T, Dudík M, Chee YE, Yates CJ. 2011. A statistical explanation of MaxEnt for ecologists. Divers Distrib. 17(1):43–57.
- Flannigan MD, Stocks BJ, Wotton BM. 2000. Climate change and forest fires. Sci Total Environ. 262(3):221–229.
- Fielding AH, Bell JF. 1997. A review of methods for the assessment of prediction errors in conservation presence/absence models. Environ Conserv. 24(1):38–49.
- Fornacca D, Ren G, Xiao W. 2017. Performance of three MODIS fire products (MCD45A1, MCD64A1, MCD14ML), and ESA Fire_CCI in a mountainous area of Northwest Yunnan, China, characterized by frequent small fires. Remote Sens. 9(11):1131.
- Gao Y, He Q, Liu Y, Zhang L, Wang H, Cai E. 2016. Imbalance in spatial accessibility to primary and secondary schools in China: guidance for education sustainability. Sustainability. 8(12):1236.
- Gedalof ZE, Peterson DL, Mantua NJ. 2005. Atmospheric, climatic, and ecological controls on extreme wildfire years in the northwestern United States. Ecol Appl. 15(1):154–174.
- Giglio L, Schroeder W, Justice CO. 2016. The collection 6 MODIS active fire detection algorithm and fire products. Remote Sens Environ. 178:31–41.
- Goldammer JG, Stocks BJ, Sukhinin AI, Ponomarev E. 2013. Current fire regimes, impacts and likely changes-II. Forest fires in Russia—past and current trends. In Vegetation fires and global change: challenges for concerted international action: white paper directed to the United Nations and international organizations; 51–78. Germany: Kessel Publishing House.
- Iliadis LS. 2005. A decision support system applying an integrated fuzzy model for long-term forest fire risk estimation. Environ Model Softw. 20(5):613–621.
- Jolly WM, Cochrane MA, Freeborn PH, Holden ZA, Brown TJ, Williamson GJ, Bowman DM. 2015. Climate-induced variations in global wildfire danger from 1979 to 2013. Nat Commun. 6:7537
- Kharuk VI, Dvinskaya ML, Petrov IA, Im ST, Ranson KJ. 2016. Larch forests of middle Siberia: long-term trends in fire return intervals. Reg Environ Change. 16(8):2389–2397.
- Kim GS, Lim CH, Kim SJ, Lee J, Son Y, Lee WK. 2017. Effect of national-scale afforestation on forest water supply and soil loss in South Korea, 1971-2010. Sustainability. 9(6):1017.
- Kim HG, Lee DK, Park C, Kil S, Son Y, Park JH. 2015. Evaluating landslide hazards using RCP 4.5 and 8.5 scenarios. Environ Earth Sci. 73(3):1385–1400.
- Kim M, Kwak HB, Lee WK, Won MS, Koo KS. 2011. Study on regional spatial autocorrelation of forest fire occurrence in Korea. J Korean Soc Geospatial Inf Syst. 19(2):29–37. In Korean.
- Kim M, Lee WK, Kim YS, Lim CH, Song C, Park T, Son Y, Son YM. 2016. Impact of thinning intensity on the diameter and height growth of Larix kaempferi stands in central Korea. Forest Sci Technol. 12(2):77–87.
- Kissling WD, Carl G. 2008. Spatial autocorrelation and the selection of simultaneous autoregressive models. Global Ecol Biogeogr. 17(1):59–71.
- [KFS] Korea Forest Service. 2016. Statistical yearbook of forestry. Deajeon (Korea): Korea Forest Service.
- Kwak H, Lee WK, Saborowski J, Lee SY, Won MS, Koo KS, Lee MB, Kim SN. 2012. Estimating the spatial pattern of human-caused forest fires using a generalized linear mixed model with spatial autocorrelation in South Korea. Int J Geogr Inf Sci. 26(9):1589–1602.
- Lee B, Park PS, Chung J. 2006. Temporal and spatial characteristics of forest fires in South Korea between 1970 and 2003. Int J Wildland Fire. 15(3):389–396.
- Lim CH, Moon JY, Lim YJ, Kim SJ, Lee WK. 2015a. Estimating spatio-temporal distribution of climate factors in Andong Dam basin. J Korean Soc Geospatial Inf Syst. 23(4):57–65. In Korean.
- Lim CH, Ryu DH, Song C, Zhu Y, Lee WK, Kim MS. 2015b. Estimating precise spatio-temporal distribution of weather condition using semi-variogram in small scale recreation forest. J Korean Assoc Geogr Inf Stud. 18(3):63–75. In Korean.
- Lim CH, Kim SH, Choi Y, Kafatos MC, Lee WK. 2017a. Estimation of the virtual water content of main crops on the Korean Peninsula using multiple regional climate models and evapotranspiration methods. Sustainability. 9(7):1172.
- Lim CH, Choi Y, Kim M, Jeon SW, Lee WK. 2017b. Impact of deforestation on agro-environmental variables in cropland, North Korea. Sustainability. 9(8):1354.
- Lim CH, Yoo S, Choi Y, Jeon SW, Son Y, Lee WK. 2018. Assessing climate change impact on forest habitat suitability and diversity in the Korean Peninsula. Forests. 9(5):259.
- McCoy VM, Burn CR. 2005. Potential alteration by climate change of the forest-fire regime in the boreal forest of central Yukon Territory. Arctic. 58:276–285.
- Moris JV, Vacchiano G, Enri SR, Lonati M, Motta R, Ascoli D. 2017. Resilience of European larch (Larix decidua Mill.) forests to wildfires in the western Alps. New Forests. 48(5):663–683.
- Oliveira S, Oehler F, San-Miguel-Ayanz J, Camia A, Pereira JM. 2012. Modeling spatial patterns of fire occurrence in Mediterranean Europe using multiple regression and random forest. Forest Ecol Manage. 275:117–129.
- Ord JK, Getis A. 2010. Local Spatial Autocorrelation Statistics: Distributional Issues and an Application. Geogra Anal. 27(4):286–306.
- Pereira P, Cerdà A, Úbeda X, Mataix‐Solera J, Arcenegui V, Zavala LM. 2015. Modelling the impacts of wildfire on ash thickness in a short‐term period. Land Degrad Dev. 26(2):180–192.
- Phillips SJ, Anderson RP, Schapire RE. 2006. Maximum entropy modeling of species geographic distributions. Ecol Model. 190(3-4):231–259.
- Phillips SJ, Dudík M. 2008. Modeling of species distributions with Maxent: new extensions and a comprehensive evaluation. Ecography. 31(2):161–175.
- Piñol J, Terradas J, Lloret F. 1998. Climate warming, wildfire hazard, and wildfire occurrence in coastal eastern Spain. Clim Change. 38(3):345–357.
- Ponomarev EI, Kharuk VI, Ranson KJ. 2016. Wildfires dynamics in Siberian larch forests. Forests. 7(12):125.
- Randerson JT, Liu H, Flanner MG, Chambers SD, Jin Y, Hess PG, Pfister G, Mack MC, Treseder KK, Welp LR, et al. 2006. The impact of boreal forest fire on climate warming. Science. 314(5802):1130–1132.
- Reid CE, Brauer M, Johnston FH, Jerrett M, Balmes JR, Elliott CT. 2016. Critical review of health impacts of wildfire smoke exposure. Environ Health Perspect. 124(9):1334
- Roy DP, Boschetti L, Justice CO, Ju J. 2008. The collection 5 MODIS burned area product—global evaluation by comparison with the MODIS active fire product. Remote Sens Environ. 112(9):3690–3707.
- Schroeder W, Oliva P, Giglio L, Csiszar IA. 2014. The New VIIRS 375 m active fire detection data product: algorithm description and initial assessment. Remote Sens Environ. 14385–96.
- Stephens SL, Ruth LW. 2005. Federal forest‐fire policy in the United States. Ecol Appl. 15(2):532–542.
- Sunar F, Özkan C. 2001. Forest fire analysis with remote sensing data. Int J Remote Sens. 22(12):2265–2277.
- Sung MK, Lim GH, Choi EH, Lee YY, Won MS, Koo KS. 2010. Climate change over Korea and its relation to the forest fire occurrence. Atmosphere. 20(1):27–35.
- Tien Bui D, Le KTT, Nguyen VC, Le HD, Revhaug I. 2016. Tropical forest fire susceptibility mapping at the Cat Ba National Park Area, Hai Phong City, Vietnam, using GIS-based kernel logistic regression. Remote Sens. 8(4):347.
- Vilar L, Gómez I, Martínez-Vega J, Echavarría P, Riaño D, Martín MP. 2016. Multitemporal modelling of socio-economic wildfire drivers in central Spain between the 1980s and the 2000s: comparing generalized linear models to machine learning algorithms. PLoS One. 11(8):e0161344
- Wotton BM, Martell DL, Logan KA. 2003. Climate change and people-caused forest fire occurrence in Ontario. Clim Change. 60(3):275–295.
- Wotton BM, Nock CA, Flannigan MD. 2010. Forest fire occurrence and climate change in Canada. Int J Wildland Fire. 19(3):253–271.