
 ?Mathematical formulae have been encoded as MathML and are displayed in this HTML version using MathJax in order to improve their display. Uncheck the box to turn MathJax off. This feature requires Javascript. Click on a formula to zoom.
Abstract
After analysing systematically formation mechanism of snow disaster (SD), this study revealed spatial-temporal characteristics of historical disasters, snowfall events, disaster-formation environment, livestock overload, vulnerability of livestock and adaptability, finally evaluated integrated risk index (IRI) of the SDs over the Qinghai-Tibetan Plateau (QTP) using ArcGIS method. Over the past more than 50 years, the recorded large scale SDs occurred 238 times. Overall, the large scale SDs decreased, yet the small scale SDs increased in frequency. Particularly, the year of extreme snowfall event’s occurrence did not correspond to the large scale SDs, in which a serious overloading rate with high livestock density is the key driver of the SD formation. The regions at higher IRI are mainly concentrated on mid-eastern and southwestern TP and appear a contiguous risk belt from northeast to southwest. Thinking about snowfall events and overload rate influencing mainly SD risk, it is necessary to improve forecasting and monitoring level of snowfall and snow cover extent, increase forage reserves, control strictly overload rate, implement livestock and grass balance strategy and enhances the scale of cattle and sheep housing and other infrastructures.
1. Introduction
Snow disaster, a type of meteorological or cryospheric disaster is among the growing major natural disasters especially with increasing uncertainties and fluctuations under accelerating global warming (Qin Citation2015; Wei et al. Citation2017). In pastoral areas of Central Asia and East Asia, snow disaster often happened in winter and spring, especially when combined with other ecological and/or socioeconomic stressors, can have disastrous impact on the livelihoods of local herders (Fernandez-Gimenez et al. Citation2012; Li et al. Citation2018). China has the most abundant grassland and livestock resource in the world, in which the TP’s animal husbandry is a dominant and traditional source of livelihood and income and it has a higher proportion in the economic structure (Dong and Sherman Citation2015). The average elevation in the Qinghai-Tibetan Plateau (QTP) is more than 4000 m and annual mean temperature is below 0 °C in most areas, thus it forms a typical plateau subterranean zone and plateau cold zone climate type. This climate background breeds plateau tundra, alpine meadow and alpine grassland-based vegetation type. Pasture grass is mainly composed of Kobresia Kobresia plant, mainly including kobresiapygmaea, K. humilis, K. capillifolia and pasture grass is generally short and small. When snow cover is more than 3 cm and maintains 4–6 days or more in winter and spring, the livestock foraging is extremely difficult (Zhao Citation2009). With accelerating climatic changes, more and more evidences have demonstrated that the frequency and damage of the SD have increased gradually over the QTP in the past decades (Wang et al. Citation2014; Qin Citation2015).
Currently, the research of global change risk has begun to develop toward the direction of integrated interdisciplinary research among natural, social science and policy-driven, which aims to provide important information and specific proposals by reducing risk, enhancing adaptability, implementing adaptation strategies for different interest groups and policy makers (Turner et al. Citation2003; Fussel and Klein Citation2006; Ziad and Amjad Citation2009; Martens et al. Citation2009). Similarly, the occurrence of the SD is due to both natural and social factors and by their interactions. Natural system risks involve snowfall event, snow depth, snow cover day, low temperature, pasture grass type and height, NDVI, while social system risks include composition or structure of livestock herds, balance status between grass and livestock, forage stock, SD insurance, livestock health status, disaster prevention and mitigation level, regional economic development level. Integrated risk assessment of the SD means a prediction of the likelihood of snow cover event and its disaster loss to disaster bearing areas. The SD risks not only include the hazard of snowfall event and grass yield but also involve relational vulnerability and adaptability of exposed elements. However, the previous study mainly took snow depth, snow duration, and low temperature days as an assessment criterion of integrated risk of the SD or replaced the integrated risk with a disaster loss. Although several past studies have analysed social vulnerability of herder communities to climate variability and change (Fu et al. Citation2012; Wang et al. Citation2014), less researches considered or analysed synthetically and quantificationally exposure, vulnerability degree of exposed elements, and adaptability in risk assessment process of the SD. At present, a methodology system on integrated risk assessment of the SD and risk zoning and management has not yet formed.
This article took the QTP as a typical case area, analysed spatiotemporal characteristics of historical SD, snowfall events and their relationship, took into overall consideration and coordinated hazard, exposure, vulnerability and adaptation risk of the SD, selected accumulated snow depth, snow cover days, low temperature days and NDVI, overload rate, proportion of sheep to the total number of livestock, net income of farmers and herdsmen, and investment in fixed assets per capita as the key driving factors of the SD formation, evaluated systematically integrated SD risk level using logistic regression method and ArcGIS and SPSS software tool, and put forward corresponding management and controlling plans over the QTP. This study not only plays an important role in reducing disaster loss and ensuring sustainable development of animal husbandry in the global pastoral area but also provides scientific basis for worldwide disaster prevention and mitigation departments to develop pre-disaster prevention planning, post-disaster relief and recovery decision-making.
2. Study area, data and method
2.1. Study area
The QTP, with area of 257.24 × 10⁴ km2, is located in the south-central part of the Eurasian continent across 31 longitude and 13 latitude (Space extent: about 2946 km length from east to west, west from the Pamirs and east to the Hengduan Mountains; about 1532 km width from south to north, south from the Himalayan Mountains and north to the Kunlun-Qilian Mountains), accounting for the total land area of China’s 26.80% (Zhang et al. Citation2002) (25°59′37″N ∼ 39°49′33″N, 73°29′56″E∼104°40′20″E) (). The QTP is mainly characterized by the development of large-scale cryosphere, which is the most developed area in the middle and low latitudes. Snow cover is about water equivalent to 740 × 108 m3. In the administrative divisions, the QTP covers 201 counties, six provinces (Xinjiang, Qinghai, Tibet, Yunnan, Sichuan and Gansu), in which Qinghai and Tibet Autonomous Region are two major pastoral provinces. From 1979 to 2010, annual mean snow depth was 2.03 cm. In the past 32 years, snow depth showed a significant increasing trend with an increase rate by 0.26 cm/10a. Among them, the increasing snow depth of the Kunlun alpine desert area is the most obvious, the increasing rate is 0.73 cm/10a. During the 1980s and 1990s, snow depth gradually increased, and changed stably in the beginning of the twenty-first century. The change of snow depth in four seasons showed an increasing trend, especially in winter, the increasing rate reached 0.57 cm/10a (Bai et al. Citation2014) ().
Figure 1 Grass type and distribution of meteorological stations over the QTP.
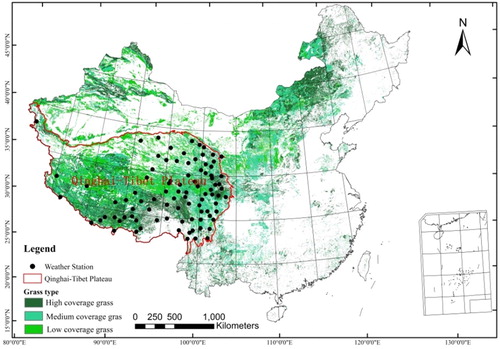
Due to fragile natural conditions, industrial structure, in the QTP, is single and mostly livestock husbandry-based, the frequency, freezing days and SD loss are relatively higher than other regions, and the farmers and herdsmen’ ability to resist natural disasters is extremely limited. In 2010, the total population was only 15.54 million, the total number of livestock reached 134.4 million sheep units, the livestock mainly dominated by Tibetan yak and sheep and goats in the QTP. The livestock husbandry output value and per capita income reached 17.345 billion and 8260 CNY in 2010. From per capita income level, economic adaptability level is relatively low, far lower than the national average over the same period, at a relatively backward level.
2.2. Data description
2.2.1. Historical disaster data (1949–2015)
From 1949 to 1993, meteorological disaster data are obtained from National Science and Technology Commission’s National Natural Disaster Comprehensive Research Project Achievements. Meteorological disaster data from 1994 to 2015 come from the ‘China Meteorological Disaster Ceremony’ (2005), ‘China Meteorological Disasters Yearbook’ (2000–2015), the media, as well as internet, including the number of livestock deaths, the number of victims and their economic losses.
2.2.2. Meteorological data (1960.1.1–2015.12.31)
The Meteorological data come from the China Meteorological Science Data Sharing Service Network (http://cdc.cma.gov.cn/). Datasets cover daily mean temperature, precipitation, maximum and minimum temperature, snowfall, etc. from 1 January 1961 to 31 December 2015. These data are used to calculate the annual variability of the temperature and its annual spatial distribution characteristics of annual mean temperature in the study area. In addition, annual total snow cover days, days below 1 °C are derived from the dataset. At the same time, snow depth and snow cover days refer to Chinese Snow Depth Time Series Data Set (1978–2015) from the National Natural Science Foundation of ‘Western China Environmental and Ecological Science Data Center’ (http://westdc.westgis.ac.cn).
2.2.3. NDVI and field grassland survey data (2000–2015)
This article chooses NASA’s EOS-MODIS Terra Star’s monthly synthetic NDVI data (http://www.gscloud.cn) as the base of grass yield calculation. The data have passed the Krasovsky_1940_Albers projection conversion, the central meridian 105° is matched and cut in the GCS_Krasovsky_1940 coordinate system with the QTP’s boundary. From 2011 to 2015, the study group conducted field grassland investigation in Lhasa, Nagqu, Suoxian, Guoluo, Bangor, Golmud and Xining of the QTP. The period of annual survey is during the growing season from late July to early August. A total of 84 sampling points are surveyed in the above areas, with a total of 237 samples (10 m × 10 m). The selection of sample site is conducted on representative grassland. These grasslands must be no influenced by mowing and grazing interference in the growing season.
2.2.4. Socio-economic data (1985–2015)
Socio-economic statistical data are obtained from annual statistic yearbooks (2000–2015) (http://www.stats.gov.cn) and annual China county social economic statistic yearbook (Department of Rural Socioeconomic Investigation 2000–2015) of six provinces in the QTP. The yearbooks mainly cover the number of livestock, population, gross domestic product (GDP), total livestock, fixed asset investment, per capita income, etc. These data are used to extract and assign the indicators of exposure, vulnerability and adaptability in different disaster areas.
2.3. Risk assessment system of the SD
The SD often results in many deaths of people and livestock and severely influences on the sustainable development of grassland animal husbandry due to heavy snowfall, deeper snow cover, longer snow cover days, lower temperature and lack of pre-disaster forage storage and emergency measures. The occurrence of the SD is not only controlled by natural factors such as snow depth, snow cover days, low temperature, grassland type and pasture height but also closely related with social factors like livestock community structure, forage stock reserve, disaster emergency funds and regional economic development level (Wang et al. Citation2014; Miao et al. Citation2016). Overall, the SD risk is mainly determined by four aspects of hazard indicator of snow event and disaster-formed environment, the exposure indicator and vulnerability indicator of livestock, adaptability indicator of disaster prevention and mitigation. When snow depth is greater, snow cover day is longer, overload rate of livestock is too large, and the response to prevent disaster is weaker, the SD damage will become more and more serious ().
Figure 2 Snow disaster risk system.
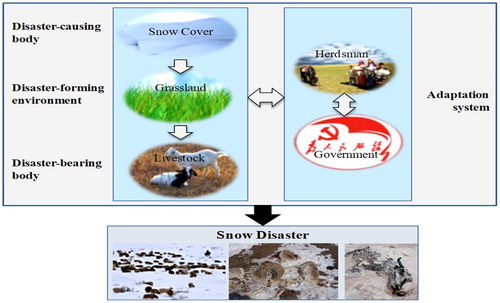
After analysing systematically the SD formation mechanism and its risk composition and integrating all kinds of relative disaster risk literatures (IPCC Citation2014; Wang et al. Citation2015), this study established the assessment system of integrated risk index (IRI) of the SD (), in which chose accumulated snow depth (x1), snow cover days (x2), low temperature days [the day of average temperature is less than 0 °C (x3)] and grass yield (x4) as hazard indicator (HI) of snow event dangerousness and disaster-formed environment (low temperature and grassland environment), overload rate (x5) as exposure index (EI), proportion of sheep to the total number of livestock (x6) as vulnerability index (VI) of livestock (the small livestock is easy to dead), and net income of farmers and herdsmen (x7) and investment per capita in fixed assets (x8) as adaptability index (AI) to deal with the SD at the community scale.
Table 1. The assessment system of integrated risk index of the SD in the QTP.
Among them, each weight of the integrated SD risk is determined by the AHP (Wang et al. Citation2015).
2.4. Calculation method of livestock overload rate
Comparing with livestock density, overload rate is better able to reflect the tension of forage demand of overwintering livestock. It is an excellent indicator in the EI, thus this study chose it as a unique indicator to reflect the EI disaster-bearing body. The higher overload rate shows higher grazing intensity, the more serious grassland damages a weaker adaptability to cope with the SD. The formula of the overload rate (x5) of livestock as follows:
(1)
(1)
x5 is the theoretical overload rate (%). Mo is the actual amount of livestock by sheep-unit conversion (unit: Su) (the method: one horse means six sheep-units, one cow means five sheep-units, one donkey or mule or deer means four sheep-units, one sheep is equal to one sheep-unit). TCC is the theoretic carrying capacity estimated using remote sensing NDVI data (Theoretic carrying capacity, TCC) (unit: Su). The specific calculation method is as follows:
(1)
(1)
(2)
(2)
At the above formula (2), M is total available feed intake of all kinds of grasslands in a certain area (unit: kg). k1i is a coefficient of available area for the i-th grassland (i.e. the ratio of grazing grass area to the total grassland area). k2i is a coefficient of available grassland, k3i is the use-rate of grazing grassland. pi is grass yield of i-th grassland (unit: kg/hm2), Si is the i-th grassland area (unit: hm2). In this study, the daily feed intake per sheep unit is calculated according to 5 kg fresh grass (1.2 kg hay), and the number of grazing days per year was 365 days.
Based on the related results (Li Citation2000; Zhao Citation2009), three coefficient values of k1i, k2i and k3i are 0.85, 0.80 and 0.60, respectively in this study, that is, the comprehensive grassland utilization rate is 40.80%. Pi is the aboveground biomass of the grassland calculated using regression model between grassland survey data and the pixel grey value of corresponding NDVI. In order to accurately estimate actual production capacity of the grassland in the QTP, this study fitted the various models between ground survey data and the pixel grey value of corresponding NDVI. The results show that the fit degree of the power model is higher with R2 = 0.5391 and p < .01 (Wei et al. Citation2017).
(3)
(3)
In the formula, y is the grass yield, x is NDVI. Since the NDVI values of grassland in growing season are mostly between 0.3 and 0.75, the accuracy of grassland estimation should be between 73.2% and 74.5%. Therefore, using this model, we can be calculated grass yield (x4).
2.5. Evaluation method of integrated SD risk
The integrated risk index (IRI) of the SD is used to estimate the dangerousness of animal husbandry under the SD. The IRI is summarized by the four aspects of sub-risks in the SD, that is, hazard index (HI), exposure index (EI), vulnerability index (VI) and adaptability index (AI) (Wang et al. Citation2015; Wei et al. Citation2017). All indicators and the indexes (except for EI and IRI) in spatial analysis, are non-dimensionally processed by extremum method (normalization results between 0 and 1) and each one of the indexes was weighted by the AHP. The IRI was calculated by formula (4–7):
(4)
(4)
(5)
(5)
(6)
(6)
(7)
(7)
(8)
(8)
In the above formula, x1, x2, x3, x4, x5, x6, x7, x8 are represented accumulated snow depth, snow cover days, low temperature days, grass yield, overload rate, the proportion of sheep to the total number of livestock, net income of farmers and herdsmen, investment in fixed assets per capita, respectively. For consistence of indicator system, all indicators were spatially interpolated using ArcGIS to attain spatial resolution matching raster data to match raster-based remote sensing datasets, and all data were re-sampled into the same spatial resolution of 1 km ×1 km.
3. Results and analyses
3.1. Spatial-temporal features of historical disasters and snowfall events
From 1961 to 2015, there have been 238 events recorded over the QTP, in which the QTP is suffered serious SDs with a large-scale damage (more than 600,000 livestock death) in 1974, 1975, 1979, 1982, 1989 and 1995, respectively. In the recent 20 years, the SDs with a large-scale damage showed a clear decrease trend, but these SDs caused serious devastating influences to animal husbandry. By contrast, the frequency of small scale SDs with a death rate of less than 600, 000 increased obviously in recent years and the destructive casualties or losses showed a gradual increasing trend. From the frequency of small-scale disaster occurrence point of view, the number of the SDs with livestock deaths and casualties increased from an average of two to three years in the 1960s and gradually increased to almost once a year in the recent period. From the scale of livestock deaths point of view, the SD is mainly dominated by small-scale in recent 20 years, but the total cumulative number of deaths increased year by year (). Especially, from October 1995 to the end of April 1996, five major snowstorms occurred continuously in Yushu Prefecture in the middle part of the QTP. The cumulative snow depth in the snow-covered area reached 60 cm, mean temperature was between -15.8° C and 26.5° C in most areas during this period (). This SD caused a large area of grassland covered by snow, traffic blocked, communication interruption, resulting in 630,000 livestock death and forming a rare large SD damage with the death rate by 23.19% and the direct economic loss by $287 million in recent 40 years.
Figure 3 Losses caused by the SD and accumulative snow depth (b) change in the QTP during the period 1961–2015 (recorded livestock deaths with over 0.60 million is considered as large-scale Losses, yet lower 0.60 million is small-scale losses).
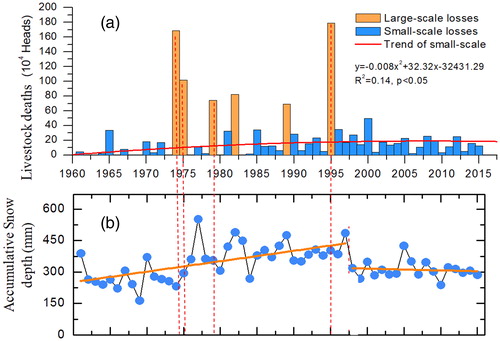
Over the past 50 years, snowfall events generally showed a first increase then decrease trend, and the extreme year of snowfall events occurred mainly in 1960, 1970, 1977, 1983, 1989, 1996 and 2005. In contrast with snowfall events, it can be seen that the large-scale SDs in 1975, 1976, 1979, 1995 does not correspond to the corresponding annual cumulative snowfall events (). Therefore, we can conclude that to only take extreme snowfall event as a warning indicator of the SD is not comprehensive, multiple influence factors should be included in risk assessment and early warning system of the SD ().
3.2. Hazard indicator (HI) analysis
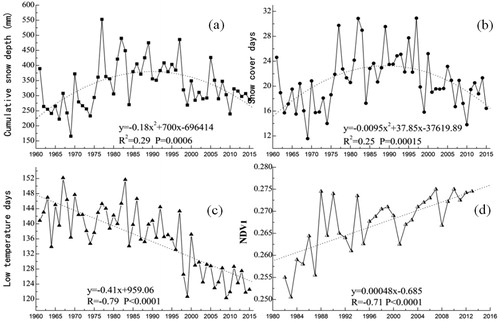
The HI of snow event dangerousness and disaster-formed environment is mainly influenced mutually by snow depth, snow cover days, low temperature days (the day of average temperature is less than 0 °C) and grass yield (NDVI). The results showed that accumulated snow depth and snow days showed an increase initially and decrease afterwards overall in the QTP in nearly 50 years (,b)). Low temperature days have been witnessed a gradual downward trend, suggesting that there is a downturn in the low-temperature disaster, and this decrease trend is especially obvious in recent ten years (). In nearly 30 years, NDVI presented an increasing trend in overall. During the period from 1982 to 2014, annual growth rate of NDVI reached 0.0048/10 a (R = 0.71, p < .0001). Spatially, the amplitude of NDVI increase showed a gradually decreasing trend from southeast to northwest in the past 30 years ().
Figure 4 Annual accumulated snow depth, snow cover day and number of days (a) below 0 °C and mean NDVI change during growing season (May-September) in the QTP (Dotted line for linear fitting trend).
To clearly reflect and indicator spatial distribution characteristics of above four indicators, the study calculated respectively long-time average annual value of various indicators from 1961 to 2015 using ArcGIS spatial analysis method. In the period, average accumulated snow depth and snow cover days are more obvious consistency in the spatial distribution pattern. Higher dangerous areas concentrated on Gannan prefecture, Gansu province, Southern Qinghai province, Naqi, Shannan prefecture in Tibet autonomous region, etc. (). As can be seen, more snowfall events with larger scale are the important reasons for the SD formation of animal husbandry in these areas (,b)). The spatial distribution of low temperature days is closely related to the elevation and latitude. With the increase of altitude and latitude, the number of low temperature days are obviously increased (). Southern and eastern QTP, especially in the middle and eastern part, have better hydrothermal conditions, thus there is higher grass yield. However, human activities here are relative strong, and the grassland is often in the serious overload state. In the northwestern QTP, there is a gradual increase trend in the yield of grassland affected by climate change such as warming and slightly rainfall increase ().
Figure 5 Spatial distribution of accumulated snow depth (a), snow cover days (b), the days below 0 °C (c) and grass yield (d) in the QTP (Note: all the values are dimensionless and are normalized into 0-1).
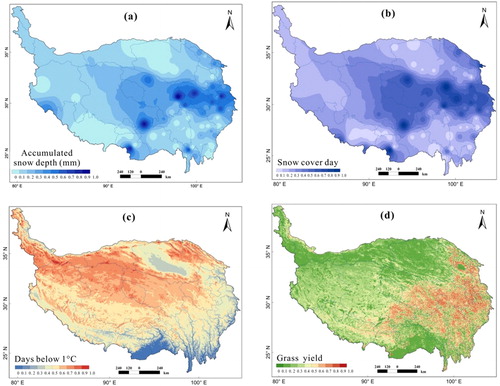
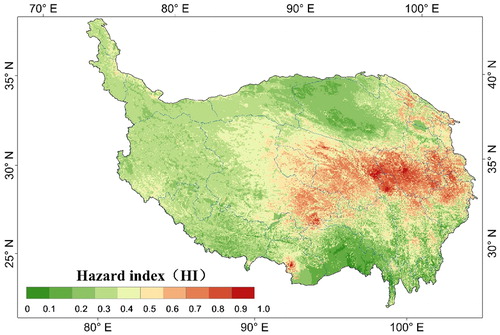
Based on above four indicators, this study calculated their integrated hazard index (HI). The results show: severe areas with higher integrated hazard index (HI) is obviously consistent with higher snow depth, more snowy days and higher overload state (NDVI), and is mainly located in the middle-eastern QTP, especially eastern QTP. Other areas have a relatively smaller HI ().
Figure 6 The spatial distribution of hazard index (HI) of the SD in the QTP. (Note: all the values are dimensionless and are normalized into 0-1).
3.3. Exposure indicator (EI) analysis
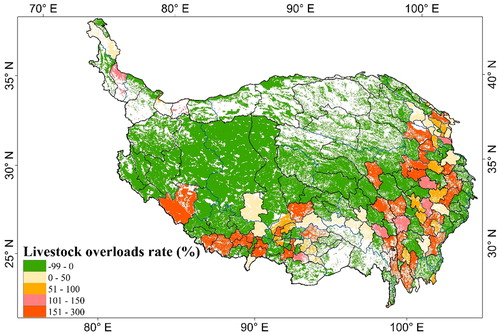
Exposure describes spatial distribution and numbers of exposed elements and is expressed by the number and density of exposed elements. On the whole, the more (fewer) exposed elements expose to the SD, the greater (smaller) are potential losses. The EI was replaced by the livestock overload rate in the study. The results show that 90 counties in all 207 counties in the QTP were in the overload situation, in which overload rate in some areas was over 500% and apparently broke the balance of grass and livestock. From the spatial scale, the more serious overload areas are mainly located in the northeastern QTP, southeastern Qinghai Province, northwestern Sichuan Province, Shigatse-Lhasa-Nagqu-Qamdo of Tibet Autonomous Region and northwestern Yunnan Province. These areas have higher livestock, economic densities and are also important concentrated animal husbandry areas. On the contrary, the areas with low and non-overloaded rates are mainly distributed in the vast northern and middle-western QTP. Most of these areas have relatively lower NDVI, livestock and population density, which ease more livestock’s pressure on the grassland to a certain extent ().
Figure 7 Spatial distribution of livestock overloads rate reflecting animal husbandry exposure in the QTP.
3.4. Vulnerability indicator (VI) analysis
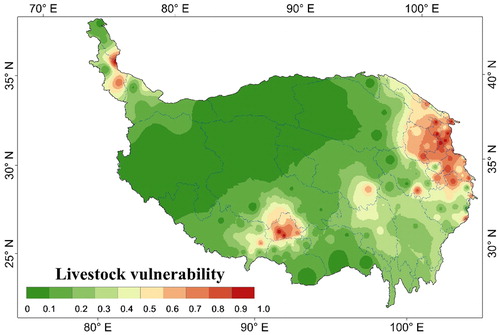
The VI indicates the susceptibility, the extent of damage and loss of livestock and other exposed elements affected by the SD. Higher vulnerability will result in greater disaster losses. Anti-disaster ability of livestock is reflected in category, age structure, and health status, etc. Due to the difficulty to obtain age structure, health status data, this study selected only small livestock (sheep) ratio (x5) in the total number of livestock (sheep units) as a VI. In the SD, sheep and other small animals have lower feed capacity, and their resistance capability in freezing and snow days were weaker than that of other large livestock (yak, horses, etc.) in the absence of forage. Sheep are also a prime affected-SD object. On the whole, the areas with higher VI are mainly located in the northeastern QTP, the area around Qinghai Lake in Qinghai Province and Lhasa, Nagqu and Xigaze in Tibet Autonomous Region, and these regions often have a higher proportion of small animals. In contrast with these areas, other regions had a lower VI (). This spatial pattern of the VI of the SD means that higher livestock vulnerabilities often faced with higher disaster risk or damage in the equal probability and scale of the SD.
Figure 8 Spatial distribution of livestock vulnerability facing to SD in the QTP.
3.5. Adaptability indicator (AI) analysis
Adaptability emphasizes pre-disaster warning and preparation status, avoiding and mitigating, even releasing damages and capacities to cope with ripple effects of post-disaster. Compared to the tolerance of animal husbandry to disaster risk, adaptation reflects in the management capacity of local government and social aid and assistance from communities (Wei et al. Citation2017). Adaptability means also the subjective initiative of human beings as a part of the disaster-bearing bodies and properties to adapt the SD, it emphasizes the ability of proactively pre-disaster prevention and post-disaster recovery (Vogel et al. Citation2007; Williamson et al. Citation2010; Hallegatte et al. Citation2011). To prevent SD, the adaptability of herdsmen themselves is the most important and mainly reflected in the per capita income. At the same time, social investment in fixed assets (especially overwintering feed reserves, greenhouse fattening construction) is also an important measure to reduce disaster losses. In the space scale, the regions with higher per capita income focused on the densely populated areas in the northeastern and eastern QTP, whereas higher social investment in fixed assets is mainly concentrated on the northern QTP. In addition, some urban areas also have higher per capita income and social investment in fixed assets (,b)).
Figure 9 Spatial distribution of per capita income (a), fixed asset investment (b), and adaptability index (AI) (c).
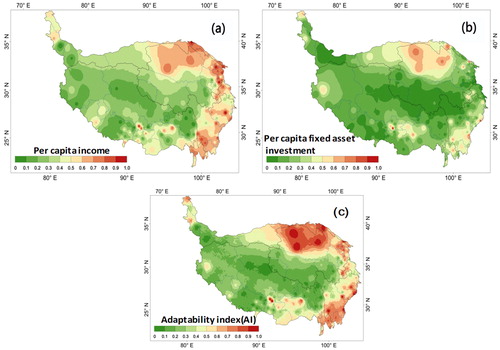
The AI calculated by formula (7) showed that the northernmost, easternmost and southeastern parts of the QTP have higher AI than other areas. These areas have relatively low elevation, relatively good natural environment, and higher total economic output value, which determines them relatively higher adaptability to cope with the SD. In contrast, the central plateau and its western regions have generally higher altitude, more fragile nature environment, smaller economy yield and lower investment density of fixed assets (), these areas are mainly dominated by animal husbandry, and the SD prone to occur. Generally, the mismatches with spatial adaptability and animal husbandry distribution led to weaker remedies and coping abilities to prevent the SD, while smaller economic yields and fiscal revenues make the SD recovery and reconstruction difficulties.
3.6. Classification and zoning of integrated risk indicator (IRI)
Based on the above risk factor analysis, the study calculated the IRI of the SD over the QTP by overlapping the HI, EI, VI and AI in the grid evaluation unit, and the visualization of the spatial distribution of the IRI was realized (). The IRI reflects spatial overlap and synthesis results based on all above risk factors from the SD. For any kind of natural disaster, hazard of disaster-causing bodies and disaster-forming environments are important indicators, but the exposure and vulnerability of disaster-bearing bodies, and adaptabilities will also seriously affect the IRI and even damage degree of the SD. Historical records showed that the SD occurred mainly in the central and northeastern part of the QTP, as well as Nagqu and Xigaze area in Tibet Autonomous over the past 50 years ().
Figure 10 Classification, zoning and spatial distribution of historical SD (above map) and integrated risk index (IRI) of the SD (under map) in the QTP.
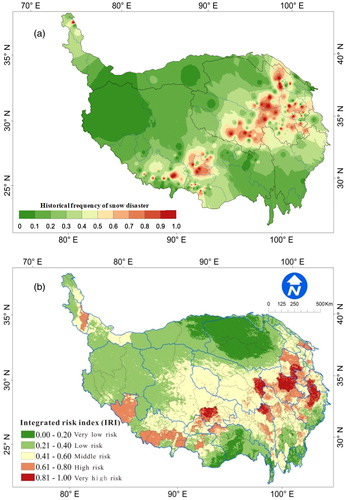
According to general rule of disasters occurrence, where disasters often occurred in history are more vulnerable than other areas and often prone to recurring disasters and cause losses (Wei et al. Citation2017). Actually, historical SD has obvious consistency with spatial distribution of the higher IRI over the QTP. The evaluation results showed that the areas with higher IRI is mainly concentrated on middle-eastern QTP (e.g. Hainan, Huangnan, Guoluo, Yushu, Ganzi, Aba and other regions) and other some areas (e.g. Suoxian, Nagqu, Shigatse, Chungba and other regions) (). If the plateau is seen as a whole, we can see that the higher IRI areas showed a clear extended belt from the northeast to southwestern QTP in the geographical space, which seems to coincide with the convergence zone between sub-frigid zone and temperate, subtropical zone over the QTP. In contrast, snow depth, snow cover day, grass yield and livestock density in the northwestern QTP is relative lower than that in the northeastern QTP, which determines these areas have smaller IRI. Especially, the eastern and southern edges of the QTP mainly located in tropical forest areas, these areas had relatively low elevation, better overall economic situation, and higher adaptability level, thus the IRI became relatively lower in these regions ().
4. Conclusions
Regionalization results for integrated SD risk are consistent the distribution of historical SD sites. High IRI areas mainly concentrated on pastoral areas with dense livestock and population and have more developed animal husbandry. In these areas, the SD is dominated by grass and livestock imbalance or higher overloads rates with serious snow events. It can be said that preparedness ensures success and unpreparedness spells failure. To live with the risk, to be vigilant in peace time, to take precautions in case of dangerousness, and to control and prevent risk in whole process is the basic point and starting point of risk management but also an important measure to avoid and mitigate potential SD damage. Based on above analysis, integrated risk management of the SD should be focused on prediction measures of hazard risk, reduced measures of exposure risk, decreased measures of vulnerability risk, and enhanced measures of adaptability.
Generally, to avoid or reduce the SD risk depends largely on the understanding of the mechanism of SD formation, effective and accurate data of snowfall forecast and monitoring results of snow depth, which is the most important and forefront measures. To adjust reasonably grazing period, implement balance strategies of grass and livestock, strictly control overload rate in winter and spring, and centralize herdsmen settlements is not only the base for reducing the risk of exposure but also key control point of pastoral areas to prevent the SD. Degraded grassland improvement, artificial grassland construction, herd structure improvement is the important measures to raise grass production and improve livestock species of the pastoral area, while the implementation of the policy of return grazing land to grassland, forage basic construction and pasture infrastructure construction is fundamental guarantee to enhance protection level of the SD. In addition, to establish SD insurance and government emergency fund system is the last line of defence to cope with pastoral SD. Although the SD insurance is a bad plan in the SD management, it is a last straw or economic source to make up for the SD loss.
Final_version_of_the_manuscript_with_email_address_of_co_authors.doc
Download MS Word (2.8 MB)Disclosure statement
No potential conflict of interest was reported by the authors.
Additional information
Funding
Related Research Data
References
- Bai SY, Shi JQ, Gao JX. 2014. Analysis of spatial-temporal variations of snow depth over the Qinghai-Tibetan Plateau during 1979-2010. Geo-Inf Sci. 16(4):628–630. (in Chinese).
- Li YN. 2000. Simulation of forage yield and stocking rate on alpine grassland in response to warming trend of climate. Acta Pratacult Sin. 9(2):77–82. (in Chinese).
- Department of Rural Socioeconomic Investigation, NBS. 2000–2015. China County (City) Social Economic Statistic Yearbooks. Beijing: China Statistics Press.
- Dong SK, Sherman R. 2015. Enhancing the resilience of coupled human and natural systems of alpine rangelands on the Qinghai-Tibetan Plateau. Rangel J. 37(1):i–iii.
- Fernandez-Gimenez M, Batkhishig B, Barbuyan B. 2012. Cross-boundary and cross-level dynamics increase vulnerability to severe disasters (dzud) in Mongolia. Glob Environ Change. 22:836–851.
- Fu Y, Grumbine E, Wilkes A, Wang Y, Xu J, Yang Y. 2012. Climate change adaptation among Tibetan pastoralists: challenges in enhancing local adaptation through policy support. Environ Manag. 50(4):607–621.
- Fussel HM, Klein RJT. 2006. Climate change vulnerability assessments: an evolution of conceptual thinking. Clim Change. 75:301–329.
- Hallegatte S, Przyluski V, Vogt-Schilb A. 2011. Building world narratives for climate change impact, adaptation and vulnerability analyses. Nature Clim Change. 1(3):151–155.
- IPCC. 2014. Climate Change 2014: Impacts, Adaptation, and Vulnerability. Part A: Global and Sectoral Aspects. Contribution of Working Group II to the Fifth Assessment Report of the Intergovernmental Panel on Climate Change. United Kingdom and New York (NY).
- Li Y, Ye T, Liu W, Gao Y. 2018. Linking livestock snow disaster mortality and environmental stressors in the Qinghai-Tibetan Plateau: Quantification based on generalized additive models. Sci Tot Environ. 625:87–95.
- Martens P, McEvoy D, Chang C. 2009. The climate change challenge: linking vulnerability, adaptation, and mitigation. Curr Opin Environ Sustain. 1(1):14–18.
- Miao L, Fraser R, Sun Z, Sneath D, He B, Cui X. 2016. Climate impact on vegetation and animal husbandry on the Mongolian plateau: a comparative analysis. Nat Hazards. 80(2):727–739.
- Qin DH. 2015. China National Assessment Report on Risk Management and Adaptation of Climate Extremes and Disasters. Beijing: Science Press.
- Turner BL, Kasperson RE, Matson PA, McCarthy JJ, Corell RW, Christensen L, Eckley N, Kasperson JX, Luers A, Martello ML, et al. 2003. A framework for vulnerability analysis in sustainability science. PNAS. 100(14):8074–8079.
- Vogel C, Moser SC, Kasperson RE, Dabelko GD. 2007. Linking vulnerability, adaptation, and resilience science to practice: Pathways, players, and partnerships. Glob Environ Change. 17(3–4):349–364. doi: 10.1016/j.gloenvcha.2007.05.002.
- Wang SJ, Qin DH, Xiao CD. 2015. Moraine-dammed lake distribution and outburst flood risk in the Chinese Himalaya. J Glaciol. 61(225):115–126.
- Wang SJ, Wei YQ, Fang M. 2014. Integrated risk assessment of SD in the Three Rivers source Region, China. Acta Pratacult Sin. 23(2):108–116. (In Chinese).
- Wang Y, Wang J, Li S, Qin D. 2014. Vulnerability of the Tibetan pastoral systems to climate and global change. Ecol Soc. 19(4):8. doi: 10.5751/ES-06803-190408
- Wei YQ, Wang SJ, Fang YP, Nawaz Z. 2017. Integrated assessment of the vulnerability of animal husbandry from SD perspective under climate change on the Qinghai-Tibetan Plateau. Glob Planet Change. 157:139–152.
- Williamson T, Hesseln H, Johnston M. 2010. Adaptive capacity deficits and adaptive capacity of economic systems in climate change vulnerability assessment. For Policy Econ. 15:160–166.
- Zhang YL, Li BY, Zheng D. 2002. A discussion on the boundary and area of the Tibetan Plateau in China. Geogr Res. 21(1):1–8. (In Chinese).
- Zhao XQ. 2009. Alpine meadow ecosystem and global change. Beijing: Science Press. (In Chinese).
- Ziad AM, Amjad A. 2009. Intrinsic vulnerability, hazard and risk mapping for karst aquifers: A case study. J Hydrol. 364(3–4):298–310.