
 ?Mathematical formulae have been encoded as MathML and are displayed in this HTML version using MathJax in order to improve their display. Uncheck the box to turn MathJax off. This feature requires Javascript. Click on a formula to zoom.
Abstract
Dysentery is a major infectious diseases that affects public health and the quality of life in Jiangsu Province. Since the development of the railways, the incidence of dysentery in the general population living near railway lines has increased. This research investigates the relationship between the geographical distribution of the railways and the incidence of dysentery in Jiangsu Province, and suggests a method for predicting dysentery in such areas. We used previously published literature, statistics, and known physiological properties of Shigella to analyse bacterial dysentery data for Jiangsu Province for the period from 2001 to 2012. The results indicate that railways could be indicative of the transmission of dysentery. Analysis of the incidence of dysentery in relation to the distribution of the railways using linear regression found that the incidence of dysentery in Jiangsu Province for 2001–2012 was linearly related to the buffer distance from the particular railway line. Furthermore, both regression parameters were affected by meteorological parameters, and the railway site was linearly related to the incidence of dysentery in cities along the railway.
1. Introduction
Dysentery is an inflammation of the intestine that causes diarrhea, accompanied by a loss of blood via feces. Other symptoms may include fever, abdominal pain, and rectal tenesmus (a feeling of incomplete defecation). It is considered a type of gastroenteritis that is caused by a number of pathogens such as bacteria, viruses, parasitic worms, or protozoa. In developed countries, the most common form of dysentery is bacillary dysentery, which manifests itself typically as a mild illness characterized by mild stomach pain and a frequent passing of loose stools or diarrhea (Lvyuan et al. Citation1992; Wang et al. Citation2006; Walker et al. Citation2012). Symptoms normally present themselves after one to three days and are usually no longer present after one week. The frequency in the urge to defecate, the large volume of liquid feces passed, and the presence of mucus, pus and blood within the feces, depends on the pathogen that is causing the disease. Temporary lactose intolerance can occur (Dupont Citation1978). Under caustic conditions, severe abdominal pain, fever, shock, and delirium can all be symptoms. In extreme cases, patients with dysentery may pass over one liter of fluid per hour. More often, individuals will complain of nausea, abdominal pain, and frequent watery and usually foul-smelling diarrhea, accompanied by mucus and blood, rectal pain and fever. Vomiting, rapid weight-loss, and generalized muscle aches sometimes also accompany dysentery. On rare occasions, an amoebic parasite will invade the body through the bloodstream and spread beyond the intestines. In such cases, it may more seriously infect other organs such as the brain, lungs, and liver. This can lead to impaired nutrient absorption, in addition to excessive water and mineral loss through the stools due to the breakdown of the control mechanisms in the intestinal tissue that normally remove water from the stools; in severe cases pathogenic organisms can enter the bloodstream. Some microorganisms – for example, bacteria of the genus Shigella (Jones et al. Citation2006) – secrete substances known as cytotoxins, which kill and damage intestinal tissue on contact. Viruses directly attack the intestinal cells, taking over their metabolic machinery to make copies of themselves, leading to cell death (Von Seidlein et al. Citation2006). Definitions of dysentery can vary by region and by medical specialty. The U.S. Centers for Disease Control and Prevention (CDC) limits its definition to ‘diarrhea with visible blood’. Others define the term more broadly. These differences in definition must be taken into account when defining mechanisms. For example, using the CDC definition requires that intestinal tissue be so severely damaged that blood vessels have ruptured, allowing visible quantities of blood to be lost with defecation. Other definitions require less specific damage. Due to the complexity of disease transmission, cases of dysentery have remained at, or near their peak in recent years in China, showing a higher incidence than any other intestinal infectious disease. Currently, it is one of the major infectious diseases affecting the health and quality of life of local populations (Weiping et al. Citation2007; Chang et al. Citation2014). The incidence of dysentery is related to many factors, including economic status, hygiene, food and water. Most previous studies have focused on the relationship between the occurrence of dysentery and climatic factors in either time or space (Bo et al. Citation2004). Previous research found that the incidence of dysentery is significantly correlated with precipitation, relative humidity, pressure, and temperature (Li et al. Citation2013; Xiao et al. Citation2014; Xu et al. Citation2017). Researchers have also proposed that meteorological indicators could be used to predict the incidence of bacillary dysentery. For example, dysentery incidence increases by 14.8% for every 1 °C increase in mean temperature in Changsha (Gao et al. Citation2014) and dysentery incidence increases by 0.22% with a 1 mm increase in mean temperature in Beijing (Li et al. Citation2015). The incidence of dysentery can be affected not only by climatic factors, but by social factors as well. For example, Ma et al. analysed the spatial correlation between socio-economic factors and dysentery incidence in Sichuan Province, China. They found that gross regional product (GRP), number of beds in hospitals, and number of medical and technical personnel were significantly negatively related to the risk of bacillary dysentery (Ma et al. Citation2015). Understanding the spatial–temporal variance and the interacting factors that promote this disease would be helpful for controlling its incidence and spread (Huixian et al Citation2004; Yi et al. Citation2011; Zhang et al. Citation2017). Thus far, there is no research on the relationship between railways and the incidence of dysentery. China is the third largest country in the world; it spans a distance of 5400 km from west to east and 5200 km from south to north. Therefore, the average distance between every central city in different regions is far, large-capacity, high-speed, and low-cost are the characteristics of the railway. As a long-distance mode of transportation, it is difficult to replace railways by other modes of transport. With the development of inter-regional economic ties, the demand for long-distance passage will expand in China. The railway will be the main mode of transportation for most people. Moreover, the development of a high-speed railway system will make this mode of transport even more appealing to the long-distance passenger. The main high-speed railway network called ‘four vertical and four horizontal’ was completed in 2015, and it plays an important role in interregional transportation. With the rapid development of the national railway network, passenger numbers have greatly increased. However, this enormous increase in passenger traffic has brought a parallel increase in the chance for people to come into contact with carriers of disease, thereby exposing populations living adjacent to railway lines to a heightened risk of contracting dysentery. It has therefore become a matter of urgency to establish how the distribution of the railway network might be affecting the incidence of dysentery in Jiangsu Province, and how to predict this incidence. Our research established a clear relationship between the incidence of dysentery in Jiangsu Province and the distribution of the railway. It therefore opens up new possibilities for the development of diarrhea prevention strategies.
2. Methods
2.1. Study location
Jiangsu is an eastern-central coastal province of China that shares a border with Shandong in the north, with Anhui lying to the west, and Zhejiang and Shanghai to the south. Jiangsu is the third smallest, but the fifth most populous and the most densely populated of the 23 provinces of China.
Jiangsu is flat, with plains covering 68% of its total area (water covers another 18%). Most of the province stands not more than 50 m above sea level. Large lakes in Jiangsu include Lake Tai (the largest), Lake Hongze, Lake Gaoyou, Lake Luoma, and Lake Yangcheng ().
Figure 1 A map of the study area. Source: Author
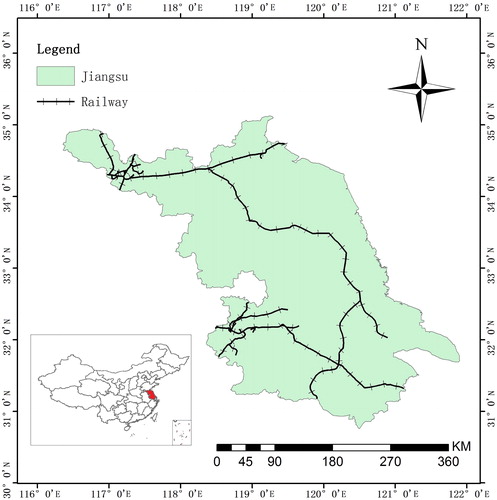
Jiangsu has well-developed railway transportation. The Beijing–Shanghai railway runs from east to west through the southern part of Jiangsu, and the Longhai railway runs from east to west through the northern part of Jiangsu. In addition, it also has the Ningwu railway, Ningqi railway, Ningxi railway, Ninghang intercity, and Ningan intercity passenger line.
2.2. Data collection
2.2.1. Data acquisition
The incidence data of dysentery in Jiangsu Province from 2001 to 2012 was provided by the Chinese Center for CDC. Meteorological data such as mean annual precipitation (MAP) (Curriero et al. Citation2001), mean annual temperature (MAT) (D’Souza et al. Citation2004), mean wind speed, and mean number of hours of sunshine per annum were obtained from the National Meteorological Information Center (http://data.cma.cn/). Socioeconomic data such as industrial waste water discharge (IWWD), industrial waste gas discharge (IWGD), waste disposal capacity (WDC), railway passenger volume (RPV), percentage of sewage disposed (PSD), and daily sewage treatment capacity (DSC) were obtained from the Year Record of Jiangsu 2001–2012.
2.2.2. Data processing
The meteorological data were taken from four stations in Jiangsu Province located at Xuzhou, Ganyu, Nanjing, and Dongtai, and presented as average values. We used five buffer distances for each city, i.e. <5, <10, <15, <20, and <25 km. Dysentery incidence values for each different buffer distance were averaged and taken as the representative incidence value for that buffer distance.
2.3. Specific methods
2.3.1. Spatial analysis
We use Inverse Distance Weighted (IDW) to plot each city’s dysentery incidence from 2001 to 2012 in ArcGIS software (Assunção and Correa Citation2009). The risk of dysentery was divided into six levels based on the number of cases of dysenteric patients per 100,000 inhabitants. For example, if the number of cases in Yangzhou was less than 10 patients per 100,000 inhabitants in 2001, then it was at the lowest level. In contrast, the number of cases in Xuzhou was more than 50 patients per 100,000 inhabitants in 2001, which was the highest level. The different colors displayed by different cities show the differences in the incidence of dysentery. Spatial and temporal distribution patterns were extracted from these plots and used to analyse the relationship between the geographical location of railways and the incidence of dysentery.
2.3.2. Linear regression
In statistics, linear regression is used to model the relationship between a scalar dependent variable y and one or more explanatory (or independent) variables, denoted as x. Where there is only one explanatory variable, the relationship is a simple linear regression. Where there is more than one explanatory variable, the relationship is a multiple linear regression. Linear regression is the easiest way to display the relationship between the dependent and independent variables. The linear predictor function is the easiest way to predict unknown dependent variables.
We used linear regression to express the relationship between the incidence of dysentery and the distribution of railways in Jiangsu Province. Specifically, we used a binary linear regression to consider how railway buffer distances influenced the incidence of dysentery in Jiangsu Province. Feeding a linear regression statement into MATLAB, we established a linear regression equation for expressing the relationship between railway buffer distances and the incidence of dysentery, and the regression’s correlation index.
The image rendering tools inherent in the Excel program were used plot scatter diagrams of railway sites and urban areas adjacent to railway lines. Using a linear regression tool in SPSS, we obtained a linear regression equation for expressing the relationship between the incidence of railway sites and urban areas adjacent to railway lines, and this regression’s correlation index.
2.3.3. Principal composition analysis
Principal component analysis (PCA) is a statistical procedure that uses an orthogonal transformation to convert a set of observations of possibly correlated variables into a set of values of linearly uncorrelated variables called principal components. If there are n observations with p variables, then the number of distinct principal components is min(n − 1, p). This transformation is defined in such a way that the first principal component has the largest possible variance and each succeeding component in turn has the highest variance possible under the constraint that it is orthogonal to the preceding components. The resulting vectors are an uncorrelated orthogonal basis set (Jolliffe Citation2012; Matyasovszky et al. Citation2015).
We used PCA to consider how the meteorological data and social data might influence the parameters of the binary linear regression equation. Using this PCA tool in SAS, we obtained multiple linear regression equations for expressing the relationship between meteorological and social data. The analysis also provided all binary linear regression equation parameters, and the regression’s correlation index.
After performing the PCA, a special transformation of the retained factors was made to discover to what degree the explanatory variables affect the resultant variable, and to give a rank of their influence (Matyasovszky et al. Citation2011).
3. Results
3.1. Spatial analysis
We use ArcGIS to visualize the incidence data of every city in Jiangsu Province in the form of a dysentery distribution map from 2001 to 2012 (Baker Citation2004; Carroll et al. Citation2014; Ahmed et al. Citation2015). The results are as .
Figure 2 Distribution maps of dysentery in Jiangsu Province from 2001 to 2012. Source: Author
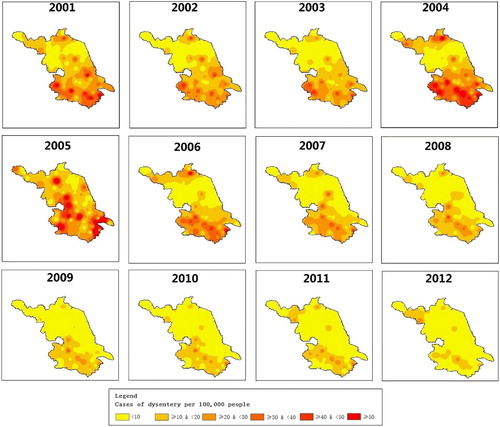
shows that the incidence of dysentery in 2001 was at a relatively high level, with a maximum of 69 patients per 100,000 inhabitants in Taicang and a minimum of 3 patients per 100,000 inhabitants in Xinghua. The incidence of dysentery became lower in 2002 and 2003 and then the highest incidence occurred in 2004 and 2005. In 2004 and 2005, the most patients per 100,000 inhabitants was 107 in Xuzhou and 233 in Haimen, respectively. In 2004, 11cities scored the highest incidence level, while 9 cities scored the highest in 2005. The incidence decreased from 2005 to 2012. In 2012, the number of patients per 100,000 inhabitants was less than 30, except in Xuzhou. Economic development in Jiangsu province, has resulted in the development of medical and health facilities, and an improvement in the people’s standard of living. The incidence of dysentery in Jiangsu province has decreased significantly since 2004, then stayed at a lower level up to 2012.
also shows that the spatial distributions of incidence were similar from 2001 to 2012. In the southern and northern parts of Jiangsu province, the incidence of dysentery was high. For example, in Xuzhou and Zhenjiang, dysentery patients numbered more than 80 per 100,000 people in 2006. However, in central Jiangsu province, the incidence of dysentery has been low. For example, in Lianshui and Dafeng, dysentery patients numbered less than 8 per 100,000 people in 2006.
We further explored the main factors influencing the spatial distributions of dysentery. Taking the dysentery distribution map in 2006 as an example, overlay analysis was used to explore the relationship between the surface water system (La Raja Citation2000), railway lines, and dysentery incidence distribution.
shows that the relationship between the surface water system and dysentery incidence. Central Jiangsu province has a similar area of rivers as the northern part Jiangsu province, but the incidence of dysentery was much less in central than in northern Jiangsu province. Hongze Lake is in the middle of Jiangsu province, but the cities which are near it had lower incidence levels of dysentery. Yangcheng Lake is in southern Jiangsu, and Wuxi, which is nearby, and it had 50 dysentery patients per 100,000 people in 2006. In summary, the surface water system has little effect on the dysentery distribution.
Figure 3 The results of overlay analysis. A) the map of overlay analysis, based on water system and dysentery incidence; b) the map of overlay analysis, based on railway lines and dysentery incidence. Source: Author
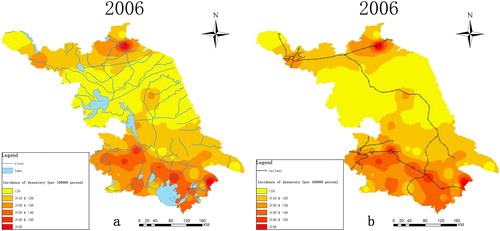
shows that the relationship between railway lines and dysentery incidence. The Longhai line passes through northern Jiangsu province and the Jinghu line passes through southern Jiangsu province. The cities in which railway crosses had the higher levels of incidence of dysentery. In contrast, the cities in which the railway does not cross had the lower levels of incidence of dysentery. Moreover, cities that hosted railway junctions, e.g. Nanjing, Xuzhou, and Lianyungang, had the highest incidence of dysentery in Jiangsu Province. The incidence levels in these cities in 2006 were usually twice the mean incidence value for the province. Cities near railway lines, such as Nanjing, consistently displayed a higher incidence of dysentery than those cities far removed from railway lines, such as Lishui. In 2006, the maximum difference between the highest and lowest levels of dysentery was 48 patients per 100,000 people, and the smallest difference was nine patients per 100,000 people. The results indicate that railways are associated with the transmission of dysentery.
3.2. Linear regression
3.2.1. Relationship between railway buffer distance and the incidence of dysentery
In this research, the railway buffer distance is defined as the minimum distance between a railway zone and the affected area. Railway buffer distances were grouped into <5, <10, <15, <20, and <25 km. There were only two cities with a railway buffer distance >25 km; these exerted little influence on the overall results. The mean incidence of dysentery values for each buffer distance for the period 2001–2012 were then calculated. shows how areas with a longer buffer distance experienced lower levels of dysentery than areas with a shorter buffer distance. In general, as the buffer distance increased incrementally by 5 km, the incidence of dysentery decreased by between 0.5% and 2.0%. The greatest difference in the incidence value tended to occur between the <5 and <10 km buffer distances, although similar differences were noted between <10 and <15 km buffer distances. In 2012, the incidence value decreased incrementally by 0.5% with every 5 km buffer distance away from the railway, displaying a linear trend.
Table 1. The mean incidence of dysentery for each railway buffer distance from 2001 to 2012 (%).
We then drew a line chart using the mean incidence values for each buffer distance for the period 2001–2012.
shows how the incidence of dysentery in Jiangsu Province from 2001 to 2012 has been reduced linearly as the buffer distance increased, in line with the MATLAB results (y = px + b). The independent variable was taken as the maximum buffer distance (5, 10, 15, 20, and 25 km) for each area, and the dependent variable was the mean dysentery incidence value for each area. Except for 2005, all R2 values were >0.84, indicating that the 2001–2012 incidence of dysentery in Jiangsu Province can be taken as linearly related to the railway buffer distance. One of the parameters p of the binary linear regression equation was negative, indicating that the relationship between the two variables is negatively linear. However, these parameters did not remain constant and were affected by differences in annual data. An evaluation of these parameters was therefore necessary ().
Figure 4 Dysentery incidence for each buffer distance during the period 2001 to 2012.
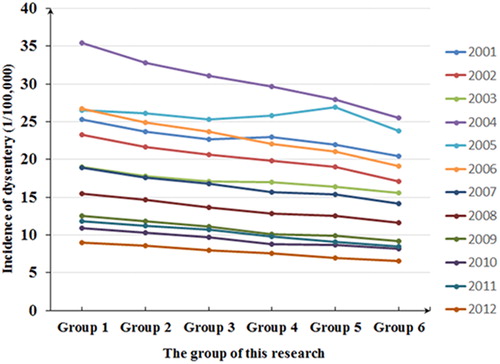
Table 2. Linear fit of the incidence of dysentery versus railway buffer distance from 2001 to 2012.
3.2.2. Analysis of meteorological data and social data affecting the regression parameters
Using the linear fitting analysis outlined above, the incidence of dysentery in Jiangsu Province from 2001 to 2012 showed a negative linear relationship to the railway buffer distance.
However, the two parameters used in the equation did not remain constant. In order to predict the incidence of dysentery, therefore, it became necessary to formulate a predictive equation for the two regression parameters p and b.
We assumed that meteorological data and social data affected the regression parameters. Using the characteristics inherent in bacilli, we selected four meteorological factors (Rongmei et al. Citation2003; Xu et al. Citation2018) controls to detect p and b, i.e. MAP, MAT, sunshine hours, and mean wind speed (Singh et al. Citation2001; Amy et al. Citation2003; Patz et al. Citation2005). Based on previous research, we selected six social data controls to detect p and b, i.e. IWWD, IWGD, WDC, RPV, PSD, and DSC (Lei et al. Citation2007). We used x1, x2, x3,…x10 to represent these ten controls. Our results were calculated using the PCA tool of SAS ().
Table 3. The PCA fits of p and b.
The result shows that both parameter p and parameter b have four principal components, they are z1, z2, z3, and z4:
(1)
(1)
The special transformation of the retained factors was made to discover to what degree the explanatory variables affect the resultant variable, and to rank their influence as shown in .
Table 4. Special transformation. Effect of the explanatory variables on dysentery as resultant variables and the rank of importance of the explanatory variables on their factor loadings transformed to Factor 1 for determining the resultant variable.
The parameter p is used to describe the diffusion of dysentery and b is used to describe the incidence of cities along a particular railway line. The result shows that component z1is less affected by the MAP and sunshine hours; component z2 is likewise affected by MAT, sunshine hours and IWWD; component z3 is likewise affected by mean wind speed and WDC; and component z4 is likewise affected by MAT. These results are consistent with the characteristics of the bacilli that is associated with dysentery. They indicate that the two parameters of the linear regression equation relate the incidence of dysentery and the railway buffer distance as linear relative to the meteorological data and social data. Therefore, the meteorological data, social data, and the railway buffer, can be used to predict the incidence of dysentery in cities along railway lines.
3.2.3. Analysis of the incidence of railway sites and cities along railway lines
Using the calculations outlined in the previous section, the incidence of dysentery in cities along railway lines was predicted. However, as shows, Nanjing, Xuzhou, Lianyungang, and Yangzhou have the highest incidence of dysentery in Jiangsu Province, where the incidence of railway stations is higher than that for cities simply located along railway lines ().
We calculated the mean incidence of dysentery at railway sites and the mean incidence of dysentery in cities lying along railway lines for Jiangsu Province for the 2001–2012 period, and present this as a scatter diagram in .
Table 5. Linear fits of mean railway station incidence versus cities/urban areas located along railway lines.
Figure 5 Scatter diagram of the incidence of dysentery between the railway sites and cities along railway lines.
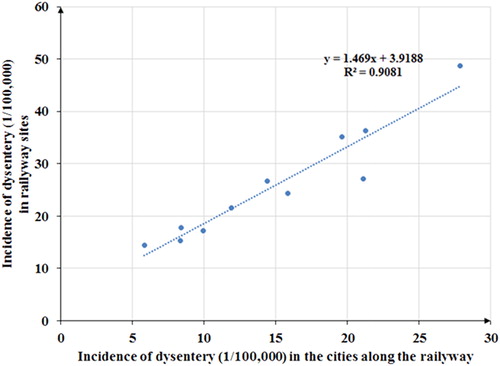
Using the SPSS linear fitting tool, we calculated our results thus:
(5)
(5)
where y is used to describe the incidence of dysentery in railway sites and x is used to describe the incidence of dysentery in the cities simply located along railway lines. As the result shows, the mean incidence of dysentery in railway sites is 1.47 times greater than that of the actual number of cities located along railway lines. The R2 value for this equation is >0.9, which suggests that the incidence of dysentery in railway sites is linearly related to the incidence of dysentery in cities located along railway lines. The incidence of dysentery in cities located along railway lines can then be combined with any calculation of the incidence dysentery in railway sites.
4. Discussion
We investigated the spatial and temporal distribution characteristics of dysentery incidence and how railway factors influence the incidence of dysentery in Jiangsu Province. The incidence of dysentery peaked in 2004. Then, as the economy in Jiangsu province developed, the medical and health facilities also developed, along with the improvement in people’s standard of living. The incidence of dysentery in Jiangsu province has decreased significantly since 2004, and remained at a lower level until 2012. The distribution patterns remained consistent across all years. By comparing the surface water system, railway lines, and the distribution of dysentery, we conclude that railways are associated with the transmission of dysentery while the surface water system has little effect on the distribution of dysentery. This is consistent with our original hypothesis.
We detected a strong linear dependence between the railway buffer distance and the incidence of dysentery in Jiangsu Province, with cities far from the railway tending to have lower levels of incidence of dysentery. The two parameters (p and b) of the regression equation can be predicted using meteorological factors and social factors.
The parameter p represents the degree of the gradient of the regression equation. It shows the incremental change in the railways buffer distance, and can therefore be directly related to the incidence of dysentery. In our study, p was negative. A high absolute value of p represents a powerful resistance to the transmission of dysentery. However, as the absolute value of p increased, any resistance to the transmission of dysentery lessened. Such a resistance to the transmission of the disease may also be affected by the effectiveness of the medical responses in different areas of Jiangsu Province, by other factors which may make local populations more sensitive to the transmission of dysentery, and by any circumstances present during such a transmission. shows p increasing from 2006 to 2012, indicating the presence of factors more favorable to the growth and transmission of the disease, and implying that outbreaks of dysentery were becoming harder to control and more difficult to prevent from spreading.
As the intercept of the regression equation, the parameter b shows the incidence of dysentery in cities with a railway buffer distance of 0. This can therefore be taken as a base value for the incidence of dysentery in urban areas in Jiangsu Province. A higher b value equates to most cities in Jiangsu experiencing a greater incidence of dysentery. shows b decreasing from 2001 to 2003, and the decreasing again from 2004 to 2012. Its peak was reached in 2004. This agrees with the trend shown in . The incidence of dysentery around railway junctions is higher than in cities without transportation hubs. This can be explained by the higher number of passengers that pass through railway hubs than in cities where trains pass through without stopping, and can also therefore account for the easier transmission of the disease to local residents. It would be beneficial to study this link between railway junctions and the higher incidence levels of dysentery, as it would appear that transmission of the disease is more common in such transportation hubs.
The research presents a new method to aid the study of the incidence of dysentery based upon the distribution of railway lines and stations. It suggests a link between the occurrence of dysentery and the railway. It may be useful in determining measures to prevent and control the spread of this dangerous disease.
5. Conclusions
Economic development in Jiangsu province has led to the development of medical and health facilities and the improvement of people’s standard of living. The incidence of dysentery in Jiangsu province decreased and remained at a lower level up to 2012 (the end of our study period). However, immunity to dysentery cannot be sustained after a patient has been cured of the disease. Relative to other infectious diseases, the incidence of dysentery remains the highest. Therefore, the prevention of dysentery remains the focus of our work in infectious disease control. The presence of railway stations and junctions is related to rates of dysentery in the cities and urban areas of Jiangsu Province. This research attempts to develop a new method, based upon the relationship between the incidence values of railways and of dysentery, to predict the rates of dysentery, and thus develop approaches to prevent and control the spread of the disease. We conclude that railway distribution is linked to the transmission of dysentery. Thus, we can focus on railways and railway sites as we allocate health resources toward the prevention and control of dysentery. Further research should aim to investigate any correlation between the density of railway networks, passenger capacity, and incidence of dysentery. The resulting predictive model should be useful for improving any existing control measures.
The term ‘Mey ju’ is derived from the names of June and July, when the plums in the Jiangnan Area ripen, and the climate is usually overcast and rainy in Jiangsu province. In the follow part of this paper, we have researched if the condition of ‘Mey ju’ was a factor in dysentery. The results shows that there are no correlation between ‘Mey ju’ and incident of dysentery. Therefore, in this paper, we don't take ‘Mey ju’ as one of the factor of dysentery
Acknowledgments
We should like to thank for Professor Guo for supplying data, and Haifang Guo, Yibin Xu, Yu Wang, and Meng Xiao for discussions of the material presented in this article.
Disclosure statement
No potential conflict of interest was reported by the authors.
Additional information
Funding
Related Research Data
References
- Ahmed KMS, Hamid AA, Doka A. 2015. Investigation of spatial risk factors for RVF disease occurrence using remote sensing & GIS—a case study: Sinnar State, Sudan. JGIS. 7:226–257.
- Amy CM, Arthur G, Marilyn S, Jose GR-P, Kun C, Chunyu T. 2003. The relationship with dysentery and meteorological factors. Zhejiang J Prev Med. 15(3):7–9.
- Assunção R, Correa T. 2009. Surveillance to detect emerging space-time clusters. Comput Stat Data Anal. 53(8):2817–2830.
- Baker RD. 2004. Identifying space-time disease clusters. Acta Trop. 91(3):291–299.
- Bo Q, Peng G, Baosen Z. 2004. The research of the effect of dry areas meteorological factors on common infectious disease research. J China Med Univ. 33(1):34–39.
- Carroll LN, Au AP, Detwiler LT, Fu T-C, Painter IS, Abernethy NF. 2014. Visualization and analytics tools for infectious disease epidemiology: A systematic review. J Biomed Inform. 51:287–298.
- Chang ZR, Sun QZ, Pei YX, Zhang J, Sun JL. 2014. Bacillary dysentery epidemic characteristics and monitoring result analysis in mainland China in 2012. Dis Surv. 29(7):528–532.
- Curriero F, Patz J, Rose J, Lele S. 2001. The association between extreme precipitation and waterborne disease outbreaks in the United States, 1948–1994. Am J Public Health. 91(8):1194–1199.
- D’Souza R, Becker N, Hall G, Moodie K. 2004. Does ambient temperature affect foodborne disease? Epidemiology. 15:86–92.
- Dupont HL. 1978. Interventions in diarrheas of infants and young children. J Am Vet Med Assoc. 173(2):649–653.
- Gao L, Zhang Y, Ding G, Liu Q, Zhou M, Li X, Jiang B. 2014. Meteorological variables and bacillary dysentery cases in Changsha City, China. Am J Trop Med Hyg. 90(4):697–704.
- Huixian X, Weizhong Y, Hanzhang W. 2004. Prediction of infectious disease. J Prev Med Inf. 20(6):639–642.
- Jolliffe IT. 2012. Principal component analysis: A beginner’s guide – II. Pitfalls, myths and extensions. Weather. 48(8):246–253.
- Jones RC, Liberatore M, Fernandez JR, Gerber SI. 2006. Use of a prospective space-time scan statistic to prioritize shigellosis case investigations in an urban jurisdiction. Public Health Rep. 121(2):133–138.
- La Raja M. 2000. Cholera-like diarrhoeal disease and rivers in rural Mozambique. Trop Doct. 30(1):53–54.
- Lei J, Weihua C, Xiong H. 2007. The influence factors of the incidence of dysentery. Chin J Public Health. 8(23):8.
- Li ZJ, Zhang XJ, Hou XX, Xu S, Zhang JS, Song HB, Lin HL. 2015. Nonlinear and threshold of the association between meteorological factors and bacillary dysentery in Beijing, China. Epidemiol Infect. 143(16):3510–3519.
- Li ZJ, Wang LG, Sun WG, Hou XX, Yang HY, Sun LN, Xu S, Sun QZ, Zhang JS, Song HB, et al. 2013. Identifying high-risk areas of bacillary dysentery and associated meteorological factors in Wuhan, China. Sci Rep – UK. 3:3239.
- Lvyuan S, Liming L, Dongqing Y. 1992. Epidemiology. People's Medical Publishing House; p. 454–470.
- Ma Y, Zhang T, Liu L, Lv Q, Yin F. 2015. Spatio-Temporal pattern and socio-economic factors of bacillary dysentery at county level in Sichuan province, China. Sci Rep. 5:15264.
- Matyasovszky I, Makra L, Csépe Z, Sümeghy Z, Deák ÁJ, Pál-Molnár E, Tusnády G. 2015. Plants remember past weather: a study for atmospheric pollen concentrations of Ambrosia, Poaceae and Populus. Theor Appl Climatol. 122(1–2):181–193.
- Matyasovszky I, Makra L, Bálint B, Guba Z, Sümeghy Z. 2011. Multivariate analysis of respiratory problems and their connection with meteorological parameters and the main biological and chemical air pollutants. Atmos Environ. 45(25):4152–4159.
- Patz JA, Campbell-Lendrum D, Holloway T, Foley JA. 2005. Impact of regional climate change on human health. Nature. 17(438):310–317.
- Rongmei T, Kun C, Chunyu T. 2003. The relation with dysentery and meteorological factors. Zhejiang J Prev Med. 15(3):7–9.
- Singh R, Hales S, Wet N, Raj R, Hearnden M, Weinstein P. 2001. The influence of climate variation and change on diarrheal disease in the Pacific Islands. Environ Health Perspect. 109(2):155–159.
- Von Seidlein L, Kim DR, Ali M, Lee H, Wang X, Thiem VD, Canh DG, Chaicumpa W, Agtini MD, Hossain A, Et A. 2006. A multicentre study of Shigella diarrhoea in six Asian countries: disease burden, clinical manifestations, and microbiology. PLoS Med. 3(9):1556–1569.
- Walker CLF, Aryee MJ, Boschi-Pinto C, Black RE. 2012. Estimating diarrhea mortality among young children in low and middle income countries. PLoS One. 7(1):e29151.
- Wang X-y, Tao F, Xiao D, Lee H, Deen J, Gong J, Zhao Y, Zhou W, Li W, Shen B, et al. 2006. Trend and disease burden of bacillary dysentery in China (1991-2000). Bull World Health Organ. 84(7):561–568.
- Weiping R, Lili H, Jiayong Z. 2007. Bacterial dysentery epidemic situation and the analysis of characteristics of pathogens in Henan from 2005 to 2009. Modern Prev Med. 34(21):4139–4141.
- Xiao GX, Xu CD, Wang JF, Yang DY, Wang L. 2014. Spatial-temporal pattern and risk factor analysis of bacillary dysentery in the Beijing-Tianjin-Tangshan urban region of China. BMC Public Health. 14998.
- Xu C, Xiao G, Wang J, Zhang X, Liang J. 2018. Spatiotemporal Risk of Bacillary Dysentery and Sensitivity to Meteorological Factors in Hunan Province, China. IJERPH. 1547.
- Xu C, Li Y, Wang J, Xiao G. 2017. Spatial-temporal detection of risk factors for bacillary dysentery in Beijing, Tianjin and Hebei, China. BMC Public Health. 17(1):743.
- Yi Z, Xiaowen P, Guilan L. 2011. Prediction of influenza virus activity with three kinds of models from 2011 to 2012. Int J Virol. 18(6):175–178.
- Zhang H, Si Y, Wang X, Gong P. 2017. Environmental drivers and predicted risk of bacillary dysentery in Southwest China. IJERPH. 14782.