
 ?Mathematical formulae have been encoded as MathML and are displayed in this HTML version using MathJax in order to improve their display. Uncheck the box to turn MathJax off. This feature requires Javascript. Click on a formula to zoom.
Abstract
Landslide susceptibility mapping is essential in delineating landslide prone areas in mountainous regions. The primary purpose of this study is to evaluate landslide susceptibility mapping using three methods, information value (IV), weights-of-evidence (WofE), and certainty factor (CF) in southeastern Gansu province, China. Firstly, the landslide in the study area was located mainly using aerial-photo interpretation and field surveys. A total of 529 landslides were randomly divided using a ratio of 70/30 for training and validation of these methods. Eight landslide conditioning factors including slope angle, altitude, NDVI, distance to faults, distance to roads, distance to rivers, rainfall, and lithology, were considered. Landslide susceptibility maps were produced for each of the three methods. Susceptibility maps were verified and compared using the area under the curve (AUC) method. The success rate curve demonstrated that the AUC for the IV, WofE, and CF methods was 88.02, 87.56, and 89.04%, respectively, and the prediction rate curve showed that the AUC was 86.24, 86.34, and 87.44%, respectively. Furthermore, results showed that CF method had the highest accuracy in comparison with other methods. Generally, the three methods showed reasonable accuracy in landslide susceptibility mapping. Results of this study can serve as guidelines to managers and policy makers regarding the prevention and mitigation of landslide hazards.
1. Introduction
Landslides, occurring suddenly and causing substantial damage to people and property, are dangerous natural hazards. Landslides occur frequently in hill and mountain terrains. The frequency of landslide occurrences increases with growing human population (Chen et al. Citation2016). Globally, landslides cause thousands of casualties and fatalities per year and property damage of billions of dollars (Lee and Pradhan Citation2007). Scientific assessment of landslide prone areas is highly significant for mitigating and controlling landslide disasters.
Current landslide susceptibility mapping methods can be grouped into qualitative and quantitative methods. Qualitative methods are a heuristic or expert-driven approach, based on the field practical field experience of specialists (Sujatha et al. Citation2014). Quantitative methods are indirect mapping techniques, based on mathematical expressions of the correlation between causal variables and landslides (Wang et al. Citation2014). Over the years, both types of methods have been used in conjunction with geographic information systems (GIS) to assess landslide susceptibility (Dahal et al. Citation2008; Regmi et al. Citation2010; Mohammady et al. Citation2012; Kayastha et al. Citation2013; Bourenane et al. Citation2015; Wang et al. Citation2016; Sujatha Citation2017; Sujatha and Sridhar Citation2017). There are many statistical models used in landslide hazard analysis, including the frequency ratio method (Mohammady et al. Citation2012; Kayastha Citation2015; Wang et al. Citation2016; Bourenane et al. Citation2016; Chen et al. Citation2017a), statistical index method (Bui et al. Citation2011; Pourghasemi et al. Citation2013a; Razavizadeh et al. Citation2017), weights of evidence method (Dahal et al. Citation2008; Wang et al. Citation2016; Razavizadeh et al. Citation2017), certainty factor method (Kanungo et al. Citation2011; Sujatha et al. Citation2012), and logistic regression method (Ayalew and Yamagishi Citation2005; Lee and Pradhan Citation2007; Yilmaz Citation2009; Chen et al. Citation2017c). Other varieties of classification techniques, such as fuzzy systems (Oh and Pradhan Citation2011; Sezer et al. Citation2011), decision-trees (Saito et al. Citation2009; Pradhan Citation2013), neural networks (Yesilnacar and Topal Citation2005; Ermini et al. Citation2005; Pham et al. Citation2017), and support vector machines (Yao et al. Citation2008; Pradhan Citation2013), have been used to assess landslide risk. The primary difference between this study and other research is the application and comparison of the information value (IV), weights-of-evidence (WofE), and certainty factor (CF) methods for landslide susceptibility mapping.
This paper attempts to evaluate and compare results from landslide susceptibility maps using three statistical methods, that is, IV, WofE, and CF methods in Wen County (China). The performance of these landslide susceptibility maps are verified and compared using the area under the curve (AUC) method.
2. Study area and data
2.1. Study area
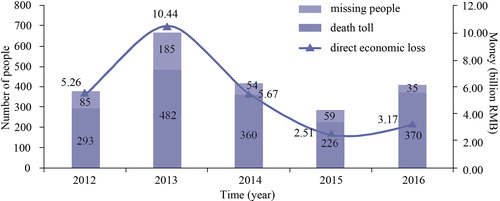
In China, geological hazards, causing hundreds of casualties and fatalities, and hundreds of millions of dollars worth of damage each year (), happen rather frequently due to the topographical, geological, and environmental factors. Landslides are one of the most serious natural hazards. According to statistics, landslides account for more than 70% of geological disasters in China every year. The average annual economic loss is nearly sixty million dollars (Yan et al. Citation2017). Northwestern China is usually more serious region suffering landslide disaster in the whole country.
Figure 1 shows the number of missing people, deaths, and direct economic losses due to geological disasters from 2012 to 2016 in China (http://www.mlr.gov.cn/). Source: Derived from “China’s Land and Resources Bulletin”
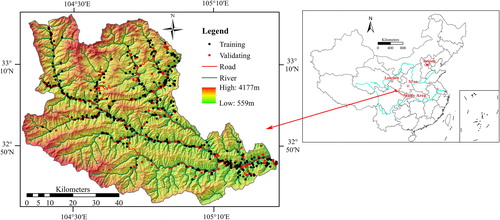
The study area is located in southeastern Gansu province, northwestern China, which lies between 32°35′43″ to 33°20′36″N and 104°16′16″ to 105°27′29″E and has an area of approximately 4,994 km2 (). Elevation in the study area ranges from 559 to 4,177 m, and steep slopes are common. The study area belongs to a typical warm temperate humid monsoon climate. The mean annual temperature is 15 °C, while the maximum and minimum mean annual temperatures range between 24.8 and 3.6 °C, respectively. The maximum mean annual rainfall varies from 400 to 800 mm and is concentrated primarily between May and August (Qiao et al. Citation2017; Wang et al. Citation2018a). The Bailong and Baishui Rivers, running from west to east into Jialing River, are among the larger river systems within the boundary of the Wen County. In the study area, landslides occur frequently due to special geomorphological, geological, and hydrogeological conditions. A total of 529 landslides were identified and mapped (). These landslides are primarily distributed along roads or rivers and concentrated in groups were shallow soil can slip and debris flows are common. Medium-model landslides (volume less than 0.1 million cubic meters) and little-model landslides (volume greater than 0.1 million but smaller than 10 million cubic meters) account for approximately 80% of all landslides. Slope failures in this study area are severe and frequent, which resulted in considerable loss of life and property from local residents. Currently, not much work has been done on landslide susceptibility and risk analysis in Wen County. Therefore, it is necessary to assess the landslide susceptibility of the study area.
Figure 2 Geographical location of the study area.
2.2. Data
The landslide inventory map records the locations and characteristics of landslide (Wang et al. Citation2016; Chen et al. Citation2017b) and is the premise of landslide susceptibility analysis. In the study area, landslides were identified and mapped through interpretation of 1:50,000 scale aerial-photography and field surveys. In addition, some historical landslides records were obtained from published literature (Xie Citation2013; Bi Citation2014). The landslide inventory was randomly divided into two datasets 70% (370 landslides) for training the models and the remaining 30% (159 landslides) was used for validating the model.
Determination of landslide condition related to terrain, geology, and anthropogenic activities is essential for landslide susceptibility mapping. In the present study, eight thematic layers including slope angle, altitude, normalized difference vegetation index (NDVI), distance to faults, distance to roads, distance to rivers, rainfall, and lithology, were prepared and analyzed.
Slope angle is a primary parameter in slope stability analysis because slope angle has a direct influence on shear strength (Zhang et al. Citation2017). In this study, slope angle was calculated using ArcGIS 10.0 based on digital elevation model data and was divided into six slope categories (). Altitude is also frequently used in preparing landslide susceptibility maps because it is controlled by several geologic and geomorphological processes (Pradhan and Kim Citation2014; Wang and Li Citation2017; McQuillan et al. Citation2018). The elevation values in study area were divided into seven categories using an interval of 400 m (). NDVI is often considered as a conditioning factor in landslide susceptibility mapping. In this study, the NDVI map was obtained from Landsat satellite imagery and was classified into five classes ().
Figure 3 Landslide conditioning factor maps showing: (a) slope angle, (b) altitude, (c) NDVI, (d) distance to faults, (e) distance to roads, (f) distance to rivers, (g) rainfall, and (h) lithology.
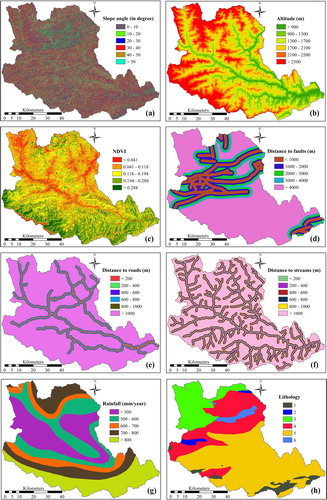
In this study, the proximity to faults, roads, and river were used for landslide susceptibility analysis. Landslide distribution correlates strongly with the tectonic fractures that commonly decrease rock strength. The landslides occurred primarily along faults and the number of landslides decreases sharply with increasing distance from faults (Xu et al. Citation2012). In study area, five different distances to faults buffer zones were prepared (). Generally, landslides occur along road cuts due to excavation, additional hydrologic load change, and drainage during the road construction process (Gayen and Saha Citation2017). Similarly, distance to rivers is an important landslide conditioning factor since runoff commonly decrease slope stability and leads to landslides by eroding slopes (Solaimani et al. Citation2013). A map showing a 200 m buffer zone around roads and rivers is shown in , respectively.
Rainfall, affecting slope stability through run-off and pore water pressure, is also widely considered as a primary triggering factor of landslides (Bourenane et al. Citation2016). In this study, a precipitation map was prepared using rainfall data from monitoring stations and was divided into five categories (). Lithology is also one of the most common determining factors in landslide susceptibility maps. Rocks may vary in strength and permeability because of structural variations (Bourenane et al. Citation2016; Wang and Chen Citation2017; Wang et al. Citation2018b). Lithologies of the geological unit in the study area are given in and .
Table 1. Lithologies of the geological unit in the study area (Xie Citation2013).
3. Methodology
3.1. Information value (IV) method
The information value (IV) method, originally proposed by Yin and Yan (Citation1988) and slightly modified by van Westen (Citation1993), is a statistical analysis method developed from information theory (Xu et al. Citation2013). This model has been widely used in landslide susceptibility analysis by various researchers (van Westen Citation1993; Bui et al. Citation2011; Bhandary et al. Citation2013; Xu et al. Citation2013; Bourenane et al. Citation2015). In this model, the IV for each parameter class is defined as the natural logarithm of the landslide density in a class divided by the landslide density of the entire map (EquationEquation 1(1)
(1) ) (van Westen Citation1993; Bui et al. Citation2011).
(1)
(1)
where, Ii is the weight given to the class of a parameter; Densclass is the landslide density within a parameter class; Densmap is the total landslide density within the entire map;
is the number of landslides in a certain parameter class;
is the number of pixels in a certain parameter class; N is the total number of landslides in the entire map; and n is the number of classes in a parameter map.
The resulting weights of all thematic layers used in this study were calculated using ArcGIS 10.0 and Microsoft Excel (). The higher the weight, the higher the possibility that a landslide occurs within a given area.
Table 2. Spatial relationship between each conditioning factor and landslide using IV, WofE, and CF methods.
3.2. Weights-of-evidence (WofE) method
The weights-of-evidence (WofE) method is a statistical method using the Bayesian probability model, which was originally developed for mineral potential assessment (Bonham-Carter et al. Citation1988). The WofE has been widely applied in many landslide susceptibility assessments (Van Westen Citation2000; Dahal et al. Citation2008; Hussin et al. Citation2016). A detailed description of the WofE mathematical equation of the method is given in several research papers (Bonham-Carter et al. Citation1988; Dahal et al. Citation2008; Sujatha et al. Citation2014; Rahmati et al. Citation2016). The WofE method is based on the determination of positive (W+) and negative weights (W−). The method calculates the weight for each landslide conditioning factor (B) based on the presence or absence of landslides (L) within a specific area as follows (Bonham-Carter Citation1994):
(2)
(2)
(3)
(3)
where P is the probability ratio and ln is the natural logarithm. W+ and W− weights indicate positive and negative correlations between landslides occurrence and a variable, respectively (Bourenane et al. Citation2016). The weight contrast (C), considered to be measure of the overall importance of a parameter map class (Hussin et al. Citation2016), is given by the difference between two weights (C = W+ − W−). The standard deviation of W is calculated as follows:
(4)
(4)
where S2(W+) and S2(W−) are the variance of the W+ and W− weights, respectively. The studentized contrast Wf, giving a measure of confidence, is defined as following (Kayastha et al. Citation2012):
(5)
(5)
3.3. Certainty factor (CF) method
The certainty factor (CF) method, defined as a function of probability, has been widely considered and experimentally investigated for landslide susceptibility (Sujatha et al. Citation2012; Pourghasemi et al. Citation2013b; Liu et al. Citation2014). The CF method was originally proposed by Shortliffe and Buchanan (Citation1975) and later modified by Heckeman (Citation1986), as follows:
(6)
(6)
where ppa is the conditional probability of a landslide event occurring in class a, and pps is the prior probability of total number of landslides occurring in the study area (Binaghi et al. Citation1998). Certainty factor value ranges from −1 to 1. A positive value indicates an increasing certainty of landslide occurrence, while a negative value corresponds to a decreasing certainty of landslide occurrence. A value close to 0 indicates that the initial probability is very similar to the conditional probability; hence, it is difficult to provide any information about the certainty of the landslide occurrence (Kanungo et al. Citation2011; Sujatha et al. Citation2012; Devkota et al. Citation2013).
The CF values for each class of the selected factors were first calculated by EquationEquation (6)(6)
(6) (). CF values for the conditioning factors were pairwise tested according to the CF combination rule (Chung and Fabbri Citation1993; Binaghi et al. Citation1998; Luzi and Pergalani Citation1999; Tsangaratos and Ilia Citation2016):
(7)
(7)
where x and y are two different layers of information, and Z is the obtained CF value.
By using the parallel-combination function (EquationEq. 7(7)
(7) ), the pairwise combination operates until all CF layers are brought together to obtain the landslide susceptibility index (LSI).
4. Landslide susceptibility analysis
The weight values for different classes of conditioning factors are given in , indicating the importance of each factor. Weight values are assigned to each factor layer to generate weighted thematic maps. The LSI value was calculated by summation of each factor’s ratings using EquationEquation (8)(8)
(8) ,
(8)
(8)
where WC is the weight of each class of factors.
In this study, LSI values were calculated using ArcGIS10.0. The LSI values based on the IV, WofE, and CF methods vary from −8.5 to 8.0, −64.6 to 90.0, and −1 to 0.996, respectively. High LSI values indicate higher susceptibility to landslides, while a lower LSI values indicate lower susceptibility to landslides. LSI values were classified using the natural break method and grouped into four susceptibility classes: low, moderate, high, and very high (). The percentage of observed landslides in various susceptibility classes was counted ().
Figure 4 Landslide susceptibility map produced using the information value method.
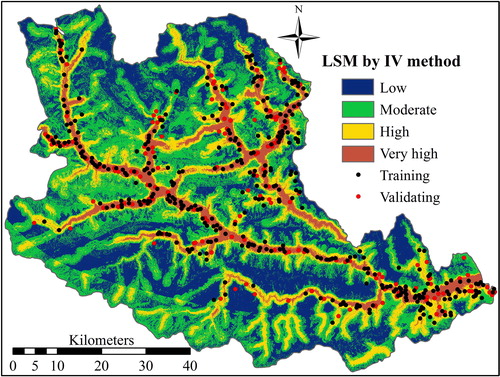
Figure 5 Landslide susceptibility map produced using the weights-of-evidence method.
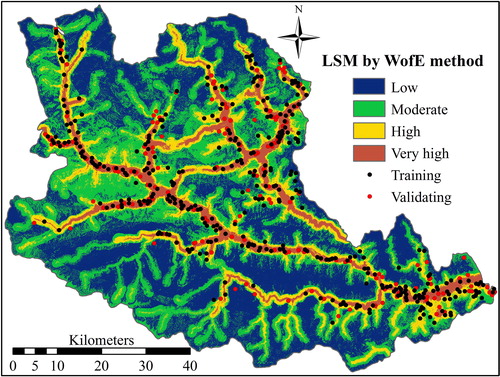
Figure 6 Landslide susceptibility map produced using the certainty factor method.
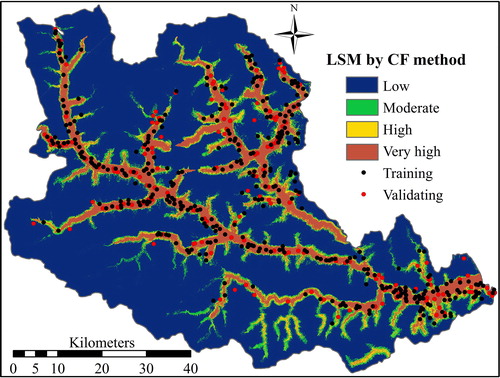
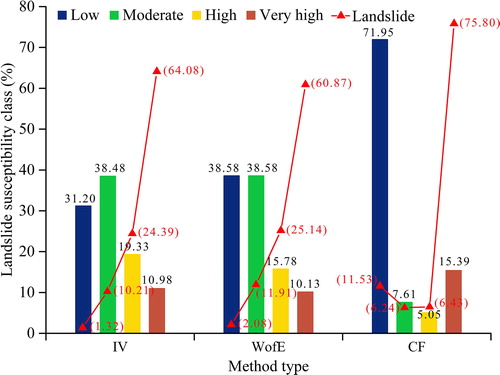
Figure 7 Graph showing landslide susceptibility classes delimited by method.
5. Validation of susceptibility maps
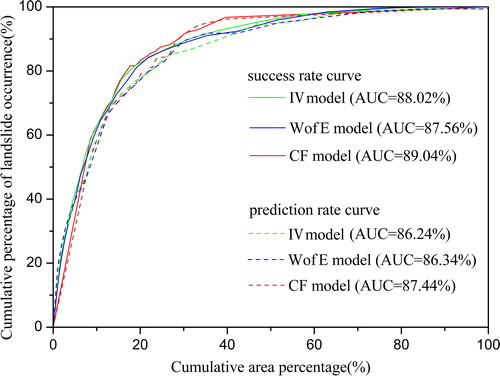
The area under curve (AUC) method using success and prediction rate curves (Razavizadeh et al. Citation2017) was used to validate the evaluation results. The rate curves show the cumulative percentage of observed landslide occurrences (x-axis) versus cumulative percentage of decreasing LSI value (y-axis) (Kamp et al. Citation2010; Kayastha et al. Citation2012). The AUC value suggests prediction accuracy of the susceptibility map qualitatively. Larger values indicate higher accuracy (Intarawichian and Dasananda Citation2011). In this study, success rate and prediction rate curves were created using training data and validation data, respectively (). The CF method had the highest success rate of 89.04%, followed by IV (88.02%) and WofE (87.56%) (). Prediction rate curves show that the prediction ability is highest for CF (87.44%), followed by IV (86.24%) and WofE (86.34%). Methods employed in this study are reasonably accurate in predicting landslide susceptibility in the study area. The map produced by the CF model exhibited the best result for the purpose of landslide susceptibility mapping.
Figure 8 Success rate and prediction rate curves for each susceptibility map.
6. Results and discussion
The correlation between landslide locations and landslide conditioning factors, that is, slope angle, altitude, NDVI, distance to faults, distance to roads, distance to rivers, rainfall, and lithology was determined using the IV, WofE, and CF methods (). Given that higher values of I, Wf, and CF indicate a higher level for a specific conditioning factor class, the distance to roads has the highest impact on landslide susceptibility, followed by altitude, distance to rivers, and NDVI, Lithology is comparatively less significant for determining LSI. In the study area, the topographic and geological conditions are complex, and road construction activity greatly alters the topography and original slope conditions, geological conditions, and natural stability. Therefore, the probability of landslide occurrence is highest near roads. The difference in lithology in the study area is not significant, indicating lithology has a smaller influence on landslides. Landslides are most common on slopes from 20°–30°, and the lowest values of I, Wf, and CF are for slopes >50° (). It is clear that the landslide occurrence increases with increasing slope angle to a certain extent, and then, it decreases. A similar pattern was also observed in some published literatures (Jaafari et al. Citation2014; Wang et al. Citation2015). Landslide occurence is highest at altitudes <900 m, with the maximum (I = 1.978, Wf =20.295, and CF = 0.862) at an altitude <900 m, indicating that the probability of landslide occurrence is greater at altitudes <900 m compared with altitudes >900 m. NDVI values below 0.041 are relatively favorable (high susceptible) for landslide occurrence, indicating that relatively low vegetation coverage can easily lead to landslide occurrence. Regarding distance to rivers and roads, distances <200 m have the highest I, Wf, and CF values, and distances >1,000 m show a very low LSI, indicating that the smaller the distance to a river or road, the more susceptible that area is to landsliding. Landslide occurrence probability is higher in areas where the distance to faults is <1,000 m. For rainfall, most landslides occurred in class <500 mm/year. The relation between lithology and landslide probability shows group 4 (see in details in ) has a highest values, indicating the probability of landslide occurrence in this lithological unit is highest.
Highly and very highly susceptibility areas are primarily distributed around rivers, whereas low and moderately susceptibility areas are primarily distributed in high-altitude alpine areas. Highly and very highly susceptibility zones cover more than 20% of the study area () and the percentages of very high susceptibility areas from the IV, WofE, and CF methods are 10.98, 10.13, and 15.39%, respectively. The percentages of the total landslides in the very high susceptibility class in the maps produced by IV, WofE, and CF methods are 64.08, 60.87, and 75.80%, respectively (). In addition, it should be noted that the validation results show the accuracies for the various methods are not very different from each other. They lie in the same range. So here selected factors play a more important role than the method.
7. Conclusions
Landslide susceptibility mapping is a fundamental tool for disaster management in mountainous terrains. In this paper the influence of landslide condition factors including slope angle, altitude, NDVI, distance to faults, distance to roads, distance to rivers, rainfall, and lithology on landslides and their potential distribution in Wen county of northwestern China were analyzed using the IV, WofE, and CF methods. During this process, landslide locations were identified using aerial-photo interpretation supported by available literature and field surveys. As a result, 70% of identified landslides (529 landslides) were used as training data and the remaining (30%) were used to validate the methods. Landslide susceptibility maps produced by the IV, WofE, and CF methods have been classified into four classes: low, moderate, high, and very high and using the natural breaks method. The obtained LSM has been validated by comparison with known landslide locations. According to the AUC function, the training accuracy was 0.8802 (88.02%), 0.8756 (87.56%), and 0.8904 (89.04%) for the IV, WofE, and CF methods, respectively. In addition, the CF model showed higher prediction performance (87.44%) than the IV (86.24%) and WofE (86.34%) methods. Thus, the performance of the produced susceptibility map by CF method was slightly higher than that of the maps produced by the IV and WofE methods. Each of the three methods is useful in analyzing the relationship between factors influencing landslides. In this study area, areas near roads are the most susceptible to landslides. It is recommended that a landslide control project be carried out employing anti-slide piles, slope cutting, and vegetation planting along roads in the high susceptibility zones. In addition, evaluation results can be used as guidelines for policy makers regarding prevention and mitigation of landslide hazards.
Acknowledgements
The authors would like to express their gratitude to everyone who provided assistance for the present study.
Disclosure statement
No potential conflict of interest was reported by the authors.
Additional information
Funding
References
- Ayalew L, Yamagishi H. 2005. The application of GIS-based logistic regression for landslide susceptibility mapping in the Kakuda-Yahiko Mountains, Central Japan. Geomorphology. 65(1-2):15–31.
- Bhandary NP, Dahal RK, Timilsina M, Yatabe R. 2013. Rainfall event-based landslide susceptibility zonation mapping. Nat Hazards. 69(1):365–388.
- Bi YH. 2014. Study on evaluation and control of Nanshan geologic hazards of Wen County (Master's thesis, Lanzhou University).
- Binaghi E, Luzi L, Madella P, Pergalani F, Rampini A. 1998. Slope instability zonation: a comparison between certainty factor and fuzzy Dempster-Shafer approaches. Nat Hazards. 17(1):77–97.
- Bonham-Carter GF. 1994. Geographic information systems for geoscientists: modeling with GIS. Ottawa: Pergamon Press; p. 398.
- Bonham-Carter GF, Agterberg FP, Wright DF. 1988. Integration of geological datasets for gold exploration in Nova Scotia. Photogramm Eng Remote Sens. 54:1585–1592.
- Bourenane H, Bouhadad Y, Guettouche MS, Braham M. 2015. GIS-based landslide susceptibility zonation using bivariate statistical and expert approaches in the city of Constantine (Northeast Algeria). Bull Eng Geol Environ. 74(2):337–355.
- Bourenane H, Guettouche MS, Bouhadad Y, Braham M. 2016. Landslide hazard mapping in the constantine city, northeast Algeria using frequency ratio, weighting factor, logistic regression, weights of evidence, and analytical hierarchy process methods. Arab J Geosci. 9:1–24.
- Bui DT, Lofman O, Revhaug I, Dick O. 2011. Landslide susceptibility analysis in the Hoa Binh province of Vietnam using statistical index and logistic regression. Nat Hazards. 59(3):1413–1444.
- Chen W, Chai H, Sun X, Wang Q, Ding X, Hong H. 2016. A GIS-based comparative study of frequency ratio, statistical index and weights-of-evidence models in landslide susceptibility mapping. Arab J Geosci. 9:1–16.
- Chen W, Pourghasemi HR, Panahi M, Kornejady A, Wang J, Xie X, Cao S. 2017a. Spatial prediction of landslide susceptibility using an adaptive neuro-fuzzy inference system combined with frequency ratio, generalized additive model, and support vector machine techniques. Geomorphology. 297:69–85.
- Chen W, Shirzadi A, Shahabi H, Ahmad BB, Zhang S, Hong H, Zhang N. 2017b. A novel hybrid artificial intelligence approach based on the rotation forest ensemble and naïve Bayes tree classifiers for a landslide susceptibility assessment in Langao County, China. Geomat Nat Hazards Risk. 8(2):1955–1977.
- Chen W, Xie X, Peng J, Wang J, Duan Z, Hong H. 2017c. GIS-based landslide susceptibility modelling: a comparative assessment of kernel logistic regression, Naïve-Bayes tree, and alternating decision tree models. Geomat Nat Hazards Risk. 8(2):950–973.
- Chung CJF, Fabbri AG. 1993. The representation of geoscience information for data integration. Nat Resour Res. 2:122–139.
- Dahal RK, Hasegawa S, Nonomura A, Yamanaka M, Masuda T, Nishino K. 2008. GIS-based weights-of-evidence modelling of rainfall-induced landslides in small catchments for landslide susceptibility mapping. Environ Geol. 54(2):311–324.
- Devkota KC, Regmi AD, Pourghasemi HR, Yoshida K, Pradhan B, Ryu IC, Dhital MR, Althuwaynee OF. 2013. Landslide susceptibility mapping using certainty factor, index of entropy and logistic regression models in GIS and their comparison at Mugling–Narayanghat road section in Nepal Himalaya. Nat Hazards. 65(1):135–165.
- Ermini L, Catani F, Casagli N. 2005. Artificial neural networks applied to landslide susceptibility assessment. Geomorphology. 66(1-4):327–343.
- Gayen A, Saha S. 2017. Application of weights-of-evidence (WoE) and evidential belief function (EBF) models for the delineation of soil erosion vulnerable zones: a study on Pathro river basin, Jharkhand, India. Model Earth Syst Environ. 3(3):1123–1139.
- Heckeman 1986. Probabilistic interpretation of MYCIN’s certainty factors. In Kanal LN, Lemmer JF, editors. Uncertainty in artificial intelligence. New York: Elsevier; p. 298–311.
- Hussin HY, Zumpano V, Reichenbach P, Sterlacchini S, Micu M, Westen CV, Bălteanu D. 2016. Different landslide sampling strategies in a grid-based bi-variate statistical susceptibility model. Geomorphology. 253:508–523.
- Intarawichian N, Dasananda S. 2011. Frequency ratio model based landslide susceptibility mapping in lower Mae Chaem watershed, Northern Thailand. Environ Earth Sci. 64(8):2271–2285.
- Jaafari A, Najafi A, Pourghasemi HR, Rezaeian J, Sattarian A. 2014. GIS-based frequency ratio and index of entropy models for landslide susceptibility assessment in the Caspian forest, northern Iran. Int J Environ Sci Technol. 11(4):909–926.
- Kamp U, Owen LA, Growley BJ, Khattak GA. 2010. Back analysis of landslide susceptibility zonation mapping for the 2005 Kashmir earthquake: an assessment of the reliability of susceptibility zoning maps. Nat Hazards. 54(1):1–25.
- Kanungo DP, Sarkar S, Sharma S. 2011. Combining neural network with fuzzy, certainty factor and likelihood ratio concepts for spatial prediction of landslides. Nat Hazards. 59(3):1491–1512.
- Kayastha P, Dhital MR, De Smedt F. 2013. Evaluation and comparison of GIS based landslide susceptibility mapping procedures in Kulekhani watershed, Nepal. J Geol Soc India. 81(2):219.
- Kayastha P, Dhital MR, De Smedt F. 2012. Landslide susceptibility mapping using the weight of evidence method in the Tinau watershed, Nepal. Nat Hazards. 63(2):479–498.
- Kayastha P. 2015. Landslide susceptibility mapping and factor effect analysis using frequency ratio in a catchment scale: a case study from Garuwa sub-basin, East Nepal. Arab J Geosci. 8(10):8601–8613.
- Lee S, Pradhan B. 2007. Landslide hazard mapping at Selangor, Malaysia using frequency ratio and logistic regression models. Landslides. 4(1):33–41.
- Liu M, Chen X, Yang S. 2014. Collapse landslide and mudslides hazard zonation. In Landslide Science for a Safer Geoenvironment. Cham: Springer; p. 457–462.
- Luzi L, Pergalani F. 1999. Slope instability in static and dynamic conditions for urban planning: the ‘oltre po pavese’ case history (regione lombardia – italy). Natural Hazards. 20(1):57–82.
- McQuillan A, Canbulat I, Payne D, Oh J. 2018. New risk assessment methodology for coal mine excavated slopes. Int J Min. Sci Technol. 28(4):583–592.
- Mohammady M, Pourghasemi HR, Pradhan B. 2012. Landslide susceptibility mapping at Golestan Province, Iran: a comparison between frequency ratio, Dempster–Shafer, and weights-of-evidence models. J Asian Earth Sci. 61:221–236.
- Oh HJ, Pradhan B. 2011. Application of a neuro-fuzzy model to landslide-susceptibility mapping for shallow landslides in a tropical hilly area. Comput Geosci. 37:1264–1276.
- Pham BT, Bui DT, Prakash I, Dholakia MB. 2017. Hybrid integration of multilayer perceptron neural networks and machine learning ensembles for landslide susceptibility assessment at Himalayan area (India) using GIS. Catena. 149:52–63.
- Pourghasemi HR, Moradi HR, Aghda SF. 2013a. Landslide susceptibility mapping by binary logistic regression, analytical hierarchy process, and statistical index models and assessment of their performances. Nat Hazards. 69(1):749–779.
- Pourghasemi HR, Pradhan B, Gokceoglu C, Mohammadi M, Moradi HR. 2013b. Application of weights-of-evidence and certainty factor models and their comparison in landslide susceptibility mapping at Haraz watershed, Iran. Arab J Geosci. 6(7):2351–2365.
- Pradhan AMS, Kim YT. 2014. Relative effect method of landslide susceptibility zonation in weathered granite soil: a case study in Deokjeok-ri Creek, South Korea. Nat Hazards. 72(2):1189–1217.
- Pradhan B. 2013. A comparative study on the predictive ability of the decision tree, support vector machine and neuro-fuzzy models in landslide susceptibility mapping using GIS. Comput Geosci. 51:350–365.
- Qiao W, Li W, Li T, Chang J, Wang Q. 2017. Effects of coal mining on shallow water resources in semiarid regions: a case study in the Shennan mining area, Shaanxi, China. Mine Water Environ. 36(1):104–113.
- Rahmati O, Pourghasemi HR, Zeinivand H. 2016. Flood susceptibility mapping using frequency ratio and weights-of-evidence models in the golastan province, iran. Geocarto Int. 31(1):42–70.
- Razavizadeh S, Solaimani K, Massironi M, Kavian A. 2017. Mapping landslide susceptibility with frequency ratio, statistical index, and weights of evidence models: a case study in northern Iran. Environ Earth Sci. 76:499.
- Regmi NR, Giardino JR, Vitek JD. 2010. Modeling susceptibility to landslides using the weight of evidence approach: Western Colorado, USA. Geomorphology. 115(1-2):172–187.
- Saito H, Nakayama D, Matsuyama H. 2009. Comparison of landslide susceptibility based on a decision-tree model and actual landslide occurrence: the Akaishi Mountains, Japan. Geomorphology. 109(3-4):108–121.
- Sezer EA, Pradhan B, Gokceoglu C. 2011. Manifestation of an adaptive neuro-fuzzy model on landslide susceptibility mapping: Klang valley, Malaysia. Expert Syst Appl. 38(7):8208–8219.
- Shortliffe EH, Buchanan BG. 1975. A model of inexact reasoning in medicine. Math Biosci. 23(3-4):351–379.
- Solaimani K, Mousavi SZ, Kavian A. 2013. Landslide susceptibility mapping based on frequency ratio and logistic regression models. Arab J Geosci. 6(7):2557–2569.
- Sujatha ER, Kumaravel P, Rajamanickam GV. 2014. Assessing landslide susceptibility using Bayesian probability-based weight of evidence model. Bull Eng Geol Environ. 73(1):147–161.
- Sujatha ER, Rajamanickam GV, Kumaravel P. 2012. Landslide susceptibility analysis using Probabilistic Certainty Factor Approach: a case study on Tevankarai stream watershed, India. J Earth Syst Sci. 121(5):1337–1350.
- Sujatha ER, Sridhar V. 2017. Mapping debris flow susceptibility using analytical network process in Kodaikkanal Hills, Tamil Nadu (India. J Earth Syst Sci. 126:116.
- Sujatha ER. 2017. An empirical study to identify factors causing landslides using multiple linear regression model (MLR). Disaster Adv. 10:18–26.
- Tsangaratos P, Ilia I. 2016. Landslide susceptibility mapping using a modified decision tree classifier in the Xanthi perfection, Greece. Landslides. 13(2):305–320.
- Van Westen CJ. 1993. Application of geographic information systems to landslide hazard zonation. ITC, International institute for aerospace survey and earth sciences. Enschede, The Nethelands: ITC Publication.
- Van Westen CJ. 2000. The modelling of landslide hazards using GIS. Surv Geophys. 21(2/3):241–255.
- Wang LJ, Guo M, Sawada K, Lin J, Zhang J. 2016. A comparative study of landslide susceptibility maps using logistic regression, frequency ratio, decision tree, weights of evidence and artificial neural network. Geosci J. 20(1):117–136.
- Wang J, Chen C. 2017. Three dimensional back analysis for stability of slope dumped on weak basement. J China Univ Min Technol. 46:474–479.
- Wang P, Wang H, Xu S, Yu Y, Wang L. 2018b. Dynamic response of loess-wearthered rock contact surface slope. J China Univ Min Technol. 47:893–899.
- Wang Q, Li W. 2017. A GIS-based comparative evaluation of analytical hierarchy process and frequency ratio models for landslide susceptibility mapping. Phys Geogr. 38(4):318–337.
- Wang Q, Li W, Chen W, Bai H. 2015. GIS-based assessment of landslide susceptibility using certainty factor and index of entropy models for the Qianyang County of Baoji city, China. J Earth Syst Sci. 124(7):1399–1415.
- Wang Q, Li W, Li T, Li X, Liu S. 2018a. Goaf water storage and utilization in arid regions of northwest China: A case study of Shennan coal mine district. J Clean Prod. 202:33–44.
- Wang Q, Li W, Wu Y, Pei Y, Xing M, Yang D. 2016. A comparative study on the landslide susceptibility mapping using evidential belief function and weights of evidence models. J Earth Syst Sci. 125(3):645–662.
- Wang X, Zhang L, Wang S, Lari S. 2014. Regional landslide susceptibility zoning with considering the aggregation of landslide points and the weights of factors. Landslides. 11(3):399–409.
- Xie Y. 2013. Characteristic analysis and risk assessment of geological disaster in Wen County. Master's thesis, Lanzhou University.
- Xu C, Dai F, Xu X, Lee YH. 2012. GIS-based support vector machine modeling of earthquake-triggered landslide susceptibility in the Jianjiang River watershed, China. Geomorphology. 145:70–80.
- Xu W, Yu W, Jing S, Zhang G, Huang J. 2013. Debris flow susceptibility assessment by GIS and information value model in a large-scale region, Sichuan Province (China). Nat Hazards. 65(3):1379–1392.
- Yan C, Li W, Zhang Z, Shi Y. 2017. Impact analysis of creep movement of Zhengjiawan landslide to bridge across. J Eng Geol. 25:416–423.
- Yao X, Tham LG, Dai FC. 2008. Landslide susceptibility mapping based on support vector machine: a case study on natural slopes of Hong Kong, China. Geomorphology. 101(4):572–582.
- Yesilnacar E, Topal T. 2005. Landslide susceptibility mapping: a comparison of logistic regression and neural networks methods in a medium scale study, Hendek region (Turkey). Eng Geol. 79(3-4):251–266.
- Yilmaz I. 2009. Landslide susceptibility mapping using frequency ratio, logistic regression, artificial neural networks and their comparison: a case study from Kat landslides (Tokat—Turkey). Comput Geosci. 35:1125–1138.
- Yin KL, Yan TZ. 1988. Statistical prediction model for slope instability of metamorphosed rocks. In Proceedings of the 5th international symposium on landslides, Lausanne, Switzerland (Vol. 2, pp. 1269–1272).
- Zhang T, Cai Q, Han L, Shu J, Zhou W. 2017. 3D stability analysis method of concave slope based on the Bishop method. Int J Min Sci Technol. 27(2):365–370.