
Abstract
In this work, Multi Temporal Interferometry techniques (MTI) based on advanced synthetic aperture radar differential interferometry (A-DInSAR) have been investigated for the monitoring of deformation phenomena in slow kinematics. A-DInSAR methodologies include both Coherence-based type, as well as Small Baseline Subset (SBAS) that Permanent Scatterers (PS). These techniques are capable to provide wide-area coverage and precise, spatially dense information on ground surface deformations. MTI techniques have been applied to the town of Stigliano (MT) in Basilicata Region (Southern Italy), where the social center building has been destroyed after the reactivation of a known landslide. A direct comparison of the results has been shown that PS and SBAS techniques are comparable in terms of obtained coherent areas and displacement patterns, with slightly different velocity values for individual points. In particular, PS furnished a range of velocity between −5/−25 mm/year, while for SBAS we found values around −5/−15 mm/year. Furthermore, on the crown of the landslide body, a Robotics Total Station measuring distance values on 24 points has been installed. The displacement values obtained are in agreement with the results of the MTI analysis, showing as these techniques could be a useful in the case of early-warning situations.
Introduction
Surface deformations like landslide can be monitored with a variety of sensors (Calò et al. Citation2012). Current methods are, for instance, airborne and terrestrial laser scanning (ALS and TLS), (Lichun et al. Citation2008; Monserrat and Crosetto Citation2008; Mallet and Bretar Citation2009; Kasperski et al. Citation2010) prism measurements with robotic total stations (RTS) (Artese and Perrelli Citation2018), GNSS measurements (Bovenga et al. Citation2013), and ground or satellite-based differential interferometric synthetic aperture radar (DInSAR) (Tarchi et al. Citation2003; Cascini et al. Citation2009; Lowry et al. Citation2013). All these techniques are classified as ‘Remote Sensing’, which refers to the science aimed at collecting Earth Observations (EO) by using non-contact methods. Remote sensing for landslide investigation is widely documented in the recent literature, especially Advanced Synthetic Aperture Radar Differential Interferometry (A-DInSAR) (Bovenga et al. Citation2006; Farin et al. Citation2006; Cascini et al. Citation2010; Notti Citation2010; Bovenga et al. Citation2012; Righini et al. Citation2012; Herrera et al. Citation2013; Tofani et al. Citation2013). We refer to these methods as multi temporal interferometry (MTI). Many MTI application opportunities are emerging thanks to greater data availability from radar satellites and improved capabilities of the new space radar sensors (C-bandSentinel-1) in terms of resolution (from 20 to 5 m) and revisit time (about 12 days for C-band acquisitions). This implies greater quantity and quality information about ground surface displacements and hence improved monitoring capabilities of slow kinematic movements (Prati et al., Citation2010). MTI users can rely on the following strengths of the technique:
Large area coverage (thousands of km2) together with high spatial resolution (1–3 m) of the new generation radar sensors, and multi-scale investigation option (from regional to site-specific);
Very high precision (typically mm) of surface displacement measurements marginally influenced by bad weather;
Regular, high frequency (days–weeks) measurements over long periods (years);
Retrospective studies using long-period (20 years) archived radar imagery.
However, in order to evaluate the degree of success of MTI analysis for investigating slope instabilities, it is necessary to keep in mind some factors that can be the source of errors and/or wrong interpretations (Hanseen Citation2001). For example, many objects with reflective characteristics stable over time modify their electromagnetic response if observed from too different directions, namely the phenomenon of geometric decorrelation. This means that only pairs of SAR images with a baseline less than a few hundred meters can be effectively used for DInSAR measurements. The temporal decorrelation often represents the main limiting factor if we analyze densely vegetated areas. Atmospheric artefacts influence temporal correlation because they add to the total interferometric phase a contribution that is often difficult to estimate and remove (Zebker et al. Citation1997; Hanseen Citation2001). Furthermore, especially in mountain areas, the high spatial variability of the atmosphere can influence spatial correlation. Also, the morphology of the investigated area in relation to the satellite observational geometry (the presence of steep slopes and the same orientation of the slopes) causes the presence of distortion effects (foreshortening, layover, and shadow), which make the interferometric technique inapplicable for identification and monitoring of slope instabilities. Moreover, if we use images in ascending geometry we cannot study landslide phenomena on the west-oriented slopes and, vice versa, using descending images we cannot analyze landslide insisting on the slopes exposed towards the eastern quadrants (Colesanti and Wasowski Citation2006). Another limitation is posed by the projection of the real deformaton, along the line of sight (LOS), which connects the target to the ground with the sensor. This means that we measure only the satellite LOS projection of the displacement (Colesanti and Wasowski Citation2006).
We must not forget the enormous advantage offered by MTI techniques for the study of slope instabilities (Wasowski and Bovenga Citation2014), that is, the creation of an archive of movements. The latter provides important and essential information especially for areas where monitoring data are not available or when too large areas cannot be investigated by ground-based and airborne remote sensing systems. The temporal continuity represents a unique opportunity to develop very long deformation time series suitable to perform back-analysis of the investigated deformation phenomena. This approach provides valuable information for understanding the behaviour of slow deformation phenomena over long time interval, thus playing a key role in risk mitigation strategies and civil protection activities (Del Ventisette et al. Citation2015). Interferometric techniques are also very useful in cases where it is necessary to quickly map the territory after the occurrence of earthquakes or large natural disasters (heavy rainfall) that cause many landslide and widespread events in the area (Colesanti et al. Citation2003). In this framework MTI techniques, such as Persistent Scatters (PS) (Ferretti et al. Citation2000; Citation2001) and Small Baseline Subsets (SBAS) (Berardino et al. Citation2002; Lanari et al. Citation2004) approaches, can provide operational benefits and advantages to identify and monitor landslide areas.
In this work we calculate the InSAR deformation time series, based on Permanent Scatters (PS) and Small Baseline Subset (SBAS) algorithms, for the entire municipality of Stigliano, using Sentinel 1A and 1B data acquired through the ESA archive. We found that InSAR time series analysis agree well with RTS time series acquired locally in the investigated area, in terms of deformations rates. This work shows that A-DInSAR techniques can be applied to define risk mitigation strategies, especially when joint temporal/spatial deformation data set are available.
Geological setting of study area
The town of Stigliano (Basilicata, Italy), rests on the inner boundary of the Bradanic Foredeep, that is in the external strip of Lucanian Apennine. The geologic formations include the ‘Varicoloured Clays’ of Cretaceus-Eocene age, the ‘Stigliano Formation’ (or Numidian Flysch), the ‘Serra Cortina Marls’ and the ‘Serra Palazzo Formation’, all of Aquitanian-Helvetian age, the Calcarenites and Subapenninic Marly-blu Clays of the Plio-Pleistocene age. A briefly sketch of geological map is reported in .
Figure 1 Geological Sketch of Stigliano. Figure modified from Guerricchio and Melidoro Citation1988 and Bentivenga et al. Citation2005.
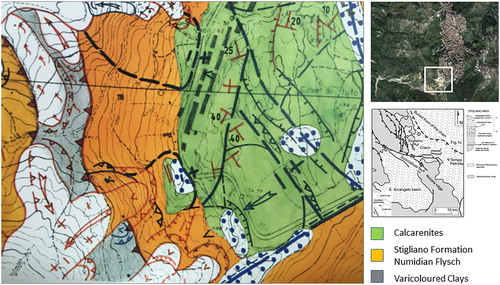
A part of the town corresponding to the north of the present historical centre was destroyed by large ancient landslide. The oldest Chiesa-Villa quarter rests on a calcarenitic plate, which overlies transgressively the Serra palazzo and the Stigliano Formation, and is undergoing further disintegration. After the year 1907, this quarter was supposed to be transferred; but it was never done.
The main landslide types include ‘lateral spreadings’ of the stony masses resting on argillitic soils, such as those of the varicoloured scaly clays or the Serra palazzo sequences, particularly those rich in clay levels. Such movements, conditioned by the stratigraphic sequences, influenced by the basement, produce in these last a short of ‘expulsion’ phenomena and buildings due to pressure. Other types of landslides are slumps and slips that pass to very long and wide multiple flows. These 50–60 m thick bodies fill the valley at the foot of the Stigliano hill stopping for a certain period the remounting erosion phenomena and buildings due to pressure (Guerricchio and Melidoro Citation1988).
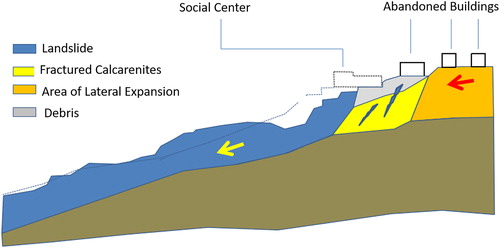
The actual landslide phenomena, starting on 2014, develops, along the southern slope, a complex type of slide (roto-translational) with very deep failure surface (>40 m) in the high part of the slope, and earth-flows that involve the middle-low portion of the slopes for about 1.2 km length. The crown area can be detected in the contact between clayey units and calcarenite, although a retrogressive activity is now involving also area where the calcarenite outcrops. Most of the accumulation area produced by rotational component constitute the alimentation zone of slow earth-flows that can affect from the top to the valley. The roto-translational movement along the slope determined in the upper part of the slide, a lateral spreading of the calcarenitic plaque on which was built the news part of the Stigliano town. This complex landslide, whose activity has been progressively increased in time, caused severe damage to the building and infrastructures. A first model of the landslide of Stigliano is reported in .
Figure 2 Preliminary model of Stigliano landslide.
Methodology of investigation
Methodologies have been chosen taking into account two main aspects: firstly, the necessity to obtain information on geometric characterization of the area involved on landslide phenomenon; secondly, the capacity for monitoring building and infrastructures in the crater area. With this in mind, we used both PS-InSAR and SBAS techniques that represent a specific class of DinSAR techniques. Such techniques exploit the information contained in the radar phase of at least two complex SAR images acquired in different time over the same area, which are used to form an interferometric pair. For a general review of SAR interferometry and PSI techniques, see Bamler and Hartl (Citation1998), Rosen et al. (Citation2000), and Crossetto et al. (Citation2016).
As ‘ground truth’, detailed information coming from a RTS installed near the landslide body has been used.
PSInSAR technique
PSInSAR technique has been developed and patented at the Polytechnic of Milan in 2000 (Ferretti et al. Citation2000, Citation2001). It is an extremely effective tool for the millimetre accuracy monitoring of earth surface deformation phenomena, based on the use of time series of satellite radar images. This approach is based on the observation that a small subset of radar targets, consisting precisely of permanent scatterers (PS), is practically immune to the effects of decorrelation. They maintain the same ‘electromagnetic signature’ in all images as the acquisition geometry and climatic conditions vary, thus preserving phase information. PS are typically parts of buildings, metal structures, exposed rocks, or more generally ground targets for which the electromagnetic characteristics do not vary significantly from acquisition to acquisition. Conversely, this condition does not apply for time-changing scenarios, such as the vegetation, which exhibit continuous backscattering variations over time. The elaboration originates from a statistical analysis of the images, which leads to the selection of PS, substantially immune to decorrelation phenomena. This property allows to overcome most of the limitations related to conventional DInSAR analysis (Crossetto et al. Citation2016). Using the historical series of acquisitions, it is possible to estimate both the atmospheric phase screen (APS) contribution and the possible superficial deformations of the test area. After removing the APS from the data, it is possible to accurately estimate the movements of the permanent diffusers. A fundamental aspect is the ability to estimate and compensate the APS, carrying out a detailed statistical analysis of ground deformation phenomena for the selected subset of PS. To perform accurate estimates of APS it is necessary that the spatial density of PS is sufficiently high (greater than 5–10 points/km2). In areas with high urbanization, the spatial density reaches very high values: 100–400 points/km2. The PS are correctly positioned in the resolution cell on the ground and for each of them a deformation measurement is provided along the whole acquisition time series, with accuracy up to 1–2 mm. Therefore, the average rate or velocity of annual deformation can be reconstructed, with accuracy between 0.1 and 1 mm/year. The latter depends on the number of images and the ‘quality’ of the PS itself, that is, how much the phase information is immune to disturbing phenomena.
SBAS technique
SBAS differential approach allows to produce deformation time sequences through the use of small spatial and temporal baseline interferograms (Berardino et al. Citation2002; Lanari et al. Citation2004). Compared to the PS technique, SBAS is less sensitive to the number of input images, since it seeks spatially distributed rather than pointwise coherence. Obviously, the greater the number of input images, the better the results will be, thanks to the ability to estimate and remove the atmospheric contribution. Leakage errors (such as the presence of phase jumps) can be corrected thanks to the passage of ‘Phase Editing’ implemented in the SBAS processing chain (Berardino et al. Citation2002; Lanari et al. Citation2004). In detail, if we assume that adjacent pixels have similar behaviour, such phase jumps should not be present. In fact, the step of Phase Editing allows to remove, from the DInSAR stack, those interferograms that present precisely phase jumps or areas without data (because for example there are too many vegetated areas with low temporal consistency). As a general rule, not only for landslide monitoring, the deformation rates in LOS should be <4 cm/year (for ESA sensors) to ensure a very low probability of error (Crossetto et al. Citation2016). Even the lack of acquisitions for long time periods or the small number of available observations can induce phase ambiguity in the study of the phenomenon to be monitored. Advantages offered by the SBAS regard the high coherence and spatial density (intrinsic characteristics of the interferograms with little baseline) as well as error reduction due to information redundancy (more interferograms for each image) (Berardino et al. Citation2002; Lanari et al. Citation2004). The disadvantages are represented by the solving of a linear overdeterminated problem, and the wide large computational capacities required (Crossetto et al. Citation2016).
RTS technique
Modern RTS can automatically find and track prism targets. RTS are commonly used for the monitoring during tunnel construction and to assess the stability of water dams, landslides, and rock faces (Artese and Perrelli Citation2018). The instruments are often placed in a measurement chamber and thus protected from adverse environmental conditions. The accuracy of total stations always depends on three components: setup point, measurement path, and measurement target. The setup point includes the instrument itself, the stability of the support, and the objects in the vicinity of the instrument. The measurement path is influenced by the atmospheric conditions, which have an impact on the travel speed of the signal. Furthermore, temperature gradients can cause a curvature of the measurement path. The final critical component is the target. The achievable accuracy depends on the target type, for example, prism or rock, the inclination angle of the measurement path with respect to the target and the target material.
Results
Interferometric analysis
The first Interferometric Analysis on the Stigliano Municipality was conducted starting from two Sentinel-1A images acquired along a descending orbit on 13 March 2016 (Master) and 25 March 2016 (Slave). These dates were chosen because on 24 March 2016 the partial collapse of the social center building occurred as a result of landslides. shows the interferometric map, where false-colour bands refer to the interferometric fringes observed in the test area. They give evidence that a noticeable ground surface movements occurred between the two SAR acquisitions. A fringe corresponds to a phase variation of 2π radians, which results in a displacement equal to the half value of the radar wavelength; in our case, each fringe corresponds to a displacement of 28 mm (data in C band). The interferogram has good coherence on more than half of the processed scene: in detail, in the coherent part we notice interferometric fringes that denote the presence of ground displacement phenomena. In the remaining part of the interferogram a clearly effect of speckle is visible.
Figure 3 Maps of (a) phase shift (interferogram), (b) coherence, (c) displacements, of Stigliano area.
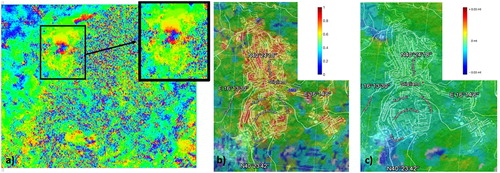
This speckle noise effect has been greatly reduced thanks to the multilooking phases and to the various filtering carried out during image processing. Multi-look processing in InSAR processing is used as an efficient algorithm to reduce phase noise in an interferometric image slice it is the optimal estimator in a maximum likelihood sense for an interferometric image (Goldstein et al. Citation1988). In our processing chain, after the single-look interferometric image is formed, an adaptive filter is used in the interferometric image. The filter is based on the algorithm of Goldstein et al. (Citation1988). This adaptive filter significantly improves fringe visibility and reduces phase noise introduced by scene dependent or system related decorrelation. The variable bandpass characteristic of filter smooths the phase in region with high correlation, but remain broad band in region of low correlation. The filtered interferometric image can form the final interferogram.
In summary, this Interferometric SAR analysis has led us to the conclusion that all three maps (Interferogram, Coherence and Displacements) () highlight precise changes on the municipality of Stigliano and in particular in the area of the landslide that led to the collapse of the social center building. These results confirm that the InSar analysis is a valuable tool to detect and highlight ‘fast’ movements.
A-DInSAR analysis
For the A-DInSAR analysis the multi-temporal series (Stack) of satellite images consists of 24 acquisitions spanning from 24 October 2014 to 16 August 2016 (), in S1A_IW_SLC__1SDV format. The technical details of the images are reported in .
Table 1. Stack of satellite images.
Table 2. Technical details of the images.
The series of displacements deriving from the PS and SBAS processing made it possible to define the return times of landslides that have affected the Municipality of Stigliano over time.
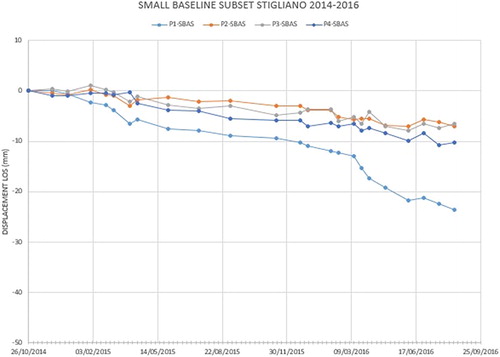
Ground displacement velocity map and time series are measured along the LOS of satellite. The results refer to SAR acquisitions available only along a downward orbit. The scatterers provided by the PS analysis (), identify the unstable areas affecting the entire municipality, which we identify and report with 4 points, characterized by deformation velocities between 5 and 25 mm/year (). The SBAS results () exhibit less oscillation of the displacement values with respect to those provided by the PSInSAR technique and therefore allow the identification of stasis and acceleration periods for the landslide movement (). Indeed, the landslide movement that led to the collapse of the social center is almost parallel to the SAR LOS direction and therefore almost all the real movement is measured by the interferometric analysis.
Figure 4 Deformation velocities at PS points in Stigliano area identified by PS-InSAR from Sentinel satellite data. Base map courtesy of Google Inc.
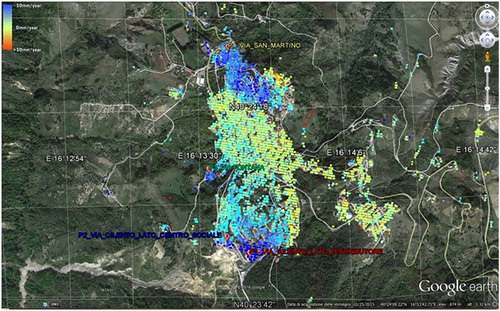
Figure 5 Cumulated displacement of 4PS points of Stigliano area.
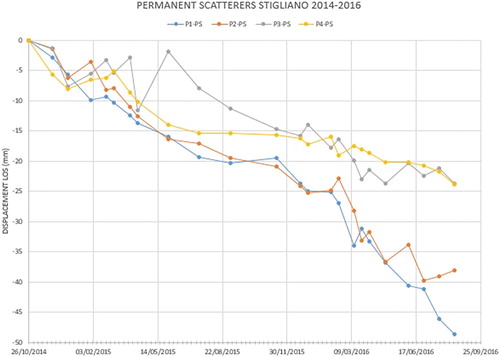
Figure 6 Deformation velocities map of Stigliano area obtained by applying SBAS technique from Sentinel satellite data. Base map courtesy of Google Inc.
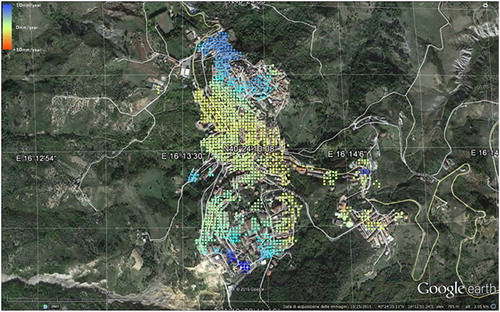
Figure 7 Cumulated displacement of 4 SBAS points of Stigliano area.
This emphasizes that the success of the A-DInSAR analysis depends on many factors including the relationship between movement, angle of view of the satellite and LOS direction.
Discussion of the result
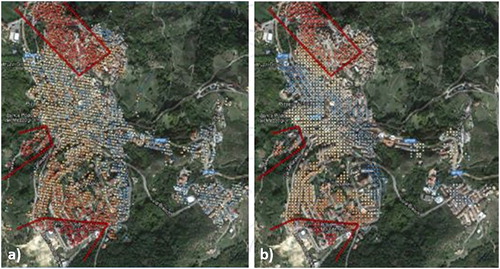
The critical issues of the case study have allowed to evaluate any limits in the application of these data and techniques, identifying particular expedients to obtain as much information as possible. The SAR images of the SENTINEL-1 satellites were processed using the InSar procedure for the pre-post event evaluation and through the A-DInSAR procedure, specifically PSInSAR and SBAS techniques for the evaluation and time-series analysis of slow ground movements. All three techniques have been applied to a real case study, that is, the landslides that have involved the Municipality of Stigliano (MT) in Basilicata over the years. The results obtained show how the characteristics of the new generation sensors (high spatial resolution and short revisiting times) allow the use of A-DInSAR techniques in the analysis and monitoring of slow deformation phenomena. Moreover, the reduced revisiting times allow, in theory, to monitor deformation phenomena not only for long periods (several years) but also for short periods (a few months), which is completely closed to older generation sensors. The interferogram deriving from the InSAR analysis has highlighted the fast movement derived from the collapse of social center building on 24 March 2016. Through the PSInSAR and SBAS techniques it was possible to obtain a monitoring network of about 7057 and 1124 points, respectively. They allowed to highlight three areas in the Stigliano area subject to ‘displacement’ phenomena (). The latter coincide with the three areas that rise above three distinct calcarenitic plaques and that previously had been affected by geological instability (Guerricchio and Melidoro Citation1988).
Figure 8 Comparison of area subject to ‘displacement’ phenomena highlighted through (a) PS technique and (b) SBAS technique. Red polygons delimite area with fast movements.
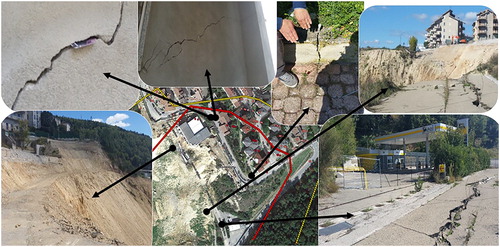
The scatterers identified by the PS analysis show a deformation velocity between 5 and 25 mm/year, with a cumulative deformation from October 2014 to August 2016 of about 50 mm. Regarding the cumulative displacements obtained from the SBAS analysis, they showed values up to 30 mm/year not directly comparable to those obtained by PSInSAR technique, since the point grids are different. The focus of this study was mainly addressed to the southern area of the country, which affected the collapse of the social center building. To properly assess and validate A-DInSAR investigations, an inspection analysis was carried out on 05 October 2016, in collaboration with some INGV researchers, the technicians of the Municipality of Stigliano, and the technicians of the Basilicata Region. The comparative analysis between A-DInSAR results and in situ measurement campaigns allowed to confirm the various injuries and building damages occurred in the surrounding of the landslide, where A-DInSAR analysis provided the greatest displacements ().
Figure 9 Damage to critical infrastructures and buildings in Stigliano area.
RTS
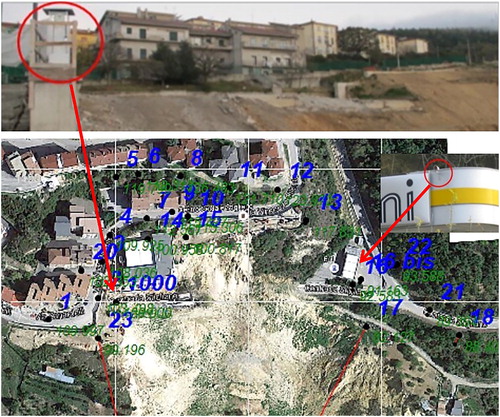
RTS is a fundamental instrument for landslide monitoring. Accurate angle and range measurement are useful when describing the surface of the ground, measuring the displacements of selected points and evaluating morphological evolutions. Monitoring has been performed by means of an automatic total station (Leica TM50) measuring about 24 prisms located to a maximum distance of 300 m, and with a measurement rate of 20 minutes. The accuracy of instrument is 0.6 mm (in precise acquisition mode). The RTS system was powered and equipped with data transfer via GSM, and the instrument was posed in a special case (box). The glass of the box would provoke a distortion in the measure that is lower than the measurement accuracy, therefore it can be ignored. The RTS has been located in a relatively stable geological area. Since November 2016, the system was automated in order to allow continuous data acquisition and near-real time data processing. The accuracy of RTS (of about 0.6 mm thanks also to reduced distance between station and prisms) has contributed to early detect the trigger of a landslide and to activate warning procedures. In is reported the measurement network, showing the 24 topographic reflectors (each point is identified with a number) and the position of RTS (identified with a label ‘1000’). The measuring points have been chosen to monitor, not only the landslide movement, but also facilities and infrastructures still used by citizens. In the time, some reflectors have been lost definitively and some replaced and renamed.
Figure 10 Measurement network of RTS, with a detail of main instrument and of the reflector.
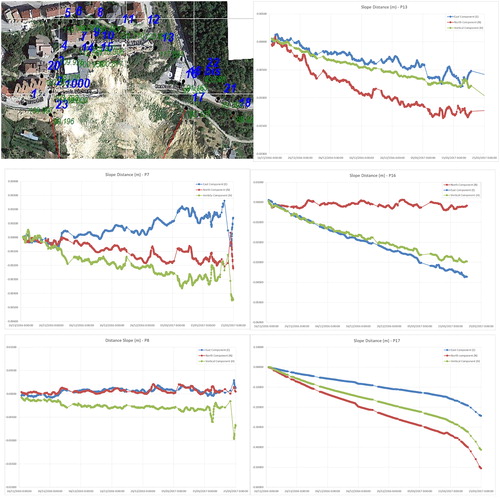
First measurements acquired on 16 November 2016, highlighted the areas characterized by different movements. In particular, the western area exhibits a greater stability with negligible displacements on both dwellings and infrastructures. In the North area of monitoring network, the recorded measurements showed significant movements on both buildings and infrastructures. The most significant displacements are concentrated mainly on the East area of the network. In is reported an example of the time series of the displacement recorded from RTS in correspondence of topographic reflector N° 7, 8, 13, 16 e 17 from November 2016 to January 2017. The maximum values of displacement, in terms of planimetric (East and North Component) and vertical displacement, recorded in these points are reported in Figure 12.
Figure 11 Time series recorded from RTS in different points of the network. The colors are associated to the three components measured by RTS.
By means of RTS we have obtained a monitoring network at high resolution, in space and time, for the buildings and infrastructures in the landslide area. Thanks to the availability of this monitoring data, an early warning system has been established, and different alarm thresholds have been defined.
Conclusions
In this work we have shown MTI approach is particularly suitable for the above task. MTI is also cost effective and can deliver large quantities of useful information for managers involved in infrastructure instability hazards mitigation. Specifically, where vegetation cover is limited, satellite MTI offers great surveying capability of terrain and engineering structure instabilities. Some differences in result obtained by PSInSAR and SBAS techniques have been observed. In particular, PS provided a range of velocity between 5/25 mm/year, while for SBAS we found values around 5/15 mm/year. These differences can be probably ascribed to the scattering characteristics of the ground surface. This could be occurring because PS is optimized for resolution cells dominated by a single scatterer, while SBAS focuses on distributed scatterers (without any dominant element within the resolution cell). Moreover, the latter are more sensible to both temporal and volume decorrelations than the firstly (Crossetto et al. Citation2016).
The displacement values obtained by RTS are in agreement with the results of the MTI analysis, showing as these techniques could be a useful tool in the case of early-warning situations. After this work, on 16 January 2017, thanks to the results highlighted by means of MTI and to the presence of RTS, 6 eviction orders were issued for all the building at north of investigated area. To improve the monitoring of the area, a GPS network will be installed (almost two instruments), and a GPS master will be posed on RTS box to control the stability of station pilaster.
Acknowledgements
We are grateful to ESA for Copernicus Sentinel data 2014-2016. We are grateful to two anonymous reviewers for constructive and helpful comments that greatly improved the manuscript.
Related Research Data
References
- Artese S, Perrelli M. 2018. Monitoring a landslide with high accuracy by total station: a DTM-based model to correct for the atmospheric effects. Geosciences. 8(2):46. doi: 10.3390/geosciences8020046.
- Bamler R, Hartl P. 1998. Synthetic aperture radar interferometry. Inverse Probl. 14(4):R1–R54.
- Bentivenga M, Foresi LM, Prestera A, Prosser G, Sabia M. 2005. Structural setting at the front of a thrust and fold belt: The Craco area (Southern Apennines, Italy). B Soc Geol Ital. 124:367–376.
- Berardino P, Fornaro G, Lanari R, Sansosti E. 2002. A new algorithm for surface deformation monitoring based on small baseline differential SAR interferograms. IEEE Trans Geosci Remote Sens. 40(11):2375–2383.
- Bovenga F, Nutricato R, Refice A, Wasowski J. 2006. Application of multi-temporal differential interferometry to slope instability detection in urban/peri-urban areas. Eng Geol. 88(3-4):218–239.
- Bovenga F, Wasowski J, Nitti DO, Nutricato R, Chiaradia MT. 2012. Using Cosmo/SkyMed X-band and ENVISAT C-band SAR interferometry for landslide analysis. Remote Sens Environ. 119272–285.
- Bovenga F, Nitti DO, Fornaro G, Radicioni F, Stoppini A, Brigante R. 2013. Using C/X-band SAR interferometry and GNSS measurements for the Assisi landslide analysis. Int J Remote Sens. 34(11):4083–4104.
- Calò F, Calcaterra D, Iodice A, Parise M, Ramondini M. 2012. Assessing the activity of a large landslide in southern Italy by ground-monitoring and SAR interferometric techniques. Int J Remote Sens. 33(11):3512–3530.
- Cascini L, Fornaro G, Peduto D. 2009. Analysis at medium scale of low- resolution DInSAR data in slow-moving landslide-affected areas. ISPRS J Photogramm Remote Sens. 64(6):598–611.
- Cascini L, Fornaro G, Peduto D. 2010. Advanced low- and full-resolution DInSAR map generation for slow-moving landslide analysis at different scales. Eng Geol. 112(1-4):29–42.
- Colesanti C, Ferretti A, Prati C, Rocca F. 2003. Monitoring landslides and tectonic motion with permanent scatterrers technique. Eng Geol. 68(1-2):3–14.
- Colesanti C, Wasowski J. 2006. Investigated landslide with space-borne Synthetic Aperture Radar (SAR) interferometry. Eng Geol. 88(3-4):173–199.
- Crossetto M, Monserrat O, Cuevas-Gonzalez M, Devanthery N, Crippa B. 2016. Persistent Scatterer Interferometry: a review. ISPRS J Photogramm Remote Sens. 115:78–89.
- Del Ventisette C, Gigli C, Tofani G, G.,Casagli N. 2015. Radar technologies for landslide detection, monitoring, early warning and emergency management. In Book modern technologies for landslide monitoring and prediction. Berlin: Springer; p. 209–232.
- Farin A. P, Colombo D, Fumagalli A, Marks F, Moretti S. 2006. Permanent Scatterers for landslide investigations: outcomes from the ESA-SLAM project. Eng Geol. 88(3):200–217.
- Ferretti A, Prati C, Rocca F. 2000. Nonlinear subsidence rate estimation using permanent scatterers in differential SAR interferometry. IEEE Trans Geosci Remote Sensing. 38(5):2202–2212.
- Ferretti A, Prati C, Rocca F. 2001. Permanent scatterers in SAR interferometry. IEEE Trans Geosci Remote Sens. 39(1):8–20.
- Goldstein RM, Zebker HA, Werner CL. 1988. Satellite radar interferometric:two-dimensional phase unwrapping. Radio Sci. 23(N4):713–720.
- Guerricchio A, Melidoro G. 1988. Fenomeni Franosi dell’ abitato di Stigliano (Basilicata), C.N.R. Convegno sul tema Cartografia e monitoraggio dei movimenti franosi.
- Hanseen R. 2001. RADAR Interferometry. Data Interpretation and Error Analysis. New York. Kluwer Academic Publishers; p. 327.
- Herrera G, Gutierrez F, Garcia-Davalillo JC, Guerrero J, Notti D, Galve JP, Fernandez-Merodo J, Cooksley G. 2013. Multi-sensor advanced DInSAR monitoring of very slow landslides: The Tena Valley case study (Central Spanish Pyrenees). Remote Sens Environ. 128:31–43.
- Kasperski J, Delacourt C, Allemand P, Potherat P, Jaud M, Varrel E. 2010. Application of a terrestrial laser scanner (TLS) to the study of the Séchilienne landslide (Isère, France). Remote Sens. 2(12):2785–2802. doi: 10.3390/rs122785.
- Lanari R, Mora O, Manunta M, Mallorqui JJ, Berardino P, Sansosti E. 2004. A small baseline approach for investigating deformations on full-resolution differential SAR interferograms. IEEE Trans Geosci Remote Sens. 42(7):1377–1386.
- Lowry B, Gomez F, Zhou W, Mooney MA, Held B, Grasmick J. 2013. High resolution displacement monitoring of a slow velocity landslide using ground based radar interferometry. Eng Geol. 166160–169.
- Lichun S, Wang X, Zhao D, Qu J. 2008. Application of 3D laser scanner for monitoring of landslide hazards. Int Arch Photogramm Remote Sens. 37(B1):277–281.
- Mallet C, Bretar F. 2009. Full-waveform topographic Lidar: state-of-the-art. ISPRS J Photogramm Remote Sens. 64(1):1–16. doi: 10.1016/j.isprsjprs.2008.09.007.
- Monserrat O, Crosetto M. 2008. Deformation measurement using terrestrial laser scanning data and least squares 3D surface matching. ISPRS J Photogramm Remote Sens. 63(1):142–154.
- Notti D. 2010. Landslides mapping and analysis by means of Persistent Scatterers SAR data: approaches at different scales. Sci Acta. 4(1):3–8.
- Prati C, Ferretti A, Perissin D. 2010. Recent advances on surface ground deformation measurement by means of repeated space-borne SAR observations. J Geodyn. 49(3-4):161–170.
- Righini G, Pancioli V, Casagli N. 2012. Updating landslide inventory maps usingPersistent Scatterer Interferometry (PSI). Int J Remote Sens. 33(7):2068–2096.
- Rosen PA, Hensley S, Joughin IR, Li FK, Madsen SN, Rodriguez E, Goldstein RM. 2000. Syntetic aperture radar interferometry. Proc IEEE. 88(3):333–382.
- Tarchi D, Casagli N, Fanti R, Leva DD, Luzi G, Pasuto A, Pieraccini M, Silvano S. 2003. Landslide monitoring by using ground-based SAR interferometry; an example of application to the Tessina landslide in Italy. Eng Geol. 68(1-2):15–30.
- Tofani V, Raspini F, Catani F, Casagli N. 2013. Persistent Scatterer Interferometry (PSI) technique for landslide characterization and monitoring. Remote Sens. 5(3):1045–1065.
- Wasowski J, Bovenga F. 2014. Investigating landslides and unstable slopes with satellite Multi Temporal Interferometry: current issues and future perspectives. Eng Geol. 174:103–138.
- Zebker HA, Rosen PA, Hensley S. 1997. Atmospheric effects in interferometric synthetic aperture radar surface deformation and topographic maps. J Geophys Res. 102:7547–7563. doi: 10.1029/96JB03804.