
Abstract
Natural disasters causing human, economic, or environmental losses include all types of geophysical, meteorological, hydrological, climatological, or biological events that disturb human and natural environments. Emergency preparedness for, response to, mitigation of, and recovery from natural disasters that are bases for sustainable development requires sound impact assessments at proper spatial and temporal scales. This research provides spatial–temporal views of world natural disasters recorded in the EM-DAT database for the period of 1900-2015. Views of natural disaster impacts in terms of human fatalities, injuries, affected, and property damages are summarized and ranked at the world, continent, and country levels and by decade and the whole period. Top 10, 20, and 30 out of 221 countries are highlighted and referenced with the world totals. Correlates of country disaster impacts with social-economic attributes are explored. While countries with significant disaster impacts are found in all continents, large developing countries (e.g. China, India) or developed countries (e.g. United States, Germany) lead the global natural disaster hotspots, which are small in numbers but large in total disaster losses. Such global inter-country views of natural disaster impacts provide useful insights for sustainability policy-making relevant to international and national humanitarian efforts towards natural disasters.
Introduction
In recent decades, we have seen a wide range of natural (e.g. floods and hurricanes) and technological disasters (e.g. hazardous material releases) across the countries. In particular, every year natural hazards have negative impacts on millions of people all over the world. Some natural hazards, which include a wide range of geophysical, meteorological, hydrological, climatological, or biological events that disturb human and natural environments, turn into disasters, causing physical impacts, such as injuries, casualties, property damages, and/or non-physical impacts, such as psychological, mental, and political wounds (Lindell Citation2013). More specifically, research has shown that human injuries, causalities, and economic losses due to natural disasters have been increasing over the past six decades (O’Keefe et al. Citation1976; Berke Citation1995; Mileti Citation1999; Dewan Citation2013). Therefore, a good understanding of natural hazard impacts at various spatial and temporal scales is essential for effective and efficient emergency/disaster management; preparedness, response, mitigation, and recovery for sustainable and resilient development (Shen et al. Citation2018).
This research examines country-level impacts caused by world natural disasters recorded in the international Emergency Events Database (EM-DAT) for the period of 1900–2015. EM-DAT, compiled by the Centre for Research on the Epidemiology of Disaster (CRED), documents all the natural disasters as a group, which contains five subgroups – geophysical, meteorological, hydrological, climatological, and biological – each of which further contains one or more types of specific natural disasters (CRED Citation2015). As defined in CRED (Citation2015), those five natural disasters and their physical impacts or risks – Fatality, Injured, Affected, and Damage are described in .
Table 1. Definition and classification of natural hazards and impacts of natural disasters.
The EM-DAT database contains information from various sources, including UN agencies, national governments, the International Federation of Red Cross, and Red Crescent Societies. A natural disaster is recorded into EM-DAT if at least one of the following criteria is fulfilled: 10 or more people dead; 100 or more people affected; the declaration of a state of emergency, and a call for international assistance (CRED Citation2015).
The database also shows an upward trend not only in natural disaster occurrences but also in disaster impacts (e.g., causalities, property damages). For example, from 1950 to 1979, 1,779 natural disasters occurred, causing 4,860,449 casualties, 1,372,606 injuries, and $78 billion in property damages. However, from 1980 to 2015 the reported number of natural disasters increased to 11,494 or about 6.5 times as many as that in the period of 1950–1979, causing 2,599,237 fatalities, 6,354,195 injuries and $2.71 trillion in property damages (CRED Citation2015).
This research is based upon EM-DAT’s country specific natural disasters classifiers for the period of 1900–2015, including disaster occurrence, group, subgroup, type, year, and country and disaster impacts, including human fatalities, injuries, people affected, and damages. Disaster impacts are summarized through snapshots at spatial scales of world, continent, and country and temporal scales of decade and the total period. In addition, representative percentages, rankings, and correlations are computed and plotted to better reveal the global hotspots of natural disasters.
Specifically, human fatalities, injuries, affected, and property damages were accumulated and ranked at the world, continent, and country levels. Top 10, 20, and 30 out of 221 countries were highlighted and referenced by time (e.g. decade) and type (e.g. climatological). Additionally, this study explored whether country disaster impacts are correlated with social-economic attributes such as population, area, and gross domestic product (GDP). These global spatial and temporal views of natural disaster impacts will provide useful insights for national and international sustainability and resiliency policies.
This article is organized into six sections. Following the introduction in Section one, Section two concisely reviews the relevant literature. Section three introduces databases and methods. Section four shows the results. Section five provides conclusions and remarks.
Literature review
A hazard is regarded as an extreme and severe event that poses a potential risk to human beings and their settlements (Deyle et al. Citation1998; Cutter et al. Citation2006). According to CRED (Citation2009a, Citation2009b), as shown in , natural hazards are classified into subgroups as (1) Geophysical hazards, originating from solid earth, take the forms of earthquakes, tsunamis, mass movement, and volcanic eruptions; (2) Meteorological hazards, due to short-lived micro- to meso-scale extreme weather and atmospheric conditions, occur as extreme temperature, storm, and fog; (3) Hydrological hazards, caused by the occurrence, movement, and distribution of surface and sub-surface fresh-water and salt-water, appear as flood, landslide, or wave action; (4) Climatological hazards, affected by long-lived, meso- to macro-scale atmospheric processes ranging from intra-seasonal to multi-decadal climate variability, show as drought, glacial lake outbursts, and wildfires; and (5) Biological hazards, due to the exposure to living organisms and their toxic substances or vector-borne diseases, appear as epidemic, insect infestation, or animal accident.
CRED (Citation2015) also defines disaster impacts as (1) Fatality – number of people who lost their life because of natural hazards; (2) Injured – people suffering from physical injuries, trauma or an illness requiring medical treatment as direct consequence of a disaster; (3) Affected – sum of homeless (people whose house is destroyed or heavily damaged and therefore need shelter) and affected (people requiring immediate assistance during a disaster); and (4) Damage – the amount of damage to property, crops, and livestock. These impacts are serious threats to sustainable development.
Various methods to study natural disaster impacts exist in the literature (Cutter et al. Citation2006), including risk/hazards approach (White and Hass Citation1975); political ecology approach (O’Keefe et al. Citation1976); pressure and release approach (Blaikie et al. Citation1994; Wisner et al. Citation2004); hazard-of-place approach (Cutter Citation1996); and vulnerability/sustainability approach (Turner et al. Citation2003). These models have been applied to studies to enhance our understanding of impacts of various natural hazards. For example, Mustafa (Citation1998) used the pressure and release model to investigate flood impacts, so did Gaillard et al. (Citation2007) to analyse the impacts of typhoons. Additionally, the hazards-of-place approach suggested by Cutter (Citation1996) was applied to various hazard studies (e.g. Cutter et al. Citation2000; Wu et al. Citation2002). The vulnerability/sustainability approach was applied for quantitative and vulnerability analysis (e.g. Tyler et al. Citation2007). Also, a spatial impact model for tornadoes was developed by Shen and Hwang (Citation2015), a spatial–temporal method for assessing multi-hazard damages by Orencio and Fujii (Citation2014), and a mapping approach for risk analysis by Beck and Kropp (Citation2011). Moreover, extensive quantitative impact assessment models were reviewed by Cox (Citation2001), Greenberg and Cox (Citation2014), and Aven and Cox (Citation2015).
It should be noted that most of the previous impact studies focus on single subgroup or type of disasters within a local area. Some are on multiple disasters for a country or a region. Such a study often starts with the area’s historical hazards, disasters, and impacts and involves risk determination, which is to identify the types of hazards and measure their historical or potential disaster impacts at various spatial and temporal levels (Murphy and Gardoni Citation2006; Greenberg et al. Citation2012). Global natural disaster impact studies are relatively few, but can be found in Dilley et al. (Citation2005) and Cvetković and Dragicević (Citation2014) on global natural disaster risk assessments, Peduzzi et al. (Citation2009) for global risk indexes, Giuliani and Peduzzi (Citation2011) on natural hazard geoportals, Peduzzi et al. (Citation2005), Kron et al. (Citation2012), Wirtz et al. (Citation2014), Shi and Karsperson Citation2015, and Shi et al. (Citation2016) for mapping and management of various global hazard datasets, and Shen and Hwang (Citation2016) for country-level expected risks of technological disasters using the well-known EM-DAT data set. In addition, studies at the global level conducted in the most recent years are found in Shen and Hwang (Citation2018) who proposed a risk analysis model of global technological disasters; Shen et al. (Citation2018) created a risk analysis model of world natural disasters; Lesk et al. (Citation2016) who explored how extreme weather events influence global crop production; Winsemius et al. (Citation2016) who analysed how global future river flood risk can be calculated into climate change impacts; Carrivick and Tweed (Citation2016) who examined the effects of the human systems (such as population pressure and land use) on the glacier outburst flood; Kirschbaum et al. (Citation2015) who evaluated a global landslide catalogue created based on a variety of sources including media report and online database to reveal spatial and temporal trends in landslide on a global level; Dottori et al. (2018) who investigated the impacts of anthropogenic warming on human and economic losses from river flooding at the regional levels such as the Asian continent; and Bolin and Kurtz (Citation2018) who studied how human factors such as race, class, and ethnicity are related to disaster vulnerability.
Our literature review shows that, even though various types of natural disasters have been explored, most of the existing studies focused only on one country, several countries, or world regions of Asia, America, or Europe. Moreover, in spite of these well-done studies, impact analyses of natural disasters at various spatial-temporal scales at the international level, including almost all the countries of the world, are few and far between. This research aims to fill this gap by examining global natural disaster impacts in terms of fatalities, injuries, people affected, and damages at the country level, which is ranked globally and by continent to highlight hotspot countries or regions by time and social-economic correlates. This country-level impact analysis may be coarse, especially for large countries in which intra-country variability may be quite high, but global research on inter-country disparities in impacts from country-reported natural disasters is still useful, especially for international and national humanitarian efforts towards natural disasters.
One caveat is warranted regarding the EM-DAT database. Records of natural-disaster impacts are usually affected by data availability, accuracy, and other reasons, especially for earlier years of 1900–2015 used in this research. Therefore, data collection, classification, interpretation, and recording used in EM-DAT could induce biases (Berz, Citation2000; WHO, Citation2002; Shen and Hwang, Citation2016). In addition, Gall et al. (Citation2009) delineate six major biases that alone or in combination slant the interpretation of disaster loss information and eventually lead to a number of common misperceptions or fallacies about hazard events.
Data and method
First of all, straightforward data analyses with ranking, percentage, total, and classification are summarized in tables, charts, and maps. These summary views focus on top 10, 20, and 30 hotspot countries by disaster impacts in fatality, injured, affected, and damage. Similar views are also drawn at the continent level and for top countries from each continent. Finally, representative linear or nonlinear correlates between country disaster impacts and social-economic attributes, such as population, land area, and GDP are explored and reported.
Three types of databases were used as inputs. First, the natural disaster database was obtained from EM-DAT published by CRED (Citation2015). The database was compiled from various sources, including UN agencies, non-governmental organizations, insurance companies, research institutes and press agencies and organized in a hierarchical manner from high levels to specific types of natural disasters in the world from 1900 to 2015. Each natural disaster contains important attribute such as disaster groups, sub-groups, types, sub-types, and disaster impacts – human injuries, fatalities, people affected, and damages – by space (e.g., continent, region, country) and time (e.g., year). Second, the world country boundary GIS database was drawn from Global Administrative Unit Layers (GAUL) for the world developed by the Food and Agriculture Organization (FAO) of the United Nations (FAO-UN Citation2014). Third, the world social-economic attributes of historical country population, area, and gross domestic product (GDP) data were extracted from the World Development Indicators database by the World Bank (Citation2015).
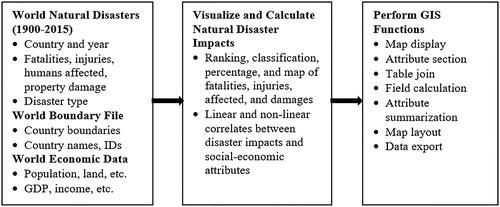
can be summarized into the following three steps. The first step is to process tables of disaster impacts and world development indicators spatially by country/continent and temporally by year/decade/total period for natural disasters using the EM-DAT database for the period of 1900–2015. The second step is to calculate ranking, classification, percentage, and correlate for human fatalities, injuries, people affected, and damages by spatial and temporal scales. The third step is to perform GIS functions using ‘Summarize’, ‘Join’, and ‘Field Calculator’ on the tables produced in the first and second steps, and the world boundary GIS layer. This step also produces visualizations of natural disaster impact by country.
Figure 1. Data processing flowchart.
Results and analysis
A temporal view of natural disaster impacts at the world level
As shown in , the reported annual human fatalities from natural disasters in the world were relatively higher in the first half of the 20 century than in the second half, and fluctuated dramatically (e.g. about hundreds to 3.7 million) until after the early 1960. Since the late 1960s, the annual average deaths decreased dramatically, though there were some fluctuations (e.g. from thousands to hundreds of thousands). It is very noticeable that the dynamics of the annual casualties, the injured in , the affected in , property damage in , and the annual disaster occurrence (e) were clearly different. A decrease in loss of life from natural disasters might be due to improved systems for forecasting, warning, and evacuation in hazard-prone areas in a country; meanwhile, an increase in the injured, the affected, and property damage might be due to increasing interactions between human beings and natural systems under rapid urbanization with more people and buildings, especially in natural hazard prone areas in both developing and developed countries in the world (Mileti Citation1999; Burby Citation1998). It is interesting to note that the sharp increasing trend from 1960 to 2000 and the quick drop from 2000 to 2015 of occurrences show a sharp self-contradictory since the hazard and disaster monitoring and reporting technologies have been improving tremendously since 1960.
Figure 2. A temporal view of world natural disasters, 1900–2015.
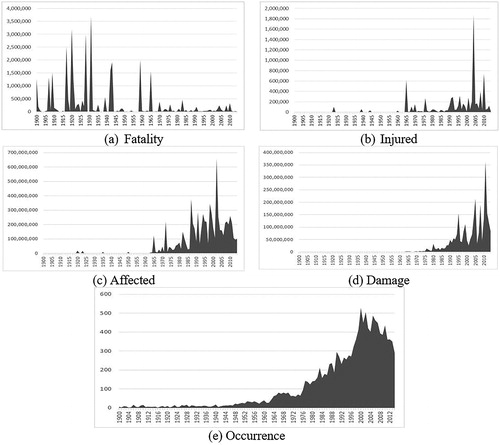
shows natural disaster impacts worldwide by decade during 1900 to 2015. The five different types of natural hazards showed a gradual increase in the number of global disaster occurrence for the entire period, and so did the annual number of the injured and affected, and damage accordingly. Conversely, the annual deaths worldwide decreased. What is noticeable is that the reported number of disaster occurrence was generally higher for both hydrological and meteorological hazards than for biological, climatological and geophysical ones; while the total number of fatalities from geophysical hazard stayed almost the same during the entire period. A dramatic decrease was seen in the total number of fatalities for biological and climatological hazards as times went by (due perhaps to improved public health, weather prediction and warning systems), even though an increase was seen in the number for climatological hazards due to a couple of low-probability and high-impact events (e.g., Bangladesh and India droughts of 1943). In general, people affected were relatively higher for climatological and hydrological hazards than for the other three while the property damage was relatively higher for geophysical, hydrological, and meteorological hazards than for the remaining two.
Table 2. Natural disaster impacts by decade, 1900–2015.
contains some zero entries or extremely small numbers, though the zero entries may not be true zeros according to CRED (Citation2015) due to various data collection and processing issues. More zeros and small values occurred more for injury and damage, more for early years (e.g. prior to 1960), and more for biological, climatological, and hydrological disasters. In fact, the EM-DAT has few zeros for all losses and all disaster types since 1960s, especially since 1990. The zeros and extremely small values in EM-DAT raised some quality concerns about and clarifications for the database. Nevertheless, EM-DAT is still one of the most comprehensive and widely used public databases on global natural disasters (Dilley et al. Citation2005; Peduzzi et al. Citation2009; Wirtz et al. Citation2014; CRED Citation2015).
A spatial view of natural disaster impacts at the country level
maps 221 countries of the world with the top (in darker brown colors) and bottom (in lighter yellow colors) countries to represent the frequency of natural disasters and their impacts while shows top 30 countries ranked by the frequency and impacts (fatality, injured, affected, and damage) and lists cumulative shares of the top 10, 20, and 30 countries with respect to the world total for the period of 1900–2015. There are several interesting features worthy of some discussions. First, the natural disaster occurrence in top countries include the world’s large or most populated countries such as the United States, China, India, Philippines, Indonesia, Bangladesh, and Japan. These top countries spread all over continents. On the other hand, the bottom countries where only a single natural disaster was reported during 1900–2015 include small or less-populated countries such as St. Helena, Palau, French Guiana, Equatorial Guinea, and Brunei Darussalam. Second, the top four countries with over 2 million people killed from different natural disasters are found in Asian countries (e.g. China, India, and Bangladesh), while the bottom countries where no person was killed include small or less-populated countries such as Macau, Finland, Virgin Islands (UK), Brunei Darussalam, French Guiana, Palau, and St. Helena. Third, the spatial patterns of the number of the injured and the affected from natural disasters roughly echo those of fatalities, except for several countries. Fourth, the top six countries in economic damage include the developed countries such as the United States, Japan, Italy, Germany and developing China and India, whereas Africa was a less naturally disastrous continent except for a few countries (e.g. Algeria, Egypt, Sudan, Nigeria, South Africa, Mozambique). Fifth, China was among the top two in disaster occurrence and impacts.
Figure 3. A spatial view of natural disaster impacts by country, 1900–2015. Source: Author
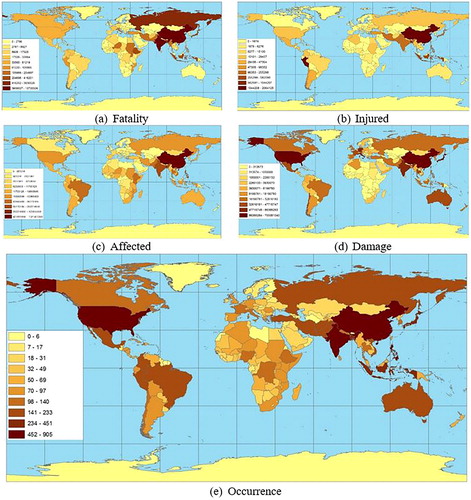
Table 3. Top 30 countries ranked by total disaster impact.
clearly shows that the share of the top 10, 20, and 30 countries ranged from about 35% to 98%: Occurrence (35.02%, 47.47%, and 56.06%), Fatality (92.86%, 96.69%, and 98.14%), Injured (86.44%, 93.50%, and 96.39%), Affected (87.27%, 91.59%, and 94.15%), and Damage (74.85%, 85.40%, and 91.47%). The middle 161 countries (except for the top 30 and the bottom 30 countries) had 42.62% in disaster occurrence, 1.86% for fatality, 3.61% for injured, 5.85% for affected, and 8.53% for damage. The bottom 30 countries had almost zero disaster impacts. These percentages suggest that the top 30 disaster countries share over 90% disaster impacts and many of them have a large population (e.g. China, India), fast growing pace (e.g. China, India, and Brazil), quick industrialization (e.g. China, India, and South Korea), or an advanced economy (e.g. the United States, Japan, and Germany). Also, they are all over the continents and more than 1/3 countries are in Asia, especially China, India, Bangladesh, Japan, Indonesia, and Philippines.
shows the top 10 countries ranked by occurrence and impact by natural disaster subgroup. Top countries by each disaster impact were found in all continents, with some leading countries such as China, India, and Bangladesh in Asia; the United States, Canada, and Mexico in North America; Columbia, Brazil, Chile, and Peru in South America; Sudan, Ethiopia, and South Africa in Africa; Iran and Turkey in Middle East or Eurasia; and Germany, Russia, France, and Italy in Europe, and Australia in Oceania. Some countries are considerably riskier than others when multiple disaster impacts are considered together, such as China, India, Bangladesh, Indonesia, the United States. Again, large developing and large developed countries were hot-spots for natural disaster impacts.
Table 4. Top 10 countries of disaster impacts by natural disaster subgroup.
shows the top 10–30, bottom 10–30, and middle 65–132 for the total 221 countries by natural disaster occurrence, impact, and subgroup. Hydrological disasters (5,228) were ranked first in occurrence, followed by meteorological disasters (4,376), geophysical disasters (1,599), biological disasters (1,468), and climatological disasters (1,086). Even though climatological and biological disasters happened less, they caused more fatalities (e.g. climatological – 11.74 million; biological – 9.59 million) than any other disaster type did (e.g. hydrological – 7.01 million; geophysical – 2.68 million; meteorological – 1.57 million). Meanwhile, meteorological disasters produced the most injuries – 3.33 million, followed by geophysical – 2.68 million, hydrological −1.34 million, and biological −0.59 M. Hydrological disasters ranked first for the number of people affected – 3.64 billion. This was followed by climatological – 2.30 billion, and meteorological – 1.11 billion. Finally, meteorological disasters generated the largest damages – $11.09 trillion, followed by geophysical – $7.80 trillion, hydrological – $7.10 trillion, and climatological – $2.01 trillion. These figures show that different kinds of natural hazards could have quite different disaster impacts, for example, while biological or climatological hazards were more deadly with most casualties, meteorological and geophysical hazards were more costly with highest economic losses.
Table 5. Disaster impacts by disaster subgroup and country group.
Meanwhile, the occurrence percentages in are based on ranking of fatality. Other percentages are based on disaster impacts. For fatality occurrence, the top 10, 20, and 30 countries accounted for 21.73%-54.90% for biological, 13.44%-45.49% for climatological, 45.54%-75.92% for geophysical, 23.66%-54.44% for hydrological, and 45.27%-64.69% for meteorological, while the middle 65-132 countries shared from low 22.20% for geophysical to high 47.70% for climatological, indicating disasters occurred mostly in the top 30 countries, especially geophysical and meteorological disasters with nearly a half happened in top 10 countries.
Further, among the five disaster subgroups, the top 10 countries had 71.18% (affected by geophysical) -100% (damage by biological) shares of their four impacts, except 3.62% injured and 16.15% damage for climatological, 41.53% injured for meteorological, and 48.11% damage for hydrological disasters. The top 20 countries had more than 53.23% (damage by hydrological) except 35.95% and 42.40% injured by climatological and meteorological disasters. Also, the top 30 countries experienced more than 80% impacts except 72.83% and 75.85% damage by climatological and hydrological hazards. These figures again indicate the concentration of disaster impacts in a relatively small number of countries.
A continental view of natural disaster impacts
compares natural disaster impacts by continent. Asia is clearly the top continent for disaster happenings and leads in the world in damage (46.13% or $1.29 trillion), injured (57.27% or 4.55 million), fatality (80.36% or 26.18 million), and affected (87.65% or 6.39 billion). The next is Americas continent, which was more impacted in injury (38.49% or 3.06 million) and damage (36.53% or $1.02 trillion). Europe came in third and was more impacted in fatality (12.75% or 4.15 million) and damage (13.43% or $376 billion). Oceania continent, which consists primarily Australia, New Zealand, had the least impacts, especially in fatality (0.06% or 19,304), injured (0.14% or 10,963), and affected (0.33% or 24.14 million). Interestingly, Africa, the relatively least developed continent, shared 18.28% or 2,515 of world natural disaster occurrence, but had the second lowest disaster impacts, especially in injured (2.68% or 212,979) and damage (1.08% or $30.19 billion).
Table 6. Natural disaster impact by continent.
A view of top countries in disaster impacts
illustrates the natural disaster occurrences and losses for the top country in each continent by disaster subgroup and type. First of all, China as a single country had large shares of people affected (43.48% or 3.17 billion), fatality (39.05% or 12.72 million), and injured (21.15% or 1.68 million) in the world over the period of 1900–2015. These shares came with 5.95% or 818 of the world total disaster occurrence. While with the most disaster happenings at 6.79% or 934, the United States had relatively low fatality (0.14% or 44,008), injured (0.35% or 28,215), and people affected (0.38% or 27.76 million). However, the United States had the highest economic loss in total damage (28.19% or $7.89 trillion). Following China and the US were Iran, Russia and Ethiopia in disaster impacts.
Table 7. Natural disaster impact by disaster type for top countries in each continent.
As for disaster types in each top country, China had the flood was the most severe hazards, leading in disaster occurrence (31.91%), fatality (51.88%), injured (49.18%), people affected (63.08%), and damage (47.13%). Following flood is earthquake, which accounted 18.95% of occurrences, 39.69% of injuries, and 23.91% of damages. Storm and drought were also deadly and disastrous, with storms causing 27.54% fatality and drought leading 17.44% economic losses. Epidemic was catastrophic as well, accounting for 12.27% deaths. In the United States, storms led the way in all categories of disaster impact, with 62.53% of the occurrences causing 76.03%, 69.65%, 50.84%, and 49.00% in damage, fatality, affected, and injured, respectively. Following storm type were flood, earthquake, and wildfire in disaster impacts while other types were minor.
In Russia, flood (e.g. 48.56% affected, 47.77% injured, and 36.71% damage) and extreme temperature (e.g. 93.98% fatality and 18.94% injured) were most severe, followed by drought (e.g. 22.49% damage) and wildfire (e.g. 20.55% damage). In Iran, the top natural disaster was earthquake, causing 94.34% fatality, 99.52% injured, and 50.47% damage. Drought (e.g. 84.61% affected) and flood (e.g. 35.32%) came to second or third. In Ethiopia, Drought took the top spot with 96.48% for fatality, 96.42% for affected, and 77.89% for damage. Following drought were flood, causing 48.13% injured and 16.17% damage and earthquake, causing 47.55% injured and 5.95% damage.
Correlates between disaster impacts and social-economic attributes
The above spatial and temporal views indicate that disaster occurrences and impacts varied by country and year. However, natural hazards are mostly caused by natural forces below, on, and above the earth. Although knowledge about certain patterns of natural hazards has been accumulated, for example, earthquakes along geological faults, full understanding of the exact disaster occurrences and impacts in space and time is few and far in between. Complicating this are features of human settlements and errors of disaster impact recordings. Despite all these, it would be intriguing to see what plausible correlates exist between disaster impacts and social-economic attributes.
Scatter box plots in show overall correlates between country-level population, area, and GDP and disaster occurrence and disaster impact by total and subgroup. These plots include all data values including outliers and influential points, which are included because they are more likely to be the top disaster hotspots and, hence, important to this research. The boxes labelled with R2 > 0.500 show the correlation R > 0.70. In general, population, area, and GDP show positive correlations with occurrence and the disaster impacts except for a few cases, as the lines indicate.
Figure 4. Correlates with outliers and influential points.
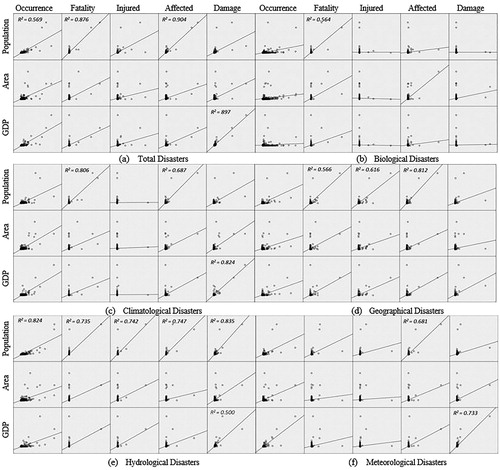
Specifically, population correlates well with fatality or people affected with R2 > 0.500 (or R > 0.70) for 4 of the 5 boxes. The two highest are R2 = 0.904 (or R = 0.951) for peopled affected and R2 = 0.876 (R = 0.936) for fatality in total for all disaster subgroups. Population is also good in correlation with occurrence (R2 = 0.569 for total, R2 = 0.824 for Hydrological), injured (R2 = 0.616 or R = 0.785 for Geographical, R2 = 0.735 or R = 0.857 or for Hydrological), and damage (R2 = 0.835 or R = 0.914 for Hydrological). GDP correlates well with damage (R2 = 0.897 or R = 0.947 for total, R2 = 0.824 or R = 0.908 for Climatological, R2 = 0.500 or R = 0.707 for Hydrological, and R2 = 0.733 or R = 0.856 for Meteorological). Area has no single R2 > 0.500 or R = 0.707, but does have some weak to moderate correlations, especially with occurrence, fatality, and damage.
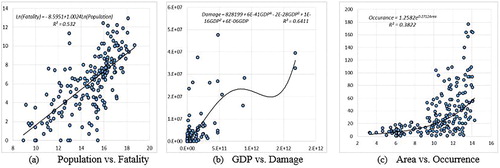
shows sample log-linear and non-linear correlations with outliers and influential points removed for the population vs. fatality in linear (R2 = 0.532 or R = 0.729), GDP vs. damage in polynomial (R2 = 0.641 or R = 0.801), and area vs. occurrence in exponential (R2 = 0.382 or R = 0.618).
Figure 5. Sample correlates without outliers and influential points.
Conclusions and discussions
Natural hazards (such as flood, earthquake, and hurricane) happen in mother-nature. However, natural disasters causing deaths, injuries, and property losses occur through interactions between natural and man-made environment. No country can be completely immune from natural hazards, but some countries suffered more from natural disasters than others. The spatial–temporal views in this research show that many natural disasters occurred during 1900–2015 and generated severe impacts to countries all over the world, especially large, populated, developed, or rapidly developing nations. However, in terms of sustainability and residency, both developed and developing countries have a long way to go.
The United States ranked highest in natural disaster occurrence, followed by China, India, Philippines, Indonesia, Bangladesh, and Japan which are all located in Asia. The nations with the most fatalities were China, India, Russia, Bangladesh, Haiti, and Ethiopia while the highest numbers of injuries were recorded in Peru, China, Bangladesh, Haiti, Indonesia, Japan, and India. Also, the United States was ranked first in terms of damage of properties, crops, and live stocks, followed by Japan, China, India, Italy, Germany, and Chile. All of these nations were among the ones with top GDP outputs. These results also show that natural disasters happened in nations across every continent (e.g. Asia, Europe, Africa, and Americas), even though some countries in one continent were riskier than others in another continent.
Correlations between social-economic attributes and disaster occurrences or impacts indicate that only some of them are strong and significant. In general, country population is more correlated with occurrence, fatality, injured, and affected, GDP is more correlated with damage, while country land area has only weak correlations with disaster occurrence and impacts. These correlations are stronger when all natural disaster subgroups are combined, especially with outliers or influential points included. Sample log-linear or non-linear correlations were explored after excluding outliers or influential points, but they may not fit well to the disaster hotspot countries, which tend to have large social-economic values and disaster impacts. Perhaps stratified correlations corresponding to country and impact classifications make more senses.
Along with population increase, economic development, and technology adoption, recent decades have seen an increase of natural disasters and their disastrous impacts across the countries. Thus, this research is important in revealing spatial and temporal risk disparities by natural disasters, especially to the wellbeing of disaster hotspot countries. The spatial–temporal snapshots of global natural disasters taken in this research can further facilitate disaster-related policies, resilient measures, and sustainable development at the national and international level. More specifically, this research can be used as references for country-wide disaster impact assessments or analyses, especially for country governments to make sound emergency preparedness, disaster response and recovery, and hazard mitigation decisions, policies, or plans regarding natural disasters. If country-level views are too aggregated and, hence, cannot reveal intra-country variabilities of disaster impacts, local governments at the state, provincial, or municipal levels may want to use finer spatial units, such as sub-country units (e.g. state, city), to conduct jurisdiction-specific impact assessments for more sustainable and resilient policies, initiatives, or plans to minimize losses from natural disasters. In addition, the results of this research can be useful to the insurance plans or policies against losses from natural disasters. This aspect is essential for both public and private sectors of the insurance business (e.g. Gizzi et al., Citation2016). Towards these ends and for better quality of live for all countries in the world, more research on global natural disaster impacts and their assessment, prevention, mitigation, and recovery is much warranted.
Disclosure statement
No potential conflict of interest was reported by the authors.
Related Research Data
References
- Aven T, Cox LA. Jr 2015. Foundations of risk analysis. On-line special issue of Risk Analysis: An International Journal. Wiley-Blackwell. http://onlinelibrary.wiley.com/journal/10.1111/(ISSN)1539-6924/homepage/special_issue__foundations_of_risk_analysis.htm. Accessed July 10, 2016
- Beck G, Kropp C. 2011. Infrastructures of risk: a mapping approach towards controversies on risks. J. Risk Res. 14(1):1–16.
- Berke PR. 1995. Natural-hazard reduction and sustainable development: a global assessment. J Plann Literature. 9(4):370–382.
- Blaikie P, Cannon T, Davis I, Wisner B. 1994. Risk: natural hazards, people's vulnerability, and disasters. London: Routledge.
- Berz G. 2000. Flood disasters: lessons from the past-worries for the future, P. I. Civil Eng. 142:3–8.
- Bolin B, Kurtz LC. 2018. Race, class, ethnicity, and disaster vulnerability. In Rodríguez H, Donner W, Trainor JE, editors. Handbook of disaster research. Cham: Springer; p.181–203.
- Burby, R. J. (Ed.). (1998). Cooperating with nature: confronting natural hazards with land-use planning forsustainable communities. Joseph Henry Press
- Carrivick JL, Tweed FS. 2016. A global assessment of the societal impacts of glacier outburst floods. Global Planet Change. 144:1–16.
- Cox LA. Jr. 2001. Risk analysis: foundations, models and methods. New York: Springer.
- Cvetković V, Dragicević S. 2014. Spatial and temporal distribution of natural disasters. J Geogr Instit Jovan Cvijic, SASA. 64(3):293–309. doi: 10.2298/ijgi1403293.
- CRED 2009a. Classification. http://www.emdat.be/new-classification [accessed 2015 Mar 9]
- CRED 2009b. Explanatory Notes. http://www.emdat.be/explanatory-notes [accessed 2015 Mar 9]
- CRED 2015. Database. http://www.emdat.be/database [accessed 2015 Mar 9]
- Cutter SL. 1996. Vulnerability to environmental hazards. Prog Hum Geog. 20(4):529–539.
- Cutter SL, Emrich CT, Webb JJ, Morath D. 2006. Social vulnerability to climate variability hazards: a review of the literature. Hazards and Vulnerability Research Institute, University of South Carolina, Columbia.
- Cutter SL, Mitchell JT, Scott MS. 2000. Revealing the vulnerability of people and places: a case study of Georgetown County, South Carolina. Ann Assoc Am Geogr. 90(4):713–737.
- Dewan AM. 2013. Floods in a megacity: geospatial techniques in assessing hazards, risk and vulnerability. Dordrecht: Springer.
- Deyle RE, French SP, Olshanky RB, Paterson RG. 1998. Hazard assessment: a factual basis for planning and mitigation. In: Burby RJ, Cooperating with nature: confronting natural hazards with land-use planning for sustainable communities. Washington, DC: Joseph Henry Press; p.119–166.
- Dilley M, Chen RS, Deichmann U, Lerner-Lam AL, Arnold M, Agwe J, Buys P, Kjevstad O, Lyon B, Yetman G. 2005. Natural disaster hotspots: a global risk analysis. Washington, DC: World Bank.
- Dottori F, Szewczyk W, Ciscar J-C, Zhao F, Alfieri L, Hirabayashi Y, Bianchi A, Mongelli I, Frieler K, Betts RA, et al. 2018. Increased human and economic losses from river flooding with anthropogenic warming. Nature Clim Change. 8(9):781.
- FAO-UN (Food and Agriculture Organization of the United Nations) 2014. Global Administrative Unit Layers (GAUL). Rome, Italy
- Gaillard JC, Liamzon CC, Villanueva JD. 2007. Natural disaster? A retrospect into the causes of the late-2004 typhoon disaster in Eastern Luzon, Philippines. Environ Hazards. 7(4):257–270.
- Gall M, Borden KA, Cutter SL. 2009. When do losses count? Six fallacies of natural hazards loss data. Bull Amer Meteor Soc. 90(6):799–809. https://doi.org/10.1175/2008BAMS2721.1.
- Giuliani G, Peduzzi P. 2011. The Preview global risk data platform: a geoportal to serve and share global data on risk and natural hazards. Nat Hazards Earth Syst Sci. 11(1):53–66.
- Gizzi FT, Potenza MR, Zotta C. 2016. The insurance market of natural hazards for residential properties in Italy. OJER. 5(1):35–61. http://dx.doi.org/10.4236/ojer.2016.51004.
- Greenberg MR, Cox LA. Jr. 2014. Economics of risk analysis. On-line special issue of Risk Analysis: An International Journal. Wiley-Blackwell. http://onlinelibrary.wiley.com/journal/10.1111/(ISSN)1539-6924/homepage/special_issue__economics_of_risk_analysis.htm [accessed 2016 Jul 10]
- Greenberg M, Haas C, Cox LA, Lowrie K, McComas K, North W. 2012. Ten most important accomplishments in risk analysis, 1980–2010. Risk Anal. 32(5):771–781.
- Kirschbaum D, Stanley T, Zhou Y. 2015. Spatial and temporal analysis of a global landslide catalog. Geomorphology. 249:4–15.
- Kron W, Steuer M, Low P, Wirtz A. 2012. How to deal properly with a natural catastrophe database – analysis of flood loses. Nat Hazards Earth Syst Sci. 12(3):535–550.
- Lesk C, Rowhani P, Ramankutty N. 2016. Influence of extreme weather disasters on global crop production. Nature. 529(7584):84–87.
- Lindell MK. 2013. Disaster studies. Current Sociol. 61(5–6):797–825.
- Mileti D. 1999. Disasters by design. Washington, DC: Joseph Henry/National Academy Press.
- Murphy C, Gardoni P. 2006. The role of society in engineering risk analysis: a capabilities-based approach. Risk Anal. 26(4):1073–1083.
- Mustafa D. 1998. Structural causes of vulnerability to flood hazard in Pakistan. Econ Geog. 74(3):289–305.
- O’Keefe PK, Westgate K, Wisner B. 1976. Taking the naturalness out of natural disasters. Nature. 260:566–567.
- Orencio PM, Fujii M. 2014. A spatial-temporal approach for determining disaster-risk potential based on damage consequences of multiple hazard events. J. of Risk Res. 17(7):815–836.
- Peduzzi P, Dao H, Herold C, Mouton F. 2009. Assessing global exposure and vulnerability towards natural hazards: the disaster risk index. Nat Hazards Earth Syst Sci. 9(4):1149–1159.
- Peduzzi P, Dao H, Herold C. 2005. Mapping disastrous natural hazards using global datasets. Nat Hazards. 35(2):265–289.
- Shen G, Hwang SN. 2015. A spatial risk analysis of tornado-induced human injuries and fatalities in the USA. Nat Hazards. 77(2):1223–1242.
- Shen G, Hwang SN. 2016. Revealing global hot spots of technological disasters: 1900–2013. J Risk Res. 14(1):1–16.
- Shen G, Hwang SN. 2018. Revealing global hot spots of technological disasters: 1900–2013. J Risk Res. 21(3):361–393.
- Shen G, Zhou L, Wu Y, Cai Z. 2018. A global expected risk analysis of fatalities, injuries, and damages by natural disasters. Sustainability. 10(7):2573.
- Shi P, Karsperson R. 2015. World atlas of natural disaster risk. Heidelberg: Springer.
- Shi P, Yang X, Xu W, Wang J. 2016. Mapping global mortality and affected population risks for multiple natural hazards. Int J Disaster Risk Sci. 7(1):54–62.
- Turner B. L., Kasperson R.E., Matson P.A., McCarthy J.J., Corell R.W., Christensen L., Eckley N., Kasperson J.X., Luers A., Martello M.L., Polsky C., Pulsipher A., Schiller A. 2003. A framework for vulnerability analysis in sustainability science, Proc Natl Acad Sci. 100(14), 8074–8079.
- Tyler NJC, Turi JM, Sundset MA, Strøm Bull K, Sara MN, Reinert E, Oskal N, Nellemann C, McCarthy JJ, Mathiesen SD, et al. 2007. Saami reindeer pastoralism under climate change: applying a generalized framework for vulnerability studies to a sub-Arctic social-ecological system. Global Environ Chang. 17(2):191–206.,
- Winsemius HC, Aerts JCJH, van Beek LPH, Bierkens MFP, Bouwman A, Jongman B, Kwadijk JCJ, Ligtvoet W, Lucas PL, van Vuuren DP, et al. 2016. Global drivers of future river flood risk. Nature Clim Change. 6(4):381.
- White GF, Hass JE. 1975. Assessment of research on natural hazards. Cambridge, MA: MIT Press.
- WHO 2002. Floods: climate change and adaptation strategies for human health. London: World Health Organization of the United Nations.
- Wirtz A, Kron W, Löw P, Steuer M. 2014. The need for data: natural disasters and the challenges of database management. Nat Hazards. 70(1):135–157.
- Wisner B, Blaikie P, Cannon T, Davis I. 2004. At risk: Natural hazards, people’s vulnerability and disasters. 2nd ed. New York: Routledge.
- World Bank 2015. World development indicators. Washington, DC: World Bank [accessed 2015 April]. http://data.worldbank.org/data-catalog/world-development-indicators
- Wu S-Y, Yarnal B, Fisher A. 2002. Vulnerability of coastal communities to sea-level rise: a case study of Cape May County, New Jersey. Clim Res. 22:255–270.