
Abstract
Ground deformation areas can be monitored with geomatic methodologies which provide high-precision and high-resolution data. One example is digital aerial photogrammetry, which can be used to reconstruct ground deformations over long periods (80–90 years) with multi-temporal surveys. This technique was used to survey the planimetric deformations of the Po River Delta (PRD), characterized in the past by considerable land subsidence due to intensive pumping of methane water from 1938 to 1961. In the last few decades, land subsidence has been greatly reduced, but is still high compared with natural values, and has influenced the coastline of areas not protected by embankments. In this work, multi-temporal digital photogrammetry was used to study the evolution of the PRD coastline from 1944 to 2014 in the course of seven photogrammetric surveys (1944, 1955, 1962, 1977, 1999, 2008 and 2014). Results of the multi-temporal analysis were correlated with available subsidence rates (from levelling, for the past, and from synthetic aperture radar, for the period 1992–2017): this study show agreement between land subsidence and areas submerged by the sea, although they are also greatly influenced by human activities and sea level rise which increasingly exposing the area to the risk of widespread flooding.
1. Introduction
Several methods can be used to study ground deformations such as global positioning systems (GPS or later GNSS – global navigation satellite system), both continuous (CGPS) and differential (DGPS) (Bitelli et al. Citation2000; Baldi et al. Citation2009; Cenni et al. Citation2013), space-borne observation techniques based on synthetic aperture radar (SAR), interferometry (InSAR, with differential InSAR – DInSAR and advanced differential A-DInSAR that allow to maximize the potential of this technique and permit time series analysis) (Bock et al. Citation2012; Teatini et al. Citation2012; Costantini et al. Citation2017; Fiaschi et al. Citation2018), satellite images (acquired with various kinds of sensors, with mono and/or stereo ground coverage), classical topographic measurements and repeated geometric levelling on benchmarks (Barbarella et al. Citation1990; Bondesan et al. Citation1997; Fabris et al. Citation2014; Hung et al. Citation2018), light detection and ranging (LiDAR) with airborne laser scanning (ALS) approach (Fabris et al. Citation2010; Marsella et al. Citation2012) and aerial digital photogrammetry (Baldi et al. Citation2005; Fabris and Pesci Citation2005; Baldi et al. Citation2008a, Citation2008b). For limited areas, also unmanned aerial vehicle (UAV) (Mancini et al. Citation2013) and terrestrial laser scanning (TLS) (Pesci et al. Citation2007, Citation2013) systems can successfully be used.
Some of these techniques, based on recent sensor analyses, allow deformations to be examined for the last 20 years or less (GPS – GNSS, SAR, satellite images, LiDAR – ALS and TLS, UAV). The others (mainly geometric levelling and aerial photogrammetry), due to the availability of archive data, allow studies over the long term which can sometimes cover hundreds of years (Salvioni Citation1957; Marsella et al. Citation2012).
In studies of coastline changes, levelling does not provide useful data on planimetric variations; classical topographic techniques can be of great use, but only aerial photogrammetry provides the kind of continuous datasets needed for this study, and allows ground deformations to be reconstructed over long periods, thanks to ‘historical’ (from the 1930s) and continuous data (Chandler and Cooper Citation1988a).
The digital photogrammetric method is one of the most powerful tools to measure the coordinates of large numbers of points, from which high-resolution digital elevation models (DEMs) can be extracted: they can reconstruct three-dimensional ground surfaces and analyse the morphological characteristics of the Earth’s surface (Walstra et al. Citation2004; Baldi et al. Citation2006; Brückl et al. Citation2006; Chandler et al. Citation2007). Digital models are traditionally generated by automatic or semi-automatic procedures based on well-defined shape comparison methods or grey/colour level distributions in the corresponding areas of the images (Kraus Citation1993).
Models with high resolution and precision, acquired repeatedly over an area undergoing significant ground deformation, can be used to evaluate morphological surface changes and thus estimate areas and/or mass movements (Baldi et al. Citation2005, Citation2008b; Marsella et al. Citation2012). The positions of natural and artificial points can also be measured in multi-temporal stereoscopic images, defining displacement vectors of ground points (Fabris et al. Citation2011). The method can also be applied to planimetric measurements (2-D) when elevations are not reliable: this is useful, for example, in surveys of planimetric changes in coastlines.
Although the photogrammetric approach is less accurate than other measurement methods, such as classical topographic techniques or GPS, high-quality details and accuracy can be achieved if a large number of ground points are available, providing an overall view of ongoing processes (Brückl et al. Citation2006; Baldi et al. Citation2008a).
Photographic archives, which have been available for the last 70–80 years, are also an important source of historical data, enabling ground surfaces to be modelled on a local scale over several decades. Historical images can be processed by archival photogrammetry, yielding multi-temporal metric information (Chandler and Cooper Citation1988a, Citation1988b; Chandler and Brunsden Citation1995; Pesci et al. Citation2004; Walstra et al. Citation2004; Chandler et al. Citation2007).
The aim of this work is to exploit these characteristics of multi-temporal digital aerial photogrammetry to reconstruct the coastline changes of the Po River Delta (PRD) area (northern Italy) for the period 1944–2014: in this study restitution of the coastlines are performed by several operators, due to the difficulty of interpreting aerial images caused by flatness of the area and the presence of vegetation at sea level. These characteristics can introduce the sensitivity of the operator in the restitution phase. Final coastlines are extracted, taking into account also tidal elevation, averaging the data: results are obtained in terms of emerged surfaces balance.
These data are connected with vertical deformations of the study area, available using more accurate methodologies like geometric levelling, GPS, A-DInSAR approach. The correlation between these types of data, taking into account also sea level rise (SLR) values, allows to check the consistency of the data each other, and can improve the 3-D information for a more complete description of the deformation phenomenon, and then improve the infrastructures of defence from flooding, especially for embankments, jetties, etc.
Many authors, using different techniques, have study land subsidence and coastline changes in PRD in the past (Zambon Citation1967; Caputo et al. Citation1970, Citation1972; Dal Cin Citation1983; Arca and Beretta Citation1985) and nowadays (Bock et al. Citation2012; Tosi et al. Citation2016; Fiaschi et al. Citation2018), but no author have perform studies of emerged surfaces trend connected with land subsidence rates values in this area.
Modern deltas and their estuaries, which are of great ecological and economic value and support both high populations and extensive agriculture (Ericson et al. Citation2006), are strongly influenced by the sea (waves, storm surges, flooding) (Minderhoud et al. Citation2017). The combination of reductions in river sediment supplies and land subsidence, due to natural processes and human interventions, expose the most important Mediterranean deltas (Nile, Rhone, Po, Ebro) to high risk of flooding, which can increase due to SLR (Jeftic et al. Citation1996; Syvitski et al. Citation2009).
2. Materials and methods
2.1. PRD and land subsidence
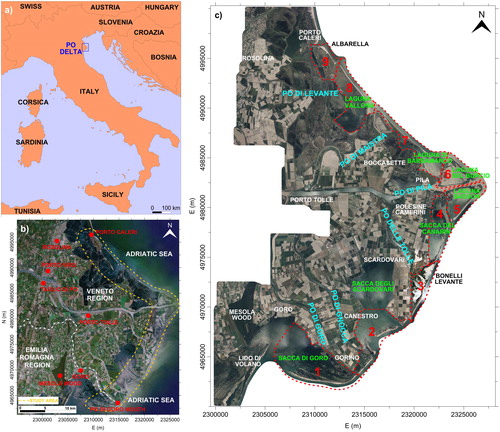
The Po is the largest river in Italy, running west–east for about 690 km before flowing toward the northern Adriatic, where it feeds the modern delta. The PRD covers about 400 km2, extends seaward for about 25 km (); the geology of the delta is mainly composed of terrigenous sediments up to 2000 m thick and has a complex multi-aquifer freshwater system (Simeoni and Corbau Citation2008).
Figure 1. (a) Location of PRD area (northern Italy). (b) Regional boundaries and studied coastal area, corresponding to about 200 km2 (dashed yellow line). (c) Orthophoto of study area from aerial photogrammetric survey of 2014, and indication of the nine sub-areas (dashed red lines, from 1 to 9: 1 – Sacca di Goro; 2 – Sacca degli Scardovari; 3 – Bacino Bonelli Levante; 4 – Sacca del Canarin; 5 – Laguna Basson; 6 – Laguna del Burcio; 7 – Laguna di Barbamarco; 8 – Laguna Vallona; 9 – Isola di Albarella). Source: Author
Ground deformations in the PRD are mainly due to land subsidence of different origin: tectonic, sediment compaction and artificial (anthropic). Carminati et al. (Citation2003) indicates that long-term land subsidence is mainly the result of deep tectonics, glacial isostatic adjustments and geodynamic movements that provide a maximum rate of 2.5 mm/year. The possible effects of tectonic activity along the northern Apennine thrust front buried under Quaternary sediments was thoroughly discussed in Picotti and Pazzaglia (Citation2008). The recent deformation pattern of the Apennine belt and the Po Plain is due to the northward movement of the Adria plate (Mantovani et al. Citation2009). Sediment compaction subsidence is caused by soil lowering, due to compaction of lithological layers of ‘young’ soil and oxidation of peat; land subsidence in the study area has been periodically monitored since 1897 by levelling technique which, for the period 1897–1957, indicates rates of a few millimetres per year (Arca and Beretta Citation1985). Artificial subsidence is due to draining of wetlands, land reclamation and, in particular, pumping of methane water from the medium-depth Quaternary deposits (200–600 m), which was particularly intense between 1938 and 1961, when the Italian government suspended such operations (Colombo and Tosini Citation2009). However, land subsidence due to tectonics and sediment compaction cannot completely explain the falling rates over the last 60 years (Zambon Citation1967; Caputo et al. Citation1970; Bondesan et al. Citation1990) which may be attributed to large-scale human activities.
Vertical movements have been monitored frequently since 1950 by repeated high-precision level measurements, undertaken by the Istituto Geografico Militare Italiano (IGMI) and later by other local authorities, companies and institutions (Salvioni Citation1957; Caputo et al. Citation1970, Citation1972; Borgia et al. Citation1982; Barbarella et al. Citation1990). Caputo et al. (Citation1970) and Borgia et al. (Citation1982) indicate a maximum land subsidence rate of 250 mm/year in the delta for the period 1951–1957, and 180 mm/year between 1958 and 1962. Later (1962–1967), these rates fell to 33 mm/year, matching the gradual reduction in pumping (Caputo et al. Citation1970) and to 37.5 mm/year from 1967 to 1974. These last data clearly show the benefits gained by halting extraction. Subsequently, the rate decreased still further: recent studies (geometric levelling and GPS) have shown that land subsidence, albeit reduced, is still ongoing (Baldi et al. Citation2009; Cenni et al. Citation2013; Tosi et al. Citation2016; Fiaschi et al. Citation2018). Most of the PRD now lies below sea level: its characteristic shape, with elevated borders seawards and an immense depression in the centre, is due to the exaggerated lengthening of the deltaic branches, anthropogenic stabilization of the hydrographical network, and land subsidence (Simeoni and Corbau Citation2008). Sediment compaction and anthropogenic land subsidence (Carminati and Martinelli Citation2002) may lead to serious environmental problems, especially as they exacerbate relative SLR caused by climate variations worldwide (Gornitz Citation1995; Carbognin and Tosi Citation2002; Carbognin et al. Citation2011; Vibilić et al. Citation2017). The irregular lowering of the terrain also clearly modifies the drainage of the secondary hydraulic network and increases the rise in the salt wedge for many kilometres inland, so that some branches of water previously used for irrigation cannot be used anymore. This phenomenon has also led to the disappearance of the typical morphological elements of coastal wetlands and lagoons (Simeoni and Corbau Citation2008; Colombo and Tosini Citation2009).
For all these reasons, constant monitoring of changes throughout the complex ecosystem of the PRD is necessary in order to provide information to implement territorial defence systems against flooding (Ericson et al. Citation2006; Syvitski et al. Citation2009; Minderhoud et al. Citation2017).
2.2. Aerial photogrammetric surveys
2.2.1. Available data
This study of coastline changes was performed using data from aerial photogrammetric surveys of the PRD carried out in 1944, 1955, 1962, 1977, 1999, 2008 and 2014: in detail, the strips along the coastline were analysed from Porto Caleri (Rovigo) to the border between the Veneto and Emilia Romagna Regions ( a small area in Emilia Romagna). Unfortunately, the coverage of the 1944 survey is incomplete both for Veneto and Emilia Romagna, the 1962 survey is limited in the southern portion and the 1999 survey is limited to the northern portion of the study area: in these cases comparisons of data were reduced in multi-temporal analysis.
All aerial photos were acquired with analogic photogrammetric cameras, except the 2014 ones: the diapositive film frames of 1944, 1955, 1977 and 1999 were digitized with the Wehrli Raster Master RM2 photogrammetric scanner at 1000 dpi (for the 1944 ones at 1200 dpi); the 1962 images were available from IGMI, and the photographs of the 2008 survey from the Veneto Region at 800 dpi. The more recent survey of 2014 was performed using a digital camera Vexcel UltraCam-Xp with pixel size of 6 µm; all these data provide ground sample distance (GSD) between 50 and 80 cm for all surveys used here. These resolutions are more than adequate to detect the coastline, thanks to the uncertain ground-sea transition, frequent in the coastal areas of the delta. The main surveys characteristics are listed in .
Table 1. Main characteristics of aerial photogrammetric surveys used in this study: (1) 1944 survey performed by British Royal Air Force (RAF) with two cameras: photo size 24 × 24 cm, focal length 24 inch; photo size 18 × 24 cm, focal length 20 inch; (2) 1955 survey carried out by Gruppo Aereo Italiano (GAI) from 1 June to 22 July; (3) that of 1962 between 8 and 11 July; (4) that of 1977 on 10 October; (5) that of 1999 on 10 September: these data are available from IGMI; (6) 2008 survey performed between 21 and 22 August 2008 (data from Veneto Region); (7) 2014 survey performed by BLOM CGR with digital camera Vexcel UltraCam-Xp, image size 11,310 × 17,310 pixel, focal length 100.5 mm.
As the aerial photogrammetric surveys from 1955 to 2014 show stereoscopic coverage of the ground and those for 1944 partially show the same coverage, processing of the latter data was only possible to generate the photo-plan mosaic of the area, without 3-D representation.
2.2.2. Ground control points and images orientation
Ground control points (GCPs) are required for external orientation of photogrammetric images: a proper CGPS campaign was performed in 2008 to measure natural GCPs, clearly visible and uniformly distributed points on the images of the 2008 photogrammetric survey. A total of 43 points on the images were chosen and identified during on-site measurements (mainly corners of buildings and sidewalks, road signs, etc.). Double-frequency Leica GPS Systems 1200 were used: the survey was performed in static mode with a sampling rate of 15 s and acquisition time of 60 min. Some points of the Veneto GPS network, planned and measured in 2006, were used as reference stations (masters), and baselines with distances of less than 6–7 km were measured (Fabris et al. Citation2014). The data were processed with Leica Geo Office software, yielding 3-D coordinates for the 43 points in the Gauss Boaga Italian reference system (East and North) and the local geoid for elevations, obtained from GPS and levelling measurements (Fabris et al. Citation2014). The accuracy of the GCPs coordinates are in the order of 8 mm in planimetry and less than 15 mm in elevation.
These measurements were made at about the same time as images acquisition, so that the GCPs can be used to orientate the 2008 photographs. For the others (1944, 1955, 1962, 1977, 1999 and 2014) the elevation values of the GCPs had to be corrected, due to land subsidence in the analysed period. A method based on archival subsidence values available in literature (Salvioni Citation1957; Zambon Citation1967; Caputo et al. Citation1970, Citation1972; Borgia et al. Citation1982; Arca and Beretta Citation1985; Barbarella et al. Citation1990; Baldi et al. Citation2009; Cenni et al. Citation2013; Fabris et al. Citation2014) can be applied: for all GCPs, the elevation must be changed in multi-temporal analysis to report the values at the same time as the various photogrammetric flights. In addition, several GCPs were not visible for the oldest data due to the time which has elapsed since 2008, during which the territory has changed significantly. Thus, the coordinates of new points, clearly visible on the multi-temporal images series of 1944, 1955, 1962 and 1977, were manually measured on the photogrammetric model of 1977 from stereoscopic views: these points, after correction of elevations to report the points at the time of the photogrammetric surveys, were used as GCPs to orientate the data of 1944, 1955 and 1962.
Horizontal co-registration of the various surveys has to be evaluated by measuring 2-D natural points on photogrammetric models, clearly visible on the multi-temporal dataset. The coordinates of each point have to be compared with the same homologous points measured on the subsequent survey. The expected accuracy, according to the well-known relations of Kraus (Citation1993), provides values for these photogrammetric data ranging from 1 to 2 m.
2.3. Coastline restitutions with tidal elevation
The coastlines are drawn on the photogrammetric models after a study of tidal elevations for the surveys with stereoscopic coverage, in order to compare restitutions performed at different periods and to evaluate advances or regressions of the coastline referring to the same zero value. Coastline comparisons, obtained at different tidal elevations, provide incorrect data. This is particularly important in flat areas, like the PRD, where small high tide values may involve large areas. In this case, comparing the restitution performed at the ground-sea transition without tidal elevation correction produces erroneous information, because the data refer to different elevations.
For this reason, the study of the PRD coastal area also take into account tide values measured during image acquisition: data from ISPRA (Istituto Superiore per la Protezione e la Ricerca Ambientale) are used to perform restitution at zero level, independently of tide values. In this case, the tide gauge stations of Ravenna and Venice (those closest to the PRD) are examined, and all available data are averaged. At present, although there are other tide gauge stations in the PRD area, they have only been operating for a few years, so that the information they provide is of little use for this study, which required data referring to the period of the archival photogrammetric surveys.
When surveys are carried out at low tide, the zero level contour line (traced on the photogrammetric model with stereoscopic devices) is assumed to be the coastline. However, for surveys carried out at high tide, the problem is more complex, because the digital model must be extrapolated from under the surface of the sea until the zero level. Alternatively, bathymetric data (DTMM – Digital Terrain and Marine Model), if available, must be used to extract the zero level contour line.
2.4. Surface balance and accuracy
Emerged surfaces measured in the various photogrammetric surveys can be compared to evaluate planimetric changes and interactions with land subsidence rates. Correlations between the vertical displacements of the PRD coastal area and coastline changes are not easy: the area contains both surfaces with embankments and others without protection against flooding. As small-scale subsidence does not normally involve coastline changes in embanked areas, in this work the search for correlations between land subsidence and coastline changes by multi-temporal analysis can only be performed with sub-aerial areas without embankments. For this reason, the coastal area of the PRD outside the embankments is subdivided into nine homogenous sub-areas () and emerged surfaces are measured. Sub-areas are chosen with borders defined by embankments and river banks. These borders are thus stable in multi-temporal analysis, due to river stability, and surface variations depend only on natural causes, without the influence of the embankments. Emerged surfaces have to be measured inside each sub-area.
Restitution of emerged surfaces is not easy in the PRD, due to its flatness and the presence of vegetation at sea level. It should be noted that some involuntary errors are probably introduced during processing, due to the difficulty of interpreting aerial images. Mainly in the case of black-and-white images, large areas with reed beds may be interpreted by the operator as emerged areas in one survey and as submerged areas in the next, partly due to seasonal vegetation changes at sea level when the photogrammetric flights were made. In addition, flat areas with sandy coasts, which become portions below sea level in multi-temporal analysis, are difficult to interpret as emerged or submerged, due to water clarity. In all these ways, errors become very easy to make because of different interpretations of the same phenomena by different operators: for the same reason, estimation of accuracy is difficult, due to the influence of operator sensitivity.
To evaluate errors due to interpretation of emerged surfaces, which are also influenced by the slight elevation of the ground with respect to the sea (weak perception of stereoscopic elevation), restitution of the coastlines were independently performed by several operators, calculating the emerged surfaces for the same photogrammetric survey and then comparing the data.
3. Results
3.1. Photogrammetric processing and co-registration accuracy
Photogrammetric images were oriented with Socet Set software (SoftCopy Exploitation Tool Set). The GCPs measured in 2008 were used to generate the photogrammetric model for data acquired in that year and, after the correction of elevations, to extract the photogrammetric models of the 2014, 1999 and 1977 surveys with residuals in the order of some tens of centimetres (up to 0.50 m). For the oldest data (1944, 1955 and 1962), the GCPs measured on the 1977 model were used: in these cases, the photogrammetric models were extracted with residuals of about 60–80 cm.
To check the co-registration of these models, one hundred 2-D natural homologous points were measured, from the earliest to the latest surveys. lists the results of comparisons.
Table 2. Comparisons between coordinates of 100 homologous natural points, manually measured with stereoscopic viewing on models (E = East; N = North).
The standard deviation values of show peaks of about 2 m; this is also the same level of precision of expected accuracy for proper restitution of the coastline, mainly at the ground-sea transition, due to waves on the beach. In this case, more precise data were not needed for the aims of this study.
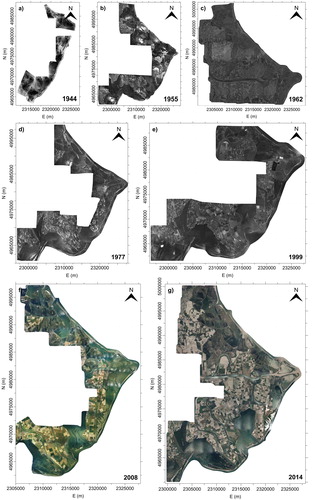
Subsequently, for each model (from 1955 to 2014), a DEM with a grid size of 5 m was extracted automatically. Correction of the DEMs in the areas where automatic correlation failed (mainly in lagoons, due to sunlight reflected from the water), was performed with stereoscopic viewing devices, adapting contour lines to the real morphology of the terrain. At the end of the process, the corresponding orthophotos were generated automatically with a GSD of 1.5 m. shows the orthophotos extracted from each photogrammetric survey.
Figure 2. Orthophotos of PRD coastal area obtained from seven multi-temporal aerial photogrammetric surveys: (a) 1944, (b) 1955, (c) 1962, (d) 1977, (e) 1999, (f) 2008 and (g) 2014. Source: Author
3.2. Coastline restitutions
Restitution of the coastline was made taking tidal elevation into account: this part of the study was performed only for the 1999, 2008 and 2014 surveys, due to lack of tidal elevation data for the oldest surveys. In addition, for the three photogrammetric flights analysed, average tide levels during image acquisition were −0.10 m, −0.09 m, 0.18 m for 1999, 2008 and 2014 respectively. As the GSD were about between 0.80 m and 0.50 m (), low-tide values could not be appreciated.
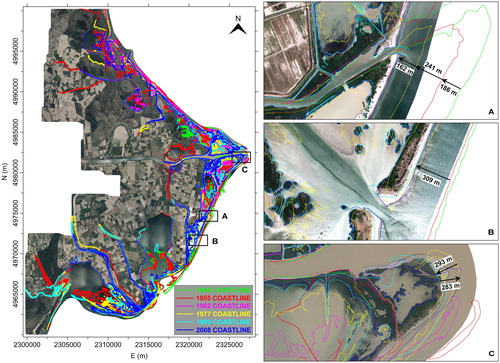
Coastlines resulting from the 1944, 1955, 1962, 1977, 1999 and 2008 surveys were overlapped on the orthophoto extracted from the 2014 ones ().
Figure 3. Coastlines obtained from aerial photogrammetric surveys performed in 1944 (green), 1955 (red), 1962 (magenta), 1977 (yellow), 1999 (cyan) and 2008 (blue) overlapped on the orthophoto generated from the 2014 one. Details A, B, C show relevant changes in multi-temporal analysis. Source: Author
3.3. Surface balance and accuracy
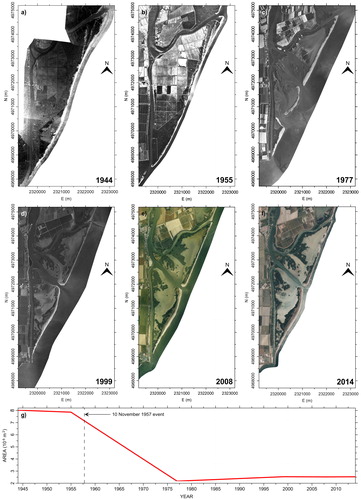
Emerged surface measurements were performed for the nine sub-areas, analysing the data in time: shows the results for sub-area 3 of (Bonelli Levante basin).
Figure 4. Multi-temporal orthophotos (a: 1944, b: 1955, c: 1977, d: 1999, e: 2008, f: 2014) and trend of emerged surfaces (g) of Bonelli Levante basin (sub-area 3): 10 November 1957 storm was intercepted in the comparison between 1955 and 1977 orthophotos (b), (c): area was reduced in size by about 5.69 Mm2 (g). Source: Author
In this study, errors of photogrammetric method (image scales, resolution, orientations phases) and co-registration of data were minor compared with the interpretation of emerged surfaces: in the most unfavourable conditions (1944 and 1955 data, ) co-registration errors affected the values of emerged surfaces by about 1% or less for the sub-areas analysed.
To evaluate errors due to interpretation of emerged surfaces, restitution of the coastline was independently performed and tested by five operators. This was done on the 1955 and 2008 stereoscopic models, due to the different visibility on the aerial images (see ), and for each of the nine sub-areas. lists the average surfaces and SD.
Table 3. Averages and standard deviations of sub-aerial surfaces measured by five operators, in identical conditions, for the nine sub-areas of 1955 and 2008 photogrammetric models.
The worst results were for sub-areas 1 and 9, probably due to the presence of lagoons, which are difficult to interpret. Moreover, due to the poor visibility of the 1955 images, in many sub-areas the values of the standard deviations were about doubled (except the number 9) respect to the 2008 ones.
Data from each of the subsequent photogrammetric surveys were compared, and the differences between multi-temporal measured sub-aerial surfaces revealed emerged or submerged areas. lists the results assuming SD obtained for the 1955 images until the 1962 data (due to poor visibility, ).
Table 4. Comparisons between measured emerged surfaces on subsequent photogrammetric surveys for the nine sub-areas of .
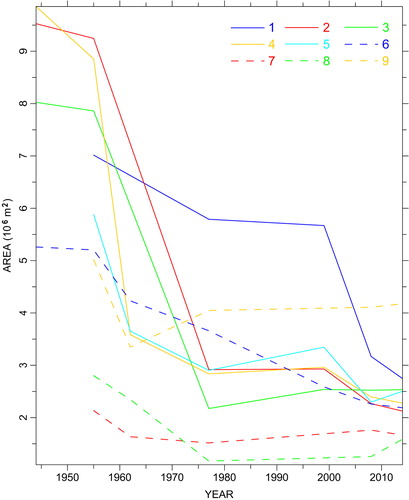
Values of multi-temporal emerged surfaces measured in the last 70 years for the nine sub-areas are shown in .
Figure 5. Trend of emerged surfaces of the nine sub-areas of Figure 1 (continuous and dashed blue, red, green, yellow and cyan lines): data match large submerged areas together with highest available land subsidence values (period 1955–1977), and reduced values for last periods (1977–2014, except area 1). Source: Author
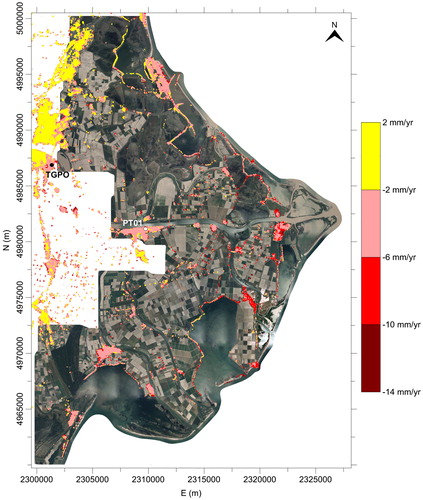
Multi-temporal trend of emerged surfaces in coastal area of PRD was connect also with land subsidence rates values available for the last 25 years; Fiaschi et al. (Citation2018) have used SAR methodology to obtain land subsidence rates of the area: they have described in detail the procedure for the processing, with the A-DInSAR method, of ERS-1/2 (European Remote-Sensing, data from 10 May 1992 to 13 December 2000), ENVISAT (ENVIronmental SATellite, data from 17 March 2004 to 22 September 2010) and Sentinel-1A (data from 17 November 2014 to 17 May 2017) satellites images. Their results, validated using ground-based data (levelling and CGPS), provides land subsidence rates in the coastal area in the order of 1 cm along the line of sight (LOS) of satellites. In the last analysed period (2014–2017), using Sentinel-1A images, the obtained results, along the LOS of satellite, are shown in (data and results were adequately discussed by Fiaschi et al. Citation2018).
Figure 6. Velocities map along the LOS of satellite obtained from processed Sentinel-1A images (data from 17 November 2014 to 17 May 2017) overlapped on the orthophoto of PRD extracted from the aerial photogrammetric survey performed in 2008 (from Fiaschi et al. Citation2018, modified).
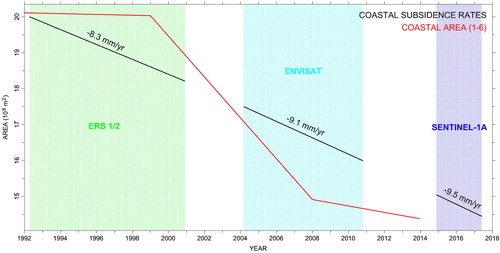
The average land subsidence velocities of the resulting A-DInSAR points along the coastline for the three datasets (ERS-1/2, ENVISAT and Sentinel 1-A), together with the emerged surfaces of the six sub-areas with complete data from 1992 to 2014 (due to continuity of data in the 1999 photogrammetric survey, ) are shown in .
Figure 7. Land subsidence rates along the LOS of satellite in the PRD coastal area obtained averaging the ADInSAR points closer to the coastline (ERS 1/2 from 10 May 1992 to 13 December 2000 in green, ENVISAT from 17 March 2004 to 22 September 2010 in cyan and Sentinel-1A from 17 November 2014 to 17 May 2017 in blue) together with the emerged surfaces of the six sub-areas (from 1 to 6) with complete data from 1992 to 2014 (1999 survey is limited in the northern portion, without data of emerged surfaces for sub-areas 7, 8, 9, ). Source: Author
4. Discussion
Substantial changes in the coastline between surveys were detected: although in the period 1944–1955 the extent of emerged areas decreased slightly ( and ), in the second period (1955–1962, and until 1977) their great reduction occurred concurrently with the highest land subsidence measured (from 250 mm/year to 37.5 mm/year) as described in paragraph 2. This is emphasized in the sub-area 3, the Bonelli Levante basin: this area was abandoned due to persisting land subsidence and after the freak storm of 10 November 1957 (Colombo and Tosini Citation2009). This event was intercepted, as revealed in the comparison between the 1955 and 1977 aerial photogrammetric surveys (). The 1957 event reduced the basin area from 7.86 Mm2 to 2.17 Mm2 (Millions of m2).
In the period 1977–2014 the sub-aerial surface decreased slowly (), matching the reduced land subsidence rates (however, this trend is no confirmed in sub-area 1). Analysing in detail , from 1977 to 1999 in some sub-areas surface recovery has been found, and the total sub-aerial surface has not undergone great variations; from 1999 to 2008 emerged surface decrease more rapidly, especially in the sub-area 1, while, in the last period (2008–2014) total surface do not change significantly, showing more relevant recovery in the Laguna Basson (sub-area 5) and Laguna Vallona (sub-area 8). The anomalous increase in submerged areas of the 1999–2008 period () could be due to the combination of factors: the two surveys were performed at the same time of year (early September 1999, and late August 2008). This means that no seasonal phenomena can explain the variations in the sub-aerial areas, which may also be associated with errors of restitution, lower than measured values (). The phenomenon may be due to extensive human activities in the area, for example, fish and mollusc farming, and improved river navigation, especially near the delta mouths, for purposes of tourism and fishing, combined with the storms which increasingly afflict the whole area (Ericson et al. Citation2006; Carbognin et al. Citation2010): in fact, have to be note that in the last 20 years relevant works of hydraulic arrangement take place in the mainly lagoons of PRD by local and regional authorities (in particular, in Sacca degli Scardovari, Sacca del Canarin, Laguna Basson, Laguna del Burcio, Laguna di Barbamarco and Laguna Vallona, ) to improve the internal circulation of sea water, promoting an adequate change of lagoon water for fish farms aims that needed more efficient environmental hydraulic reorganization: these works, necessary for the economic development of the area, have contributed to modified natural trend of emerged areas.
Taking into account the last 25 years (1992–2017) land subsidence has a non-homogeneous spatial distribution (): increase from West to East, showing more consistent values along the coastline, close to the nine sub-areas analysed in this study. For the same period, the emerged surfaces show decreasing values overall: from , even if the average slope of the lines is similar (coastal land subsidence rates and emerged areas), direct correlation between these two sources of data is not possible, for various reasons: 1 – surface forms, which do not allow clear relationships to be identified between land subsidence and submerged areas near the sea; 2 – human activities (documented works for hydraulic improvements), which have changed natural processes in the coastal area; 3 – sediment transport by the Po river, which may have limited land subsidence, although it has fallen significantly in the last few decades; 4 – SLR, which should have accelerated the submersion of these areas, although values were still low for the analysed period (Carbognin et al. Citation2011; Vibilić et al. Citation2017). These last two factors, which proceed in opposite directions, are very low compared with the first two.
However, one of mainly factors that could be increase the vulnerability of the PRD coastal areas and the protection structures is the effects of the Adriatic Sea eustatism. SLR, connected with land subsidence and its effects in the northern Adriatic, are increasingly evident: in Venice, a reduction in the difference between ground elevation and current average sea level (about 23 cm) has been clear-cut since the early 20th century (Carbognin et al. Citation2004), with increased frequency and intensity of flooding in the lagoon.
Extensive studies have been devoted to reducing the vulnerability of the lagoon to the effects of high water and sea storms, and the Italian authorities chose a solution based on large movable dams, called MOSE (MOdulo Sperimentale Elettromeccanico), located at the three lagoon inlets (Lido, Malamocco, Chioggia). It should now be possible to prevent the water level from rising in the lagoon during exceptionally high water (Achilli et al. Citation2014).
The same problems affect the PRD: results shown in , together with SLR, that has been quantified between 1.20 mm/year and 2 mm/year (Carbognin et al. Citation2011; Vibilić et al. Citation2017), can increase the risk of flooding throughout the area. Even if values of SLR for the analysed period are still limited, several scenario for the next future provides increasing values: Antonioli et al. (Citation2017), using different models and considering the contributions of isostasy and tectonics, provided a relative SLR projection at 2100 for the PRD ranging from 594 mm to 1395 mm. These previsions increases the risks of flooding in the study area, requiring a continuous monitoring of land subsidence, especially for the protection structures (embankments, jetties, etc.).
5. Conclusions
The coastline displacements of the PRD were studied with data from seven aerial photogrammetric surveys performed in 1944, 1955, 1962, 1977, 1999, 2008 and 2014. The dataset includes the period of the most intensive phase of methane water pumping, in operation from 1938 until 1961, which caused considerable land subsidence from the 1950s to the 1970s (), although values have been decreasing until the present.
Photogrammetric data were processed with standard procedures of digital photogrammetry, yielding stereoscopic models, DEMs and orthophotos. Horizontal co-registration of data was checked by multi-temporal common natural points, providing an accuracy of about 2 m for the older photogrammetric surveys and less than 1 m for more recent data.
The coastlines restitutions from multi-temporal data were compared, to evaluate displacements in terms of sub-aerial surface changed: emerged surfaces were measured and compared, showing great changes in the period 1955–1977 and small variations in the most recent one (2008–2014) (, Table 5). In the first case, high land subsidence rates explains the great loss of emerged surface in the PRD coastal areas; in the second case, correlations among various causes must be taken into consideration. Although land subsidence rates have fallen, as demonstrated by available SAR data, they are still high compared with natural trends; the sea level has risen, and human activities in the coastal area, mainly fish-farming and operations to make rivers navigable for tourism and fishing, have increased: all these factors change natural processes. The considerable variations in the coastline have also caused the loss of vast areas of European Community importance in the Parco Regionale Veneto del Delta del Po (SIC – Siti di Importanza Comunitaria, ZPS – Zone di Protezione Speciale, IBA – Important Bird Areas).
In this context, SLR due to climatic changes play a considerable role in PRD area: although its contribution is still limited, mainly for the periods analysed here, in the future the correlation between this phenomenon and the land subsidence may become a serious source of problems for PRD by increasing the risk of flooding.
Finally, the method presented in this study for PRD coast can be applied worldwide in similar areas expected to be affected by low values of land subsidence.
Disclosure statement
No potential conflict of interest was reported by the authors.
Additional information
Funding
Related Research Data
References
- Achilli V, Carrubba P, Fabris M, Menin A, Pavanello P. 2014. Geomatic and Geotechnical Monitoring of Settlements in the Venice Lagoon (Italy). J Civ Eng Archit. 8(3):276–288.
- Antonioli F, Anzidei M, Amorosi A, Lo Presti V, Mastronuzzi G, Deiana G, De Falco G, Fontana A, Fontolan G, Liscio S, et al. 2017. Sea-level rise and potential drowning of the Italian coastal plains: Flooding risk scenarios for 2100. Quat Sci Rev. 158:29–43.
- Arca S, Beretta GP. 1985. First geodetic-geological synthesis about the vertical soil movements in Northern Italy [Prima sintesi geodetica-geologica sui movimenti verticali del suolo nell’Italia Settentrionale]. Boll Geodesia Sci Affini. 44:125–156. (In Italian)
- Baldi P, Fabris M, Marsella M, Monticelli R. 2005. Monitoring the morphological evolution of the Sciara del Fuoco during the 2002–2003 Stromboli eruption using multi-temporal photogrammetry. ISPRS J Photogram Remote Sens. 59(4):199–211.
- Baldi P, Fabris M, Marsella M, Monticelli R, Achilli V. 2006. Application of digital terrain model to volcanology. Ann Geophys. 49(4/5):895–902.
- Baldi P, Cenni N, Fabris M, Zanutta A. 2008. Kinematics of a landslide derived from archival photogrammetry and GPS data. Geomorphology. 102(3–4):435–444.
- Baldi P, Coltelli M, Fabris M, Marsella M, Tommasi P. 2008. High precision photogrammetry for monitoring the evolution of Sciara del Fuoco after the 2002–2003 Stromboli eruption. Bull Volcanol. 70(6):703–715.
- Baldi P, Casula G, Cenni N, Loddo F, Pesci A. 2009. GPS-based monitoring of land subsidence in the Po Plain (Northern Italy). Earth Planet Sci Lett. 288(1–2):204–212.
- Barbarella M, Pieri L, Russo P. 1990. Study of the soil lowering in the Bologna area through repeated leveling: analysis of movements and statistical considerations [Studio dell’abbassamento del suolo nel territorio bolognese mediante livellazioni ripetute: analisi dei movimenti e considerazioni statistiche]. Inarcos. 506:1–19. (In Italian)
- Bitelli G, Bonsignore F, Unguendoli M. 2000. Levelling and GPS networks to monitor ground subsidence in the Southern Po Valley. J Geodyn. 30(3):355–369.
- Bock Y, Wdowinski S, Ferretti A, Novali F, Fumagalli A. 2012. Recent subsidence of the Venice Lagoon from continuous GPS and interferometric synthetic aperture radar. Geochem Geophys. 13(3):Q03023.
- Bondesan M, Minarelli A, Russo P. 1990. Analysis of the vertical movements of the soil in the period 1970–1978 along the Po river in the east of Polesella and in the Delta [Analisi dei movimenti verticali del suolo avvenuti nel periodo 1970–1978 lungo l’asta del Po ad est di Polesella e nel Delta]. PO AcquAgricolturAmbiente. L’alveo il Delta. 2:385–407. (In Italian)
- Bondesan M, Gatti M, Russo P. 1997. Vertical movements of the ground in the Eastern Po Plain deduced from the I.G.M. data until the end of 1990 [Movimenti verticali del suolo nella Pianura Padana orientale desumibili dai dati I.G.M. fino a tutto il 1990]. Boll Geodesia Sci Affini. 56(2):141–172. (In Italian)
- Borgia G, Brighenti G, Vitali D. 1982. The cultivation of the Metaniferous wells in the rovigo and Ferrara Basin. Critical examination of the event [La Coltivazione dei Pozzi Metaniferi del Bacino Polesano e Ferrarese. Esame Critico della Vicenda]. Inarcos, Georisorse e Territorio. 425:13–23. (In Italian)
- Brückl E, Brunner FK, Kraus K. 2006. Kinematics of a deep-seated landslide derived from photogrammetric, GPS and geophysical data. Eng Geol. 88(3–4):149–159.
- Caputo M, Pieri L, Unguendoli M. 1970. Geometric investigation of the subsidence in the Po Delta. Boll Geofis Teor Applicata. 47:187–207.
- Caputo M, Folloni G, Gubellini A, Pieri L, Unguendoli M. 1972. Survey and geometric analysis of the phenomena of subsidence in the region of Venice and its hinterland. Riv Ital Geofis. 21(1/2):19–26.
- Carbognin L, Tosi L. 2002. Interaction between climate changes, Eustacy and land subsidence in the North Adriatic Region, Italy. Marine Ecol. 23(S1):38–50.
- Carbognin L, Teatini P, Tosi L. 2004. Eustacy and land subsidence in the Venice Lagoon at the beginning of the new millennium. J Marine Systems. 51(1–4):345–353.
- Carbognin L, Teatini P, Tomasin A, Tosi L. 2010. Global change and relative sea level rise at Venice: what impact in term of flooding. Clim Dyn. 35(6):1039–1047.
- Carbognin L, Teatini P, Tosi L, Strozzi T, Tomasin A. 2011. Present relative sea level rise in the northern Adriatic coastal area. In: Brugnoli E, Cavarretta G, Mazzola S, Trincardi F, Ravaioli M, Santoleri R, editors. Coastal and marine spatial planning. Marine Research at CNR-Theme 3; Roma, Italy: CNR-DTA; p. 1123–1138.
- Carminati E, Martinelli G. 2002. Subsidence rates in the Po Plain, northern Italy: the relative impact of natural and anthropogenic causation. Eng Geol. 66(3–4):241–255.
- Carminati E, Martinelli G, Severi P. 2003. Influence of glacial cycles and tectonics on natural subsidence in the Po Plain (Northern Italy): Insights from 14C ages. Geochem Geophys. 4(10):1–14.
- Cenni N, Viti M, Baldi P, Mantovani E, Bacchetti M, Vannucchi A. 2013. Present vertical movements in Central and Northern Italy from GPS data: Possible role of natural and anthropogenic causes. J Geodyn. 71:74–85.
- Chandler JH, Cooper M. 1988a. Monitoring the development of landslides using archival photography and analytical photogrammetry. Land Min Surv R Inst of Chart Surv. 6:576–584.
- Chandler JH, Cooper M. 1998b. The extraction of positional data from historical photographs and their application in geomorphology. Photogramm Rec. 13(73):69–78.
- Chandler JH, Brunsden D. 1995. Steady state behaviour of the Black Ven mudslide: the application of archival analytical photogrammetry to study of landform change. Earth Surf Process Landform. 20(3):255–275.
- Chandler JH, Lane S, Walstra J. 2007. Quantifying landform change. In: Fryer J, Mitchell H, Chandler JH, editors. Applications of 3D measurement from images. Dunbeath: Whittles Publishing; p. 139–170.
- Colombo C, Tosini L. 2009. Sixty years of reclamation in the Po delta [Sessant’anni di bonifica nel delta del Po]. Padova (IT): Papergraf S.p.a. Italian.
- Costantini M, Ferretti A, Minati F, Falco S, Trillo F, Colombo D, Novali F, Malvarosa F, Mammone C, Vecchioli F, et al. 2017. Analysis of surface deformations over the whole Italian territory by interferometric processing of ERS, Envisat and COSMO-SkyMed radar data. Remote Sens Environ. 202:250–275.
- Dal Cin R. 1983. The shorelines of the Po delta and the Adige and Brenta rivers mouths: textural features and dispersion of sediments due to the retreat and previsions on the future evolution [I litorali del delta del Po e alle foci dell’Adige e del Brenta: caratteri tessiturali e dispersione dei sedimenti cause dell’arretramento e previsioni sull’evoluzione futura]. Boll Società Geologica Italiana. 102:9–56. (In Italian)
- Ericson JP, Vörösmarty CJ, Dingman SL, Ward LG, Meybeck M. 2006. Effective sea level rise and deltas: causes of change and human dimension implication. Global Planet Change. 50(1–2):63–82.
- Fabris M, Pesci A. 2005. Automated DEM extraction in digital aerial photogrammetry: precisions and validation for mass movement monitoring. Ann Geophys. 48(6):57–72.
- Fabris M, Baldi P, Anzidei M, Pesci A, Bortoluzzi G, Aliani S. 2010. High resolution topographic model of Panarea island by fusion of photogrammetric, lidar and bathymetric Digital Terrain Models. Photogram Rec. 25(132):382–401.
- Fabris M, Menin A, Achilli V. 2011. Landslide displacement estimation by archival digital photogrammetry. ItJRS. 43(2):23–30.
- Fabris M, Achilli V, Menin A. 2014. Estimation of subsidence in Po delta area (northern Italy) by integration of GPS data, high-precision levelling and archival orthometric elevations. IJG. 5(6):571–585.
- Fiaschi S, Fabris M, Floris M, Achilli V. 2018. Estimation of land subsidence in deltaic areas through differential SAR interferometry: the Po River Delta case study (NE Italy). Int J Remote Sens.DOI: 10.1080/01431161.2018.1490977
- Gornitz V. 1995. Sea-level rise: A review of recent past and near-future trends. Earth Surf Process Landform. 20(1):7–20.
- Hung WC, Hwang C, Chen YA, Zhang L, Chen KH, Wei SH, Huang DR, Lin SH. 2018. Land subsidence in Chiayi, Taiwan, from compaction well, leveling and ALOS/PALSAR: aquaculture-induced relative sea level rise. Remote Sens. 10:40.
- Kraus K. 1993. Photogrammetry: Fundamentals and standard processes, Vol. 1. Bonn: Dümmler Verlag.
- Jeftic L, Keckes S, Pernetta JC. 1996. Implications of future climatic changes for the Mediterranean coastal region. In: Jeftic L, Keckes S, Pernetta JC, editors. Climate change and the Mediterranean, Vol. 2. London: Edward Arnold; p. 1–25.
- Mancini F, Dubbini M, Gattelli M, Stecchi F, Fabbri S, Gabbianelli G. 2013. Using unmanned aerial vehicles (UAV) for high-resolution reconstruction of topography: the structure from motion approach on coastal environments. Remote Sens. 5(12):6880–6898.
- Mantovani E, Babbucci D, Tamburelli C, Viti M. 2009. A review on the driving mechanism of the Tyrrhenian-Apennines system: implications for the present seismotectonic setting in the Central-Northern Apennines. Tectonophysics. 476(1–2):22–40.
- Marsella M, Baldi P, Coltelli M, Fabris M. 2012. The morphological evolution of the Sciara del Fuoco since 1868: reconstructing the effusive activity at Stromboli volcano. Bull Volcanol. 74(1):231–248.
- Minderhoud PSJ, Erkens G, Pham VH, Bui VT, Erban L, Kooi H, Stouthamer E. 2017. Impacts of 25 years of groundwater extraction on subsidence in the Mekong delta, Vietnam. Environ Res Lett. 12(6):064006.
- Pesci A, Baldi P, Bedin A, Casula G, Cenni N, Fabris M, Loddo F, Mora P, Bacchetti M. 2004. Digital elevation models for landslide evolution monitoring: application on two areas located in the Reno river valley (Italy). Ann Geophys. 47(4):1339–1353.
- Pesci A, Fabris M, Conforti D, Loddo F, Baldi P, Anzidei M. 2007. Integration of ground-based laser scanner and aerial digital photogrammetry for topographic modelling of Vesuvio volcano. J Volcanol Geotherm Res. 162(3–4):123–138.
- Pesci A, Teza G, Casula G, Fabris M, Bonforte A. 2013. Remote sensing and geodetic measurements for volcanic slope monitoring: Surface variations measured at Northern flank of La Fossa Cone (Vulcano Island, Italy). Remote Sens. 5(5):2238–2256.
- Picotti V, Pazzaglia FJ. 2008. A new active tectonic model for the construction of the Northern Apennines mountain front near Bologna (Italy). J Geophys Res. 113:B08412.
- Salvioni G. 1957. The soil movements in Central-Northern Italy [I movimenti del suolo nell’Italia Centro-Settentrionale]. Boll Geodesia Sci Affini. 16(3):325–366. (In Italian)
- Simeoni U, Corbau C. 2008. A review of the Delta Po evolution (Italy) related to climatic changes and human impacts. Geomorphology. 107:64–71.
- Syvitski JPM, Kettner AJ, Overeem I, Hutton EWH, Hannon MT, Brakenridge GR, Day J, Vörösmarty C, Saito Y, Giosan L, et al. 2009. Sinking deltas due to human activities. Nature Geosci. 2(10):681–686.
- Teatini P, Tosi L, Strozzi T, Carbognin L, Cecconi G, Rosselli R, Libardo S. 2012. Resolving land subsidence within the Venice Lagoon by persistent scatterer SAR interferometry. Phys Chem Earth. 40–41:72–79.
- Tosi L, Da Lio C, Strozzi T, Teatini P. 2016. Combining L- and X-Band SAR interferometry to assess ground displacements in heterogeneous Coastal environments: The Po River Delta and Venice Lagoon, Italy. Remote Sens. 8(4):308.
- Vibilić I, Šepić J, Pasarić M, Orlić M. 2017. The Adriatic Sea: A Long-Standing Laboratory for Sea Level Studies. Pure Appl Geophys. 174:3765–3811.
- Zambon M. 1967. Subsidence of the Ground for Water and Gas Extractions: Deductions and Addresses Logically Consequent for the Settlement of the Po River Delta [Abbassamento del Suolo per Estrazioni di Acqua e Gas: Deduzioni ed Indirizzi Logicamente Conseguenti per la Sistemazione del Delta del Fiume Po]. Proceedings of the 23nd National Conference on “Bonifiche”; May 20; Rome, Italy. p. 345–370. (In Italian)
- Walstra J, Chandler JH, Dixon N, Dijkstra TA. 2004. Extracting landslide movements from historical aerial photographs. In: Lacerda W, Erlich M, Fontoura SAB, Sayao ASF, editors. Landslides: Evaluation and stabilization. London: Taylor & Francis; p. 843–850.